 |
| |
| |
| |
| |
| |
| |
|

| TissGeneSummary for STAC2 |
 Gene summary Gene summary |
| Basic gene information | Gene symbol | STAC2 |
| Gene name | SH3 and cysteine rich domain 2 | |
| Synonyms | 24b2|24b2/STAC2 | |
| Cytomap | UCSC genome browser: 17q12 | |
| Type of gene | protein-coding | |
| RefGenes | NM_198993.3, | |
| Description | SH3 and cysteine-rich domain-containing protein 2SRC homology 3 and cysteine-rich domain-containing protein 2 | |
| Modification date | 20141207 | |
| dbXrefs | HGNC : HGNC | |
| Ensembl : ENSG00000141750 | ||
| HPRD : 18113 | ||
| Vega : OTTHUMG00000179039 | ||
| Protein | UniProt: go to UniProt's Cross Reference DB Table | |
| Expression | CleanEX: HS_STAC2 | |
| BioGPS: 342667 | ||
| Pathway | NCI Pathway Interaction Database: STAC2 | |
| KEGG: STAC2 | ||
| REACTOME: STAC2 | ||
| Pathway Commons: STAC2 | ||
| Context | iHOP: STAC2 | |
| ligand binding site mutation search in PubMed: STAC2 | ||
| UCL Cancer Institute: STAC2 | ||
| Assigned class in TissGDB* | C | |
| Included tissue-specific gene expression resources | TiGER,GTEx | |
| Specific-tissues in normal samples (assigned by TissGDB using HPA, TiGER, and GTEx) | BreastEye | |
| Cancer types related to the specific-tissues in cancer samples (assigned by TissGDB using TCGA) | BRCAUVM | |
| Reference showing the relevant tissue of STAC2 | ||
| Description by TissGene annotations | ||
| * Class A consists of genes with literature evidence and is part of the cTissGenes. Class B consists of only cTissGenes without additional evidence. The remaining genes belong to Class C. |
| Gene ontology having evidence of Inferred from Direct Assay (IDA) from Entrez |
| GO ID | GO term | PubMed ID |
| Top |
| TissGeneExp for STAC2 |
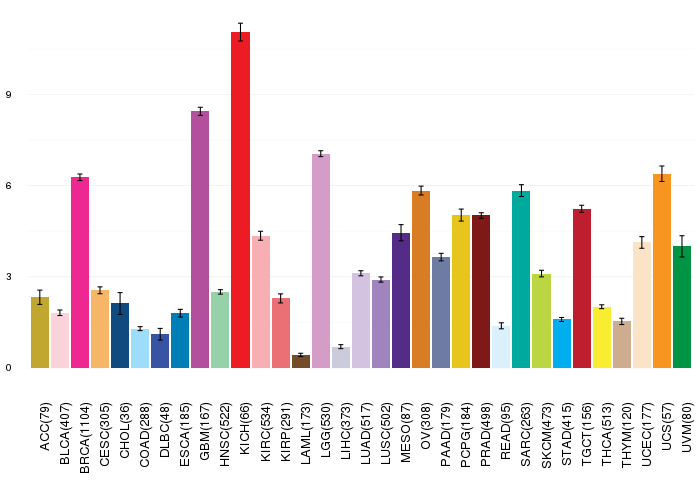
| Gene expressions across 28 cancer types (X-axis: cancer type and Y-axis: log2(norm_counts+1)) (TCGA IlluminaHiSeq_RNASeqV2, pan-cancer normalized log2(norm_counts+1) data, version 2016-08-16) |
 |
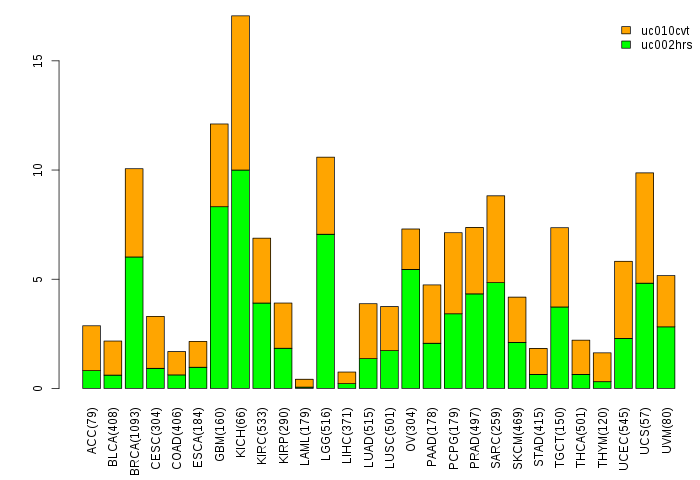
| Gene isoform expressions across 28 cancer types (X-axis: cancer type and Y-axis: log2(norm_counts+1)) (TCGA pan-cancer tcga_rsem_isoform_tpm, version 2016-09-01) |
 |
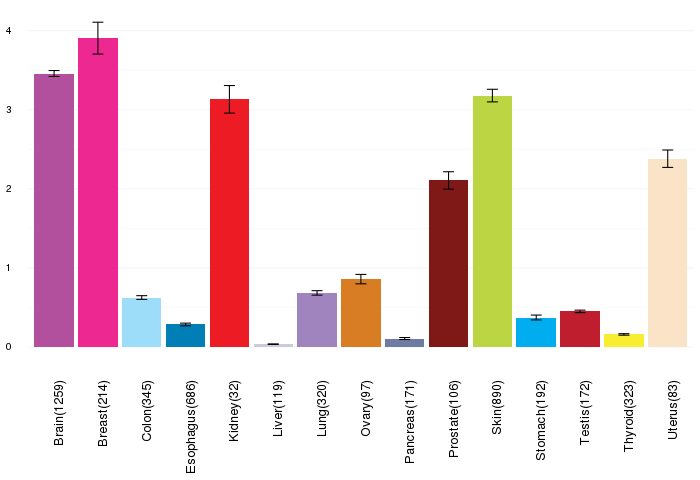
| Gene expressions across normal tissues of GTEx data (GTEx GTEx_Analysis_v6_RNA-seq_RNA-SeQCv1.1.8_gene_rpkm.gct) - Here, we shows the matched tissue types only among our 28 cancer types. |
 |
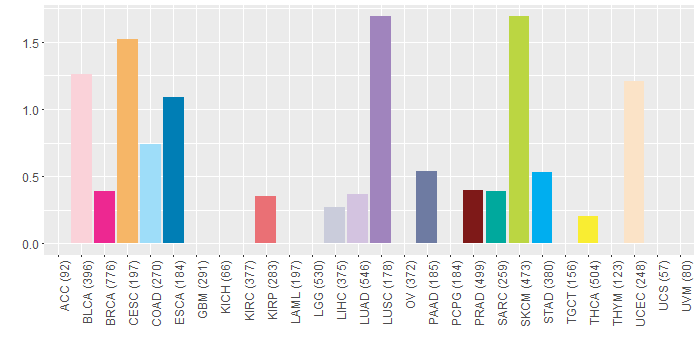
| Different expressions across 14 cancer types with more than 10 samples between matched tumors and normals (X-axis: cancer type and Y-axis: log2(norm_counts+1)) (TCGA IlluminaHiSeq_RNASeqV2, pan-cancer normalized log2(norm_counts+1) data, version 2016-08-16) |
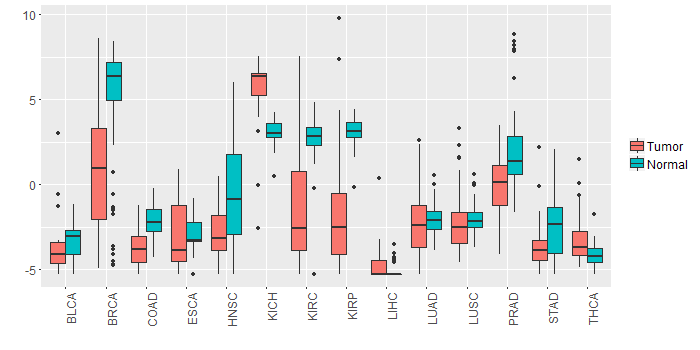 |
| - Significantly differentially expressed cancer types and information. (|Fold change|>1 and FDR<0.05) |
| Cancer type | Mean(exp) in tumor | Mean(exp) in matched normal | Log2FC | P-val. | FDR |
| KICH | 5.439863398 | 3.012291398 | 2.427572 | 3.06E-05 | 8.85E-05 |
| PRAD | 0.032037013 | 2.102600475 | -2.070563462 | 1.04E-05 | 5.73E-05 |
| BRCA | 0.767308099 | 5.31227038 | -4.544962281 | 6.65E-21 | 5.10E-20 |
| HNSC | -2.848874928 | -0.382847021 | -2.466027907 | 6.22E-06 | 3.74E-05 |
| COAD | -3.768611064 | -2.103853372 | -1.664757692 | 6.01E-07 | 3.53E-06 |
| KIRC | -1.319219825 | 2.721406564 | -4.040626389 | 3.60E-16 | 1.98E-15 |
| KIRP | -1.608022602 | 3.128446148 | -4.73646875 | 1.57E-08 | 1.17E-07 |
| Top |
| TissGene-miRNA for STAC2 |
| Significantly anti-correlated miRNAs of TissGene across 28 cancer types (Gene-miRNA relations from TargetScanHuman Relsease 7.1, Conserved_Site_Context_Scores.txt.zip, 06.01.2016) (TCGA IlluminaHiSeq_miRNASeq, log2(RPM+1) data, version 2016-11-21) (TCGA IlluminaHiSeq_RNASeqV2, log2(normalized_count+1) data, version 2016-08-16) (Spearman’s Rank Correlation (p-value<0.05 and coefficient<-0.25)) |
| Cancer type | miRNA id | miRNA accession | P-val. | Coeff. | # samples |
| Top |
| TissGeneMut for STAC2 |
| TissGeneSNV for STAC2 |
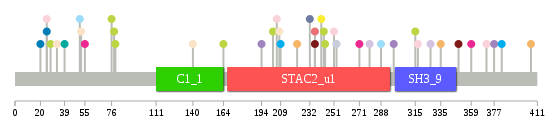
| nsSNV counts per each loci. Different colors of circles represent different cancer types. Circle size denotes number of samples. (TCGA somatic mutation (SNPs and small INDELs) data, version 2016-04-25) * Click on the image to enlarge it in a new window. |
 |
 |
| Somatic nucleotide variants of TissGene across 28 cancer types (X-axis: cancer type and Y-axis: % of mutated samples) The numbers in parentheses are numbers of samples with mutation (nsSNVs). (TCGA somatic mutation (SNPs and small INDELs) data, version 2016-04-25) |
 |
| - nsSNVs sorted by frequency. |
| AAchange | Cancer type | # samples |
| p.E327D | LUAD | 1 |
| p.P203L | SKCM | 1 |
| p.V298L | LUSC | 1 |
| p.R288Q | COAD | 1 |
| p.E206D | BLCA | 1 |
| p.F52L | UCEC | 1 |
| p.R140Q | UCEC | 1 |
| p.G335C | CESC | 1 |
| p.K164N | SKCM | 1 |
| p.P76L | SKCM | 1 |
| p.G279V | LUAD | 1 |
| p.A25T | BLCA | 1 |
| p.S232N | PAAD | 1 |
| p.M371I | BLCA | 1 |
| p.R33Q | UCEC | 1 |
| p.E241K | THCA | 1 |
| p.S39F | SARC | 1 |
| p.E28K | SKCM | 1 |
| p.F222L | CESC | 1 |
| p.L208M | UCEC | 1 |
| p.P79S | SKCM | 1 |
| p.E251Q | BLCA | 1 |
| p.A25V | ESCA | 1 |
| p.P271T | BRCA | 1 |
| p.V349E | PRAD | 1 |
| p.P20T | ESCA | 1 |
| p.D317N | BLCA | 1 |
| p.G253W | LIHC | 1 |
| p.R55H | BRCA | 1 |
| p.C359W | BRCA | 1 |
| p.P315L | SKCM | 1 |
| p.G243E | SKCM | 1 |
| p.G383C | STAD | 1 |
| p.E244K | SKCM | 1 |
| p.D406H | CESC | 1 |
| p.R236L | PRAD | 1 |
| p.N51K | COAD | 1 |
| p.R236L | KIRP | 1 |
| p.P194H | LUSC | 1 |
| p.S78F | SKCM | 1 |
| p.R209H | STAD | 1 |
| p.Q377K | LUSC | 1 |
| Top |
| TissGeneCNV for STAC2 |
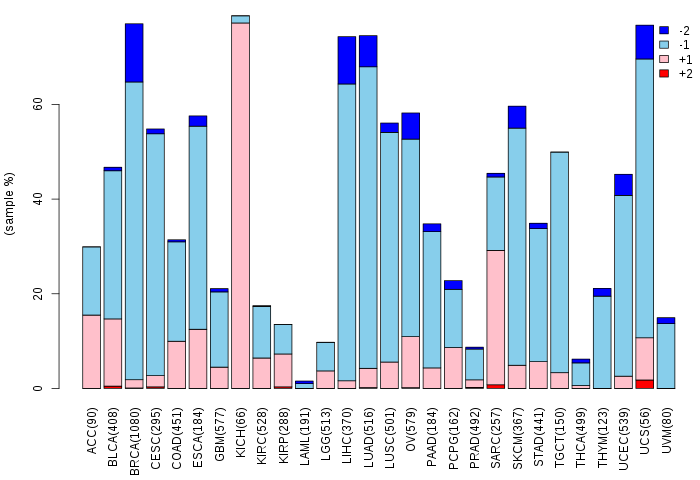
| Copy number variations of TissGene across 28 cancer types (X-axis: cancer type and Y-axis: % of CNV samples) (TCGA Gistic2_CopyNumber_Gistic2_all_data_by_genes, Gistic2 copy number data, version 2016-08-16) |
 |
| Top |
| TissGeneFusions for STAC2 |
| Fusion genes including TissGene (ChimerDB 3.0, 2016-12-01 and TCGA fusion Portal 2015-12-01) |
| Database | Src | Cancer type | Sample | Fusion gene | ORF | 5'-gene BP | 3'-gene BP |
| Chimerdb3.0 | ChiTaRs | NA | XX000005 | ACACA-STAC2 | chr17:35479523 | chr17:37374348 | |
| Chimerdb3.0 | FusionScan | PRAD | TCGA-CH-5745-01A | COPA-STAC2 | Out-of-Frame | chr1:160312920 | chr17:37374426 |
| Chimerdb3.0 | FusionScan | BRCA | TCGA-A8-A08X-01A | PGAP3-STAC2 | In-Frame | chr17:37844086 | chr17:37373426 |
| Chimerdb3.0 | FusionScan | LUAD | TCGA-55-1592-01A | RARA-STAC2 | 5'UTR-CDS | chr17:38474700 | chr17:37374426 |
| Chimerdb3.0 | TopHat-Fusion | BRCA | TCGA-A8-A08X-01A | PGAP3-STAC2 | In-Frame | chr17:37844086 | chr17:37373425 |
| TCGAfusionPortal | PRADA | LUAD | TCGA-55-1592-01A | RARA-STAC2 | 5UTR-CDS | Chr17:38474700 | Chr17:37374426 |
| Top |
| TissGeneNet for STAC2 |
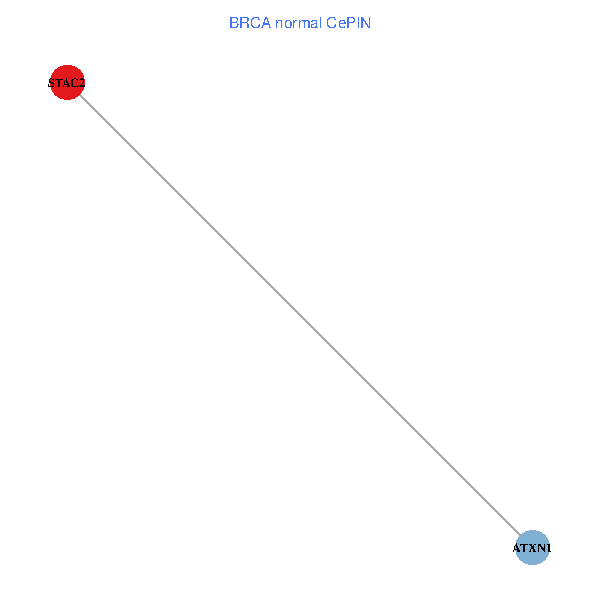
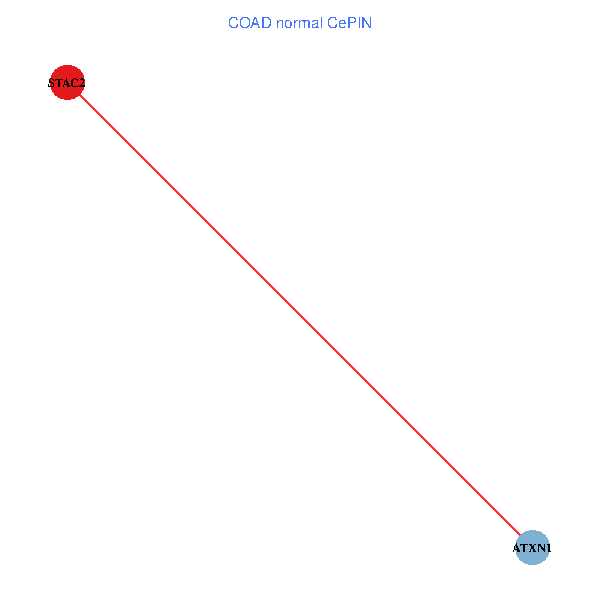
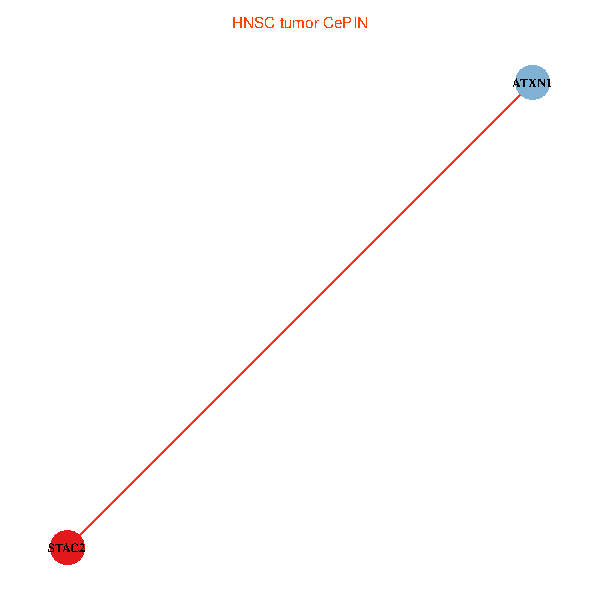
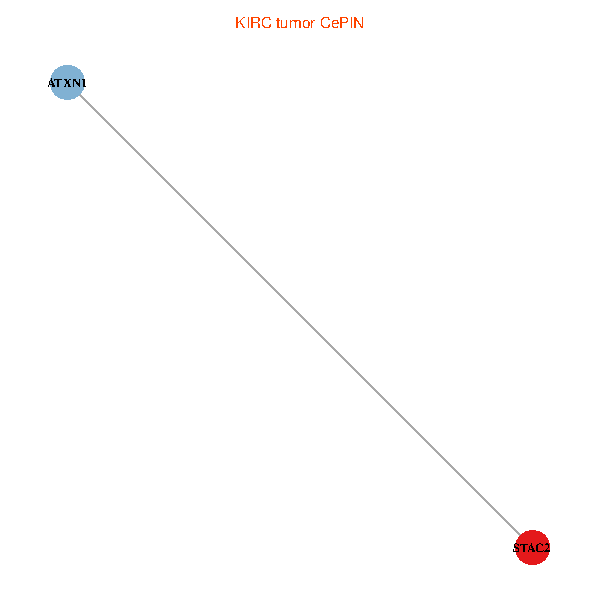
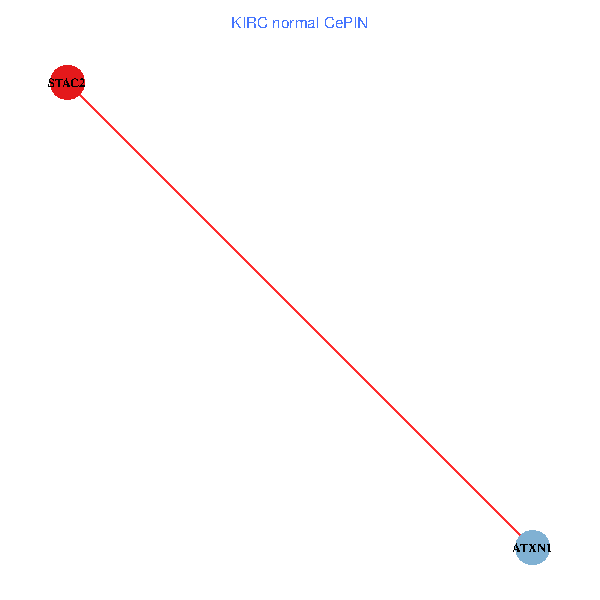
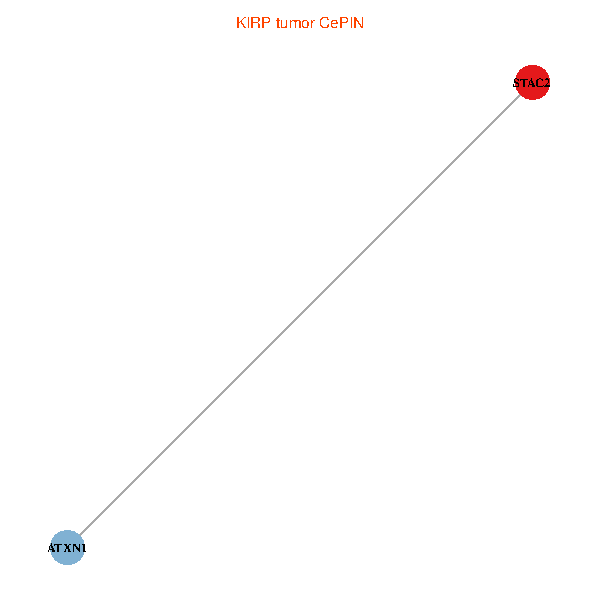
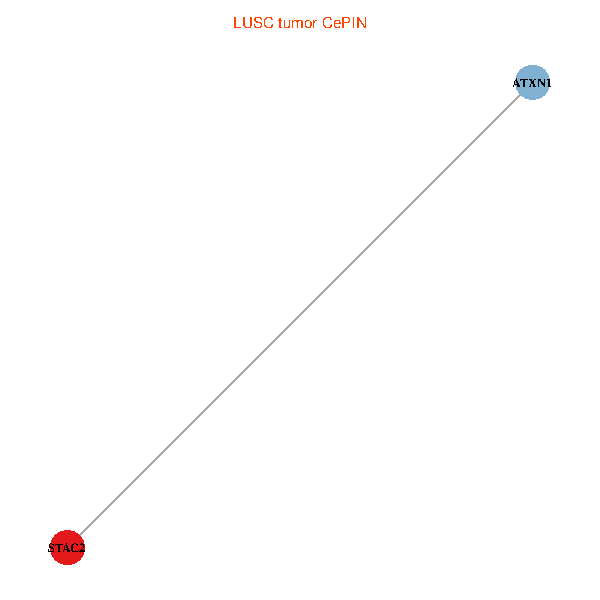
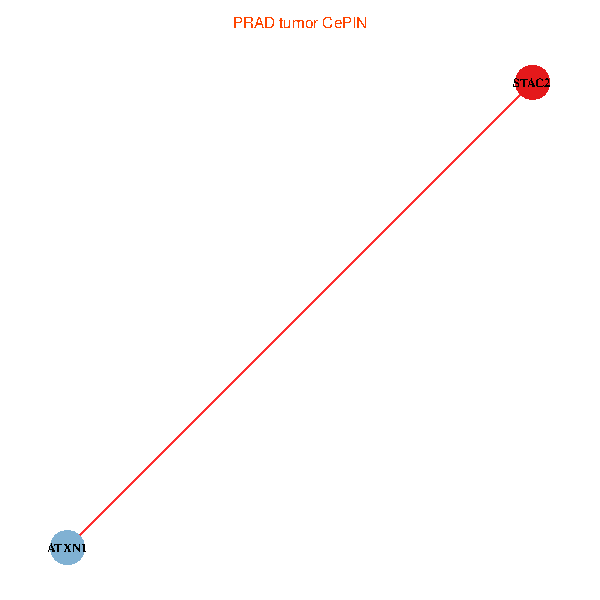
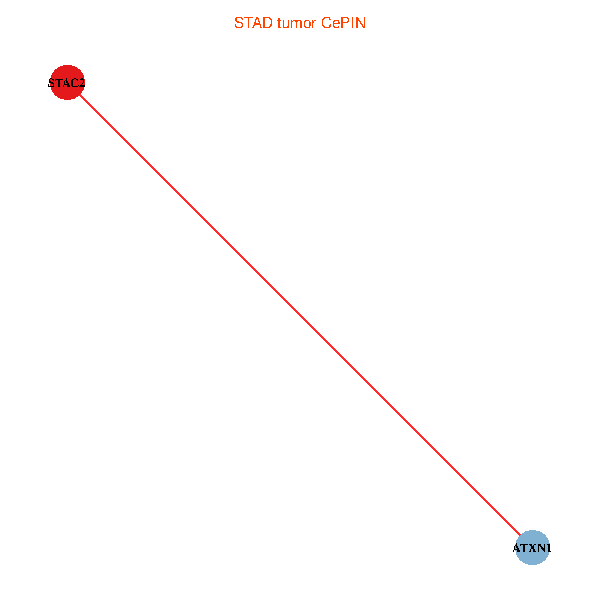
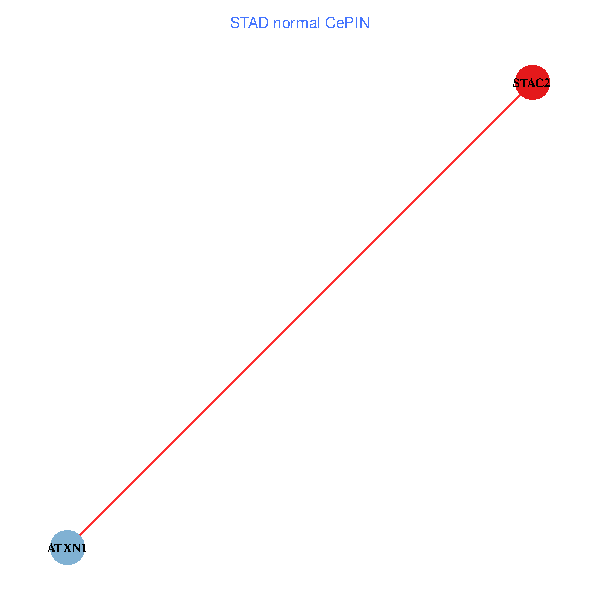
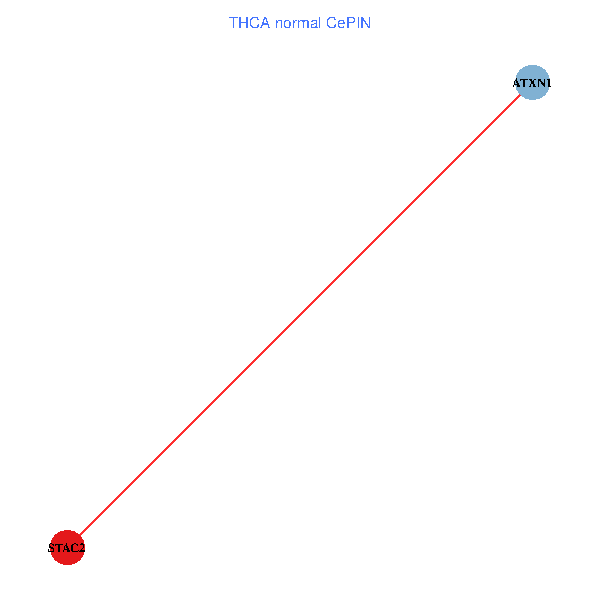
| Co-expressed gene networks based on protein-protein interaction data (CePIN) (TCGA IlluminaHiSeq_RNASeqV2, pan-cancer normalized log2(norm_counts+1) data, version 2016-08-16) (PINA2 ppi data) |
| BRCA (tumor) | BRCA (normal) |
| STAC2, ATXN1 (tumor) | STAC2, ATXN1 (normal) |
 |  |
| COAD (tumor) | COAD (normal) |
| STAC2, ATXN1 (tumor) | STAC2, ATXN1 (normal) |
 |  |
| HNSC (tumor) | HNSC (normal) |
| STAC2, ATXN1 (tumor) | STAC2, ATXN1 (normal) |
 |  |
| KICH (tumor) | KICH (normal) |
| STAC2, ATXN1 (tumor) | STAC2, ATXN1 (normal) |
 |  |
| KIRC (tumor) | KIRC (normal) |
| STAC2, ATXN1 (tumor) | STAC2, ATXN1 (normal) |
 |  |
| KIRP (tumor) | KIRP (normal) |
| STAC2, ATXN1 (tumor) | STAC2, ATXN1 (normal) |
 |  |
| LIHC (tumor) | LIHC (normal) |
| STAC2, ATXN1 (tumor) | STAC2, ATXN1 (normal) |
 |  |
| LUAD (tumor) | LUAD (normal) |
| STAC2, ATXN1 (tumor) | STAC2, ATXN1 (normal) |
 |  |
| LUSC (tumor) | LUSC (normal) |
| STAC2, ATXN1 (tumor) | STAC2, ATXN1 (normal) |
 |  |
| PRAD (tumor) | PRAD (normal) |
| STAC2, ATXN1 (tumor) | STAC2, ATXN1 (normal) |
 |  |
| STAD (tumor) | STAD (normal) |
| STAC2, ATXN1 (tumor) | STAC2, ATXN1 (normal) |
 |  |
| THCA (tumor) | THCA (normal) |
| STAC2, ATXN1 (tumor) | STAC2, ATXN1 (normal) |
 |  |
| Top |
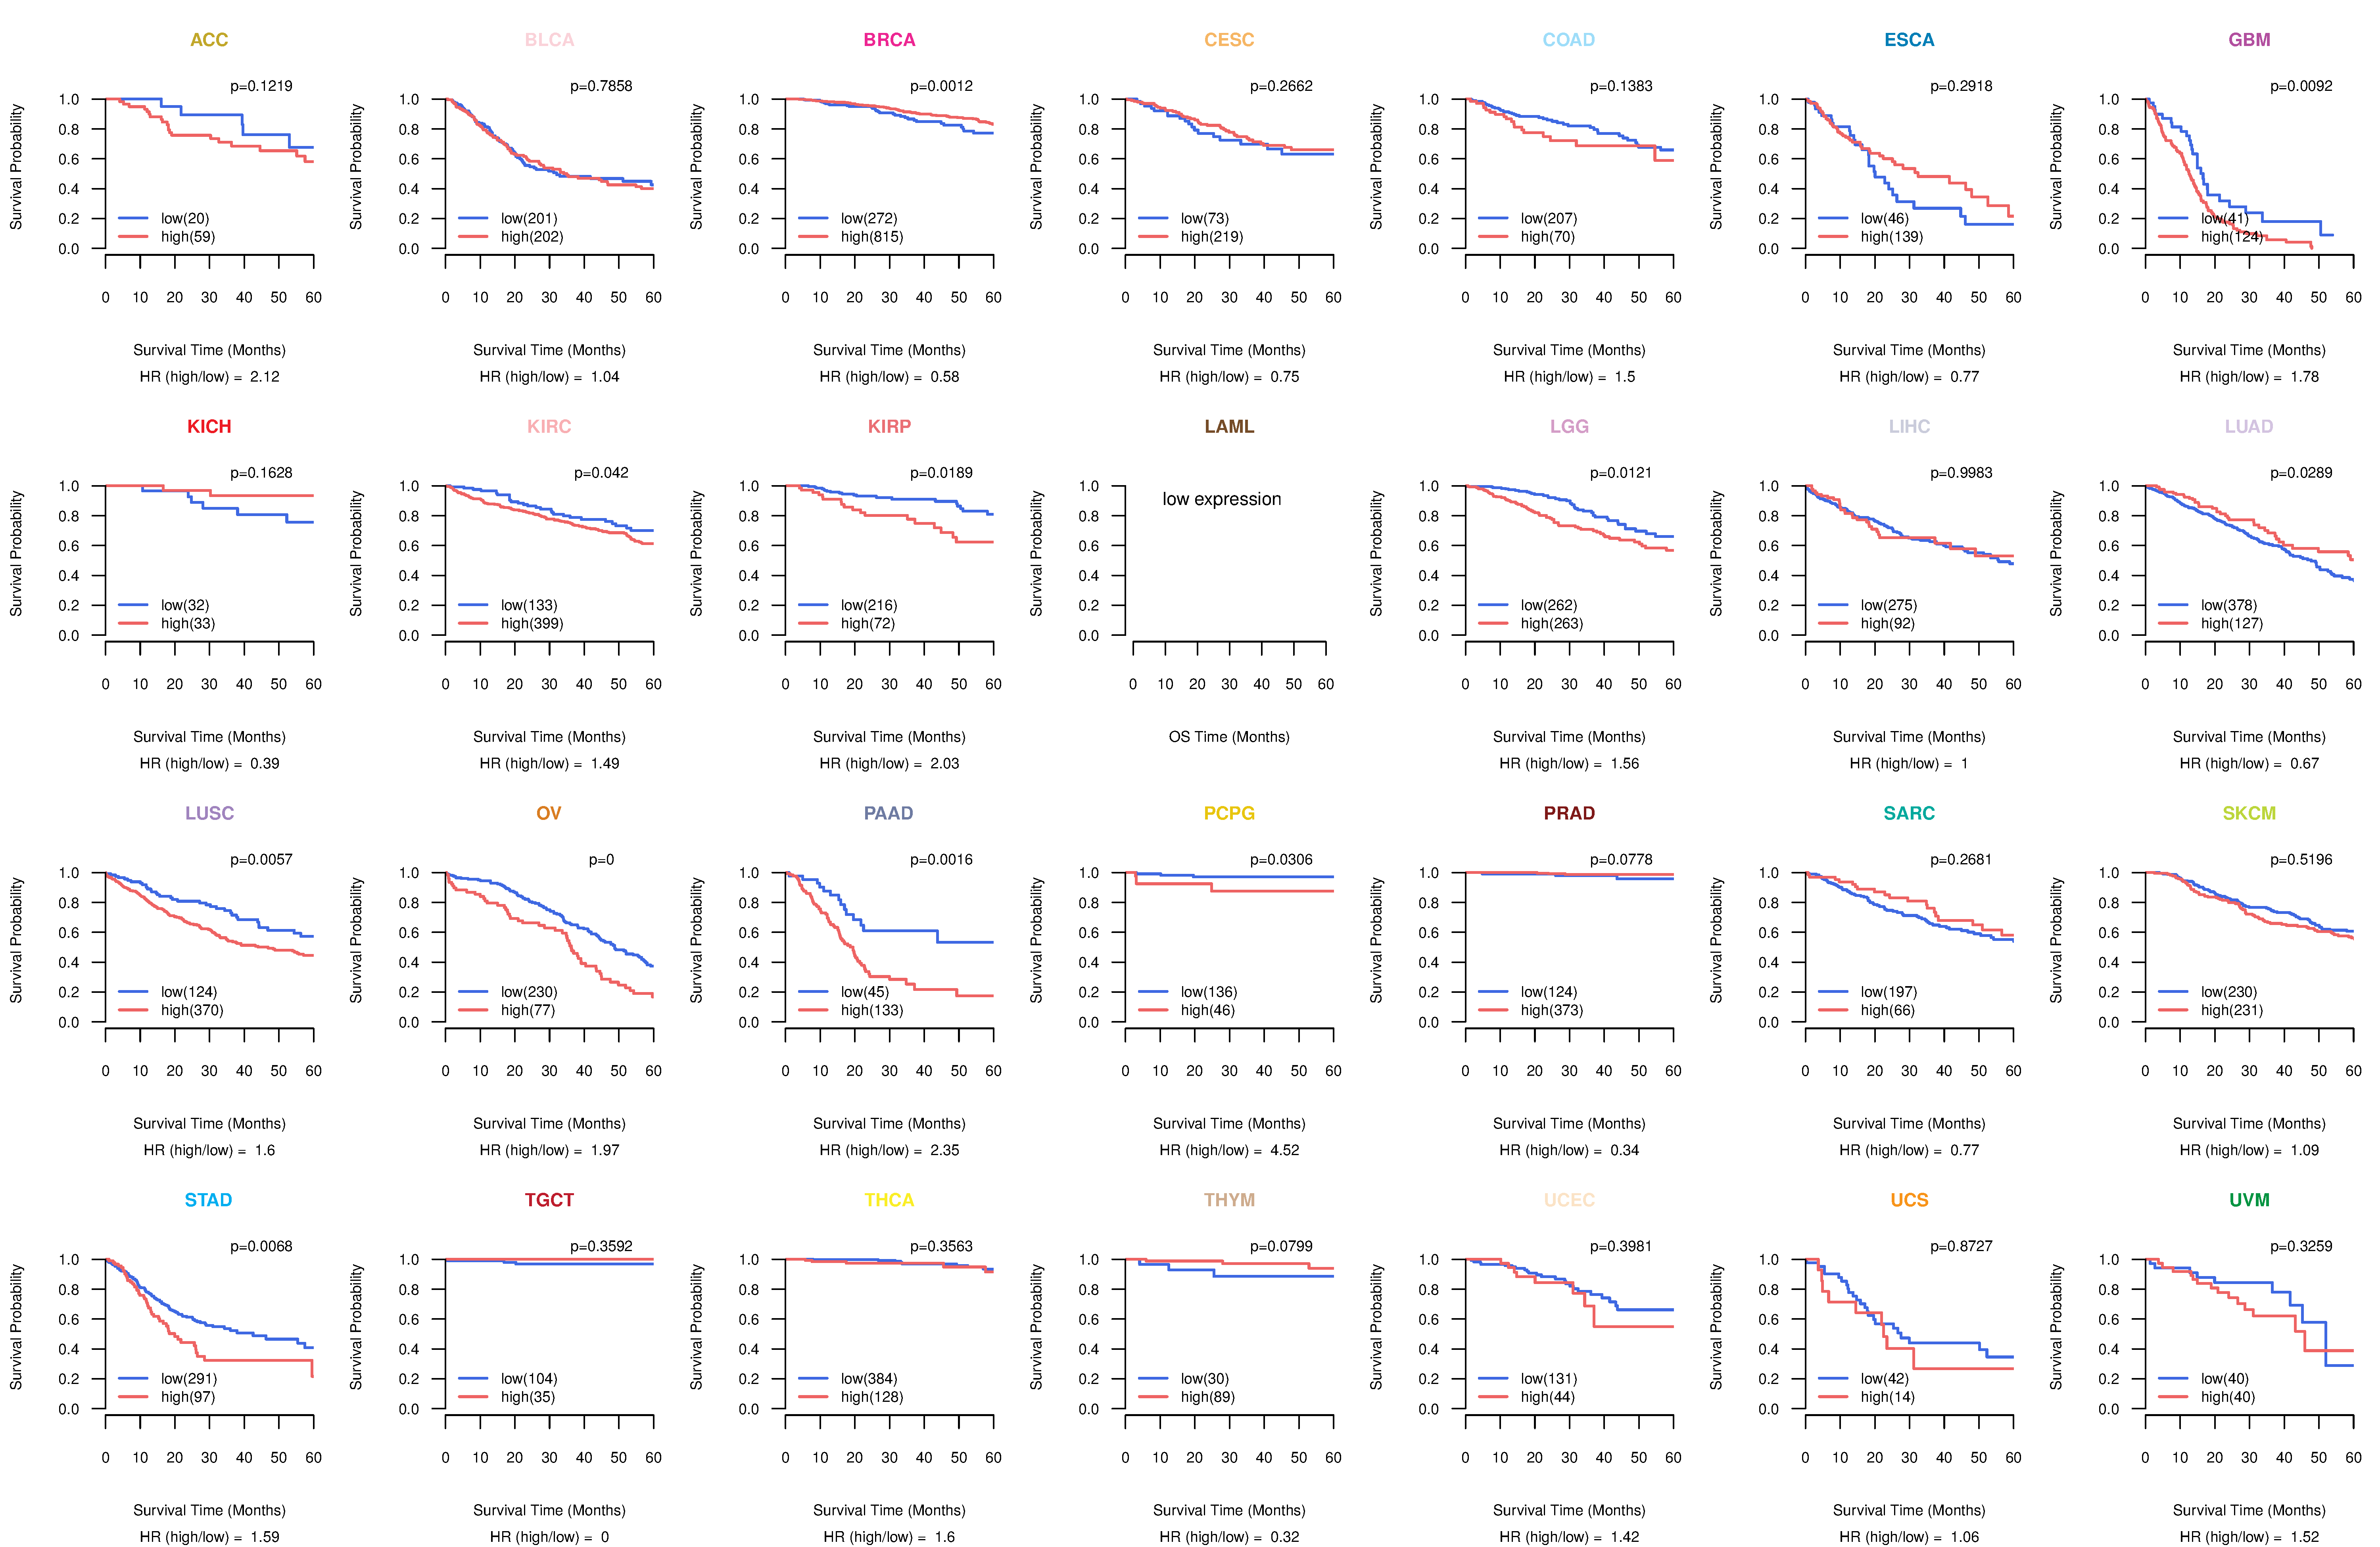
| TissGeneProg for STAC2 |
| Kaplan-Meier plots with logrank tests of overall survival (OS) using 28 cancer types (TCGA IlluminaHiSeq_RNASeqV2, pan-cancer normalized log2(norm_counts+1) data, version 2016-08-16) (TCGA clinicalMatrix, phenotype data, version 2016-04-27) * Click on the image to enlarge it in a new window. |
 |
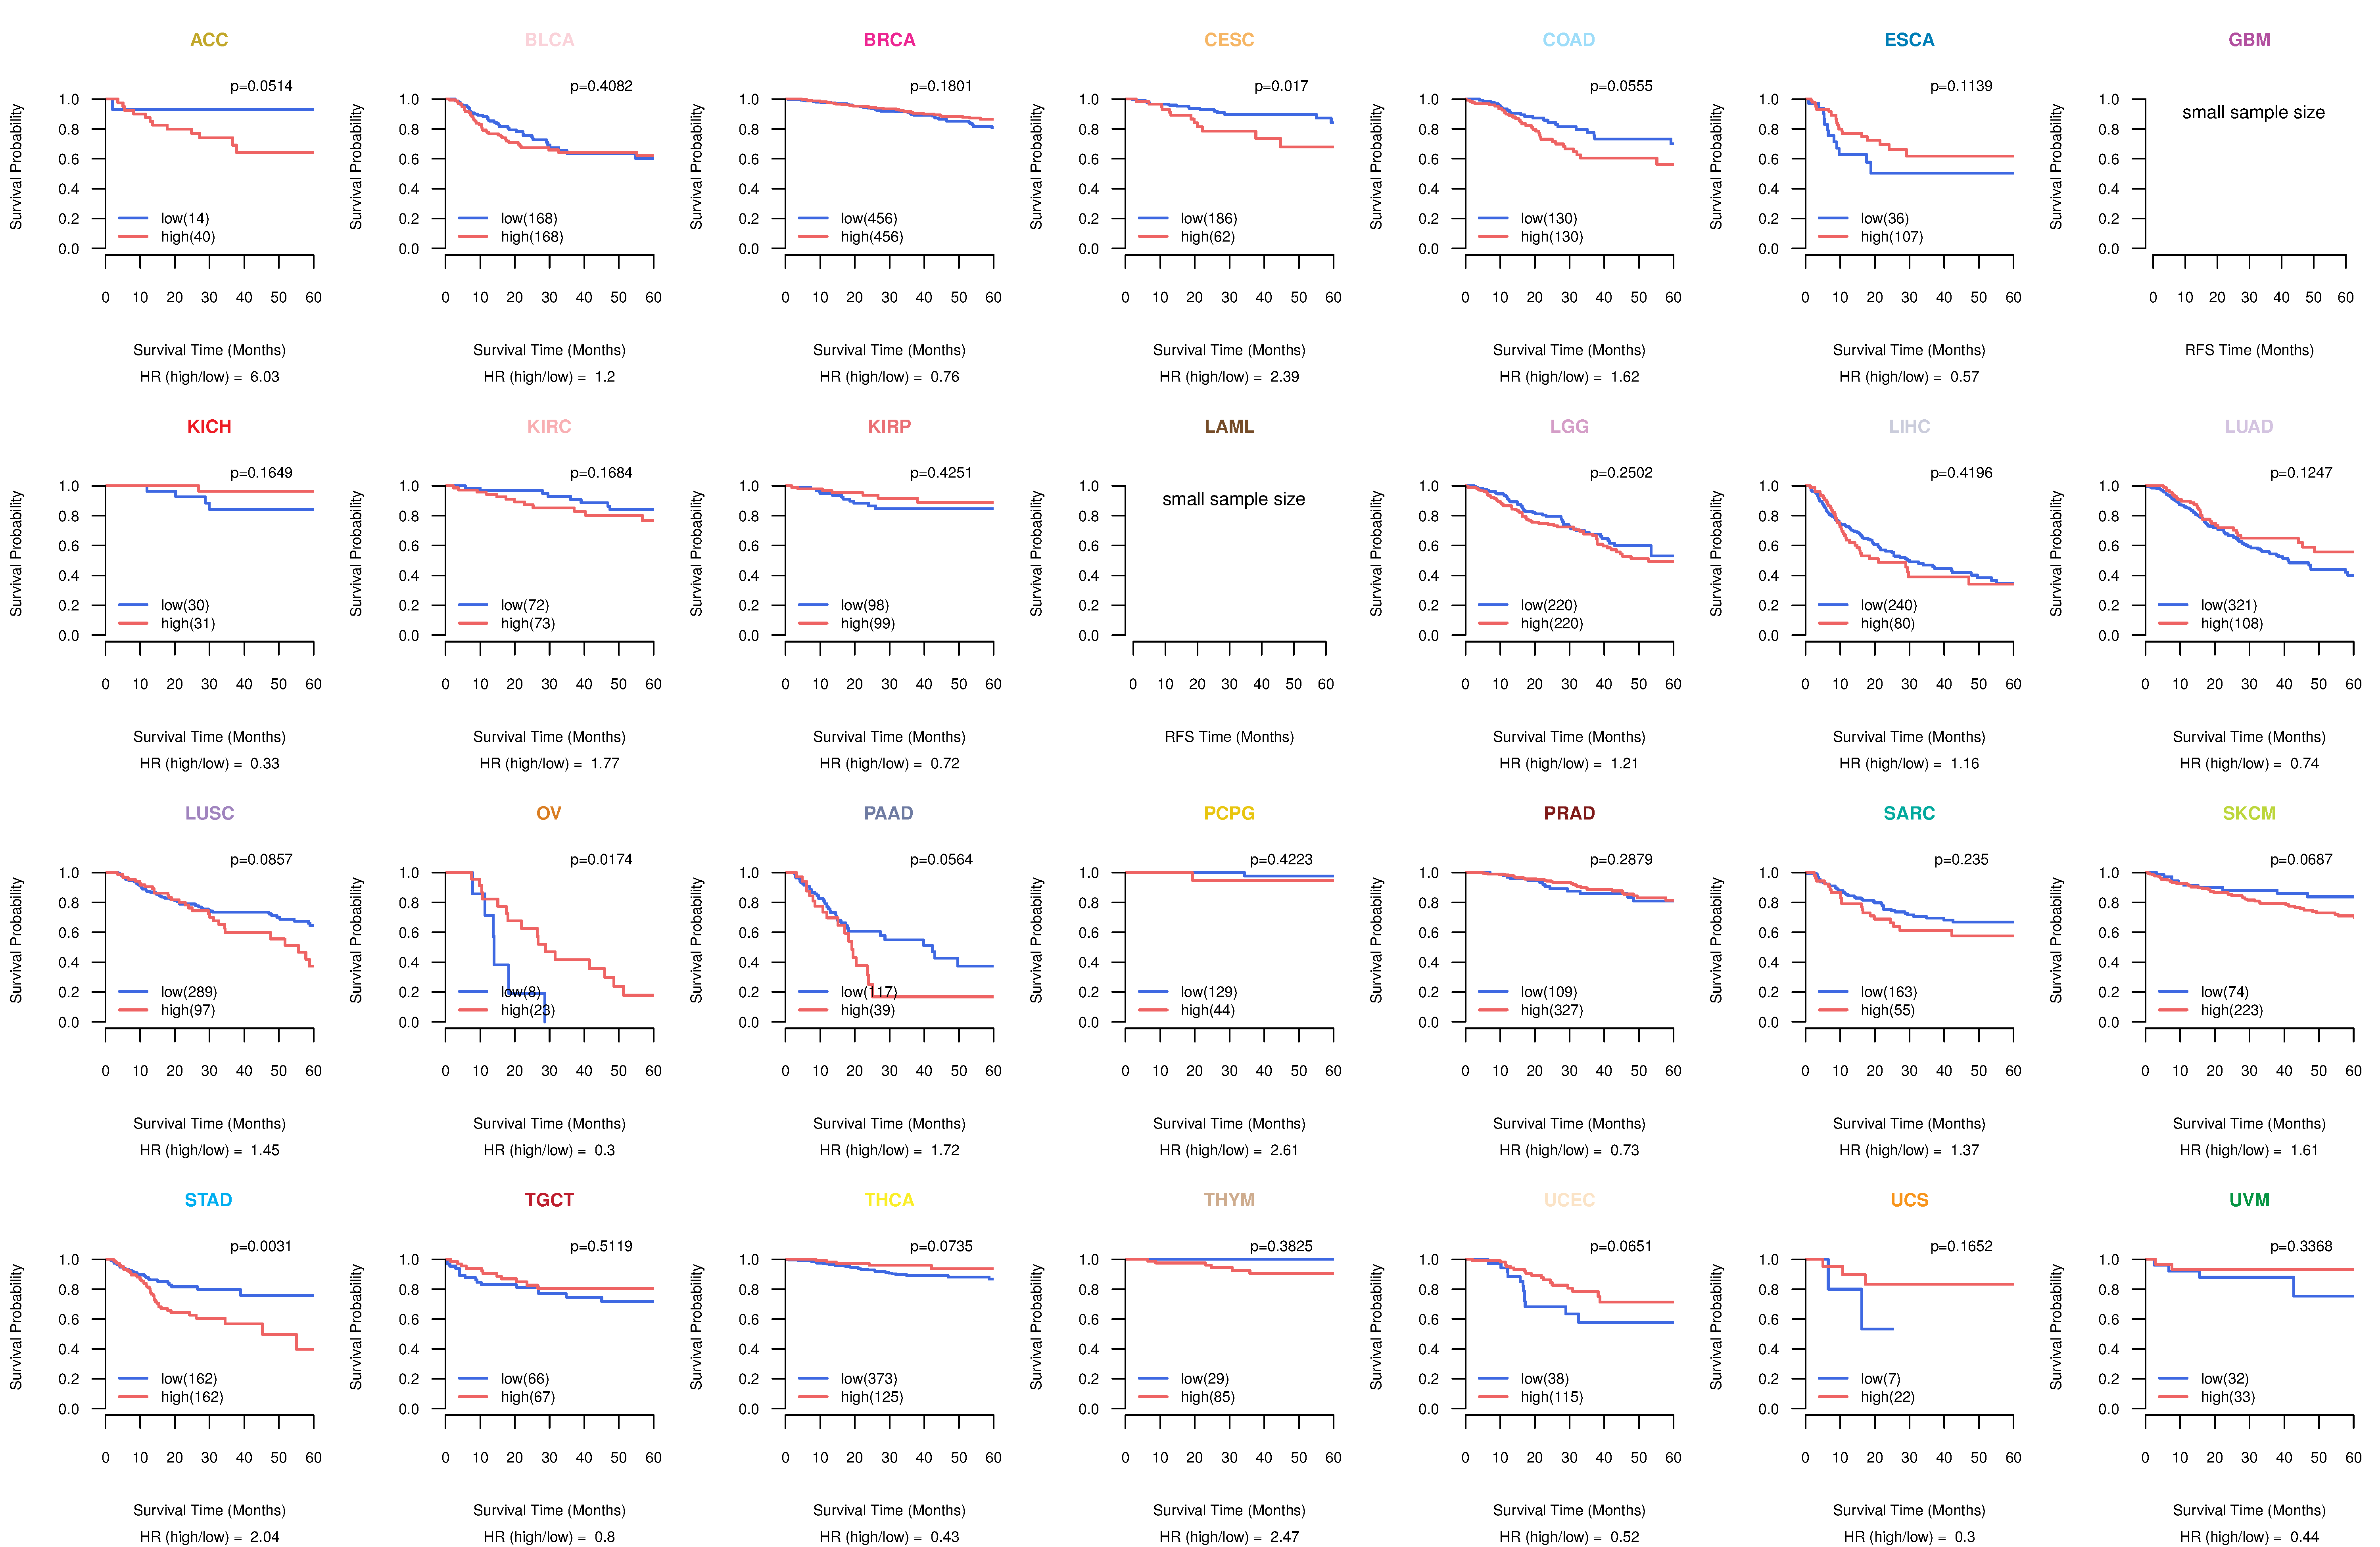
| Kaplan-Meier plots with logrank test of relapse free survival (RFS) using 28 cancer types (TCGA IlluminaHiSeq_RNASeqV2, pan-cancer normalized log2(norm_counts+1) data, version 2016-08-16) (TCGA clinicalMatrix, phenotype data, version 2016-04-27) * Click on the image enlarge it in a new window. |
 |
| Forest plot of Cox proportional hazard ratio (HR) and 95% CI of overall survival (OS) using 28 cancer types (TCGA IlluminaHiSeq_RNASeqV2, pan-cancer normalized log2(norm_counts+1) data, version 2016-08-16) (TCGA clinicalMatrix, phenotype data, version 2016-04-27) * Click on the image enlarge it in a new window. |
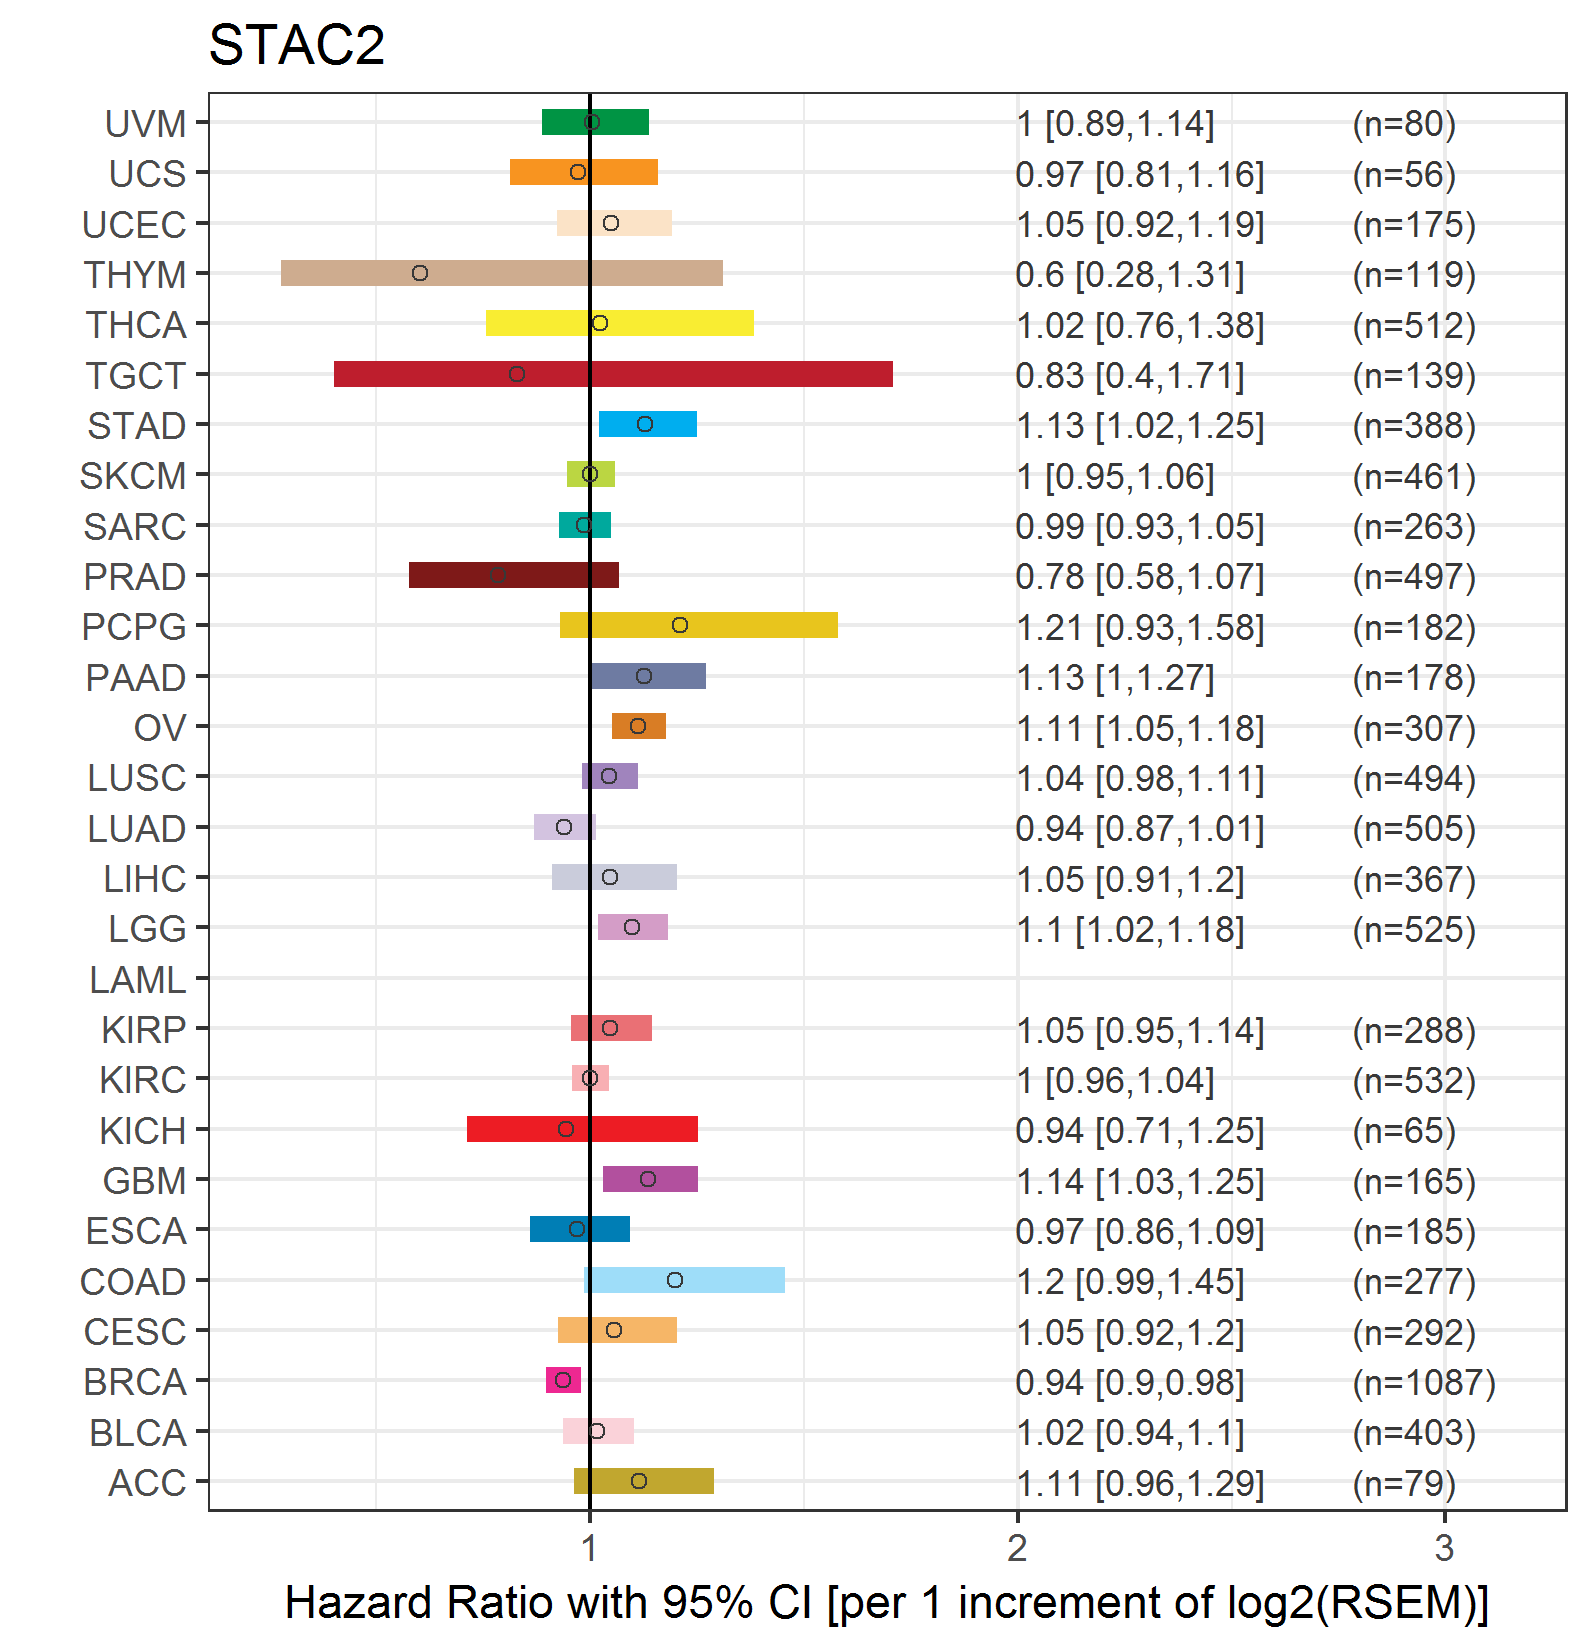 |
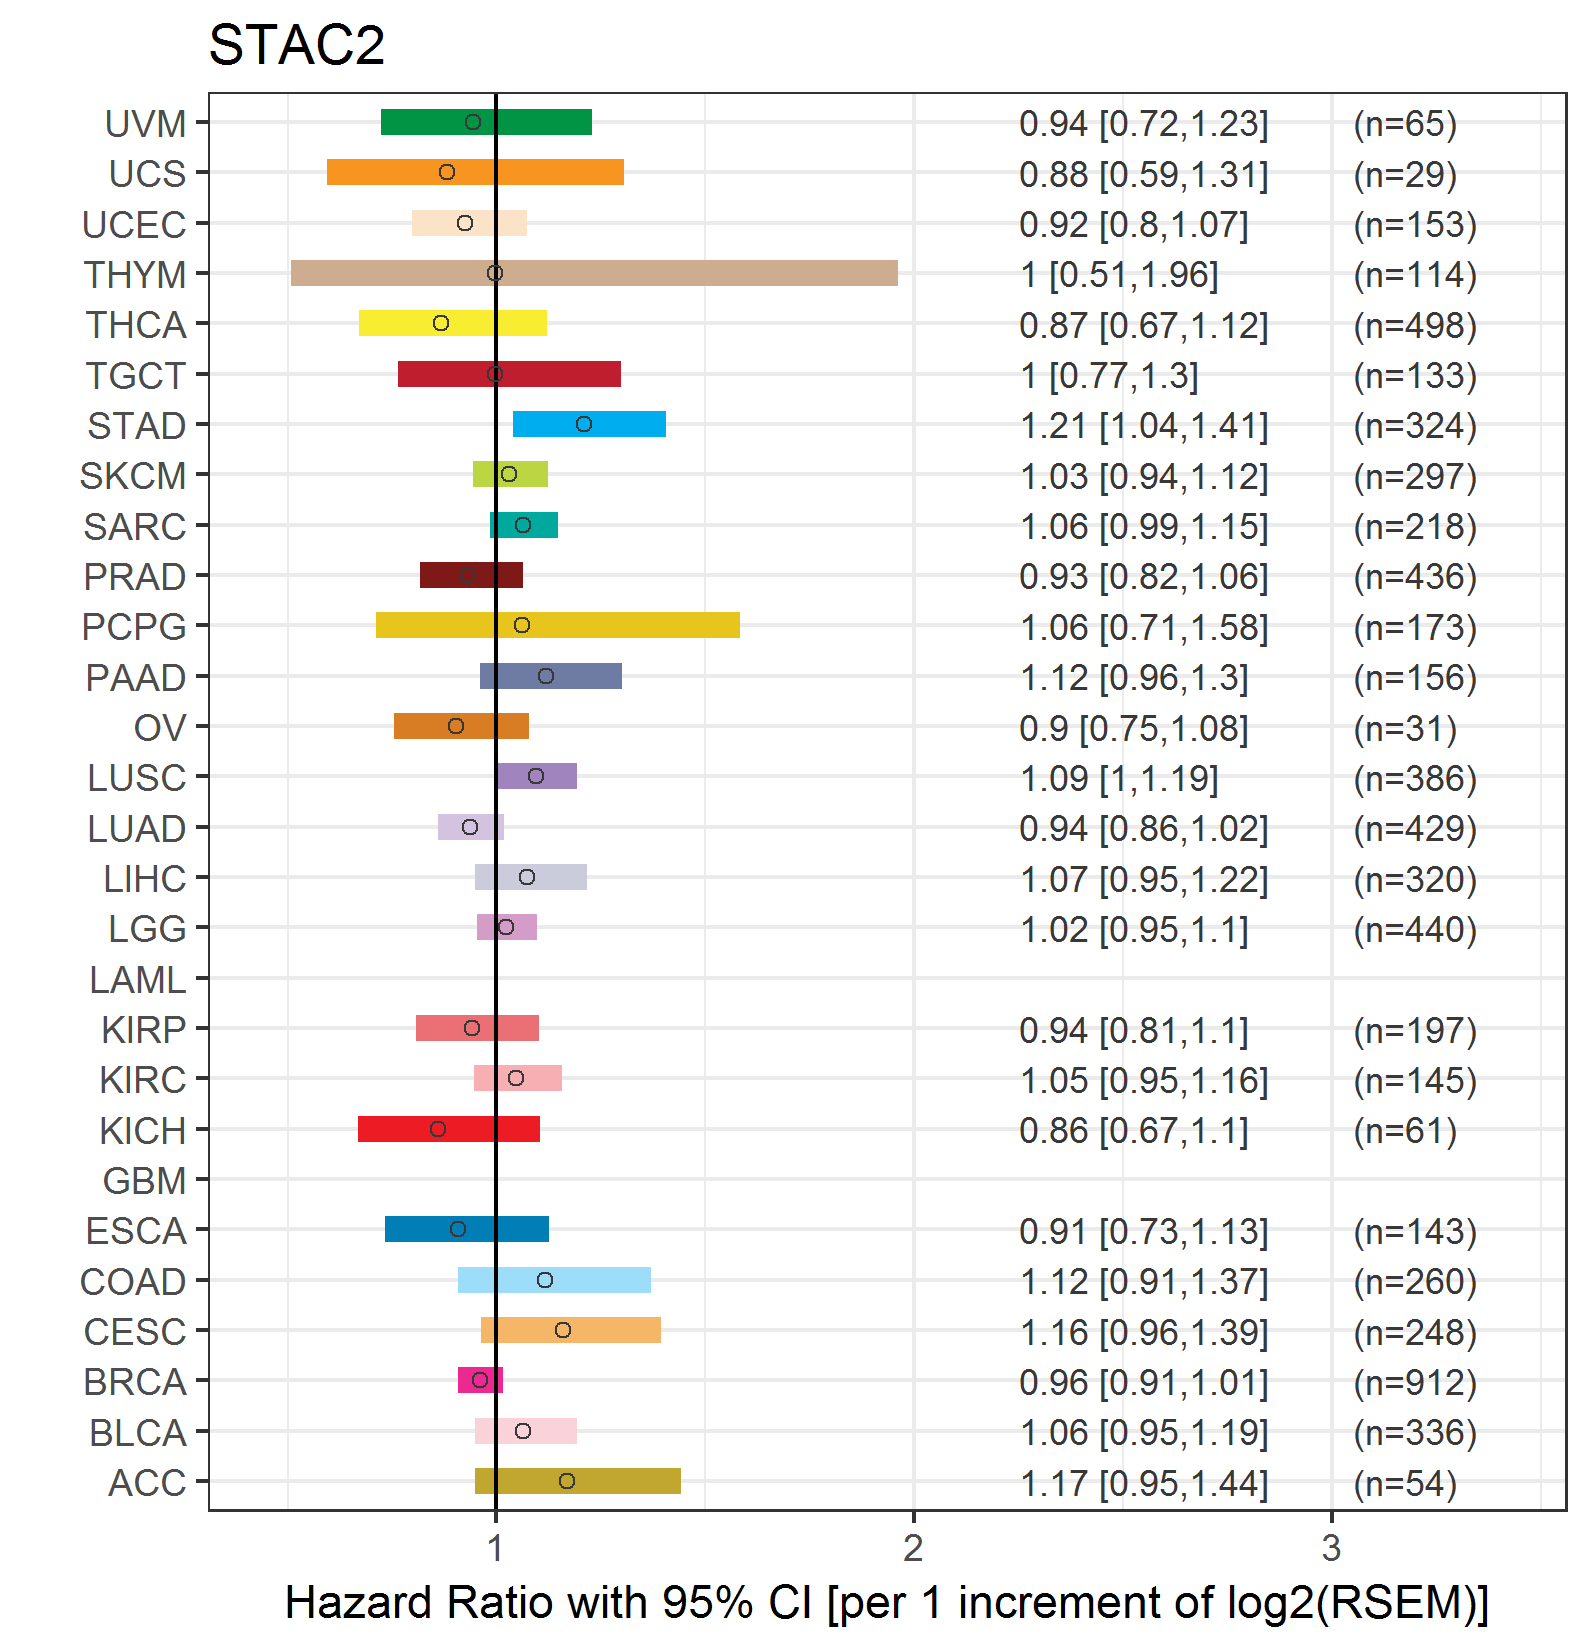
| Forest plot of Cox proportional hazard ratio (HR) and 95% CI of relapse free survival (RFS) using 28 cancer types (TCGA IlluminaHiSeq_RNASeqV2, pan-cancer normalized log2(norm_counts+1) data, version 2016-08-16) (TCGA clinicalMatrix, phenotype data, version 2016-04-27) * Click on the image enlarge it in a new window. |
 |
| Top |
| TissGeneClin for STAC2 |
| TissGeneDrug for STAC2 |
| Drug information targeting TissGene (DrugBank Version 5.0.6, 2017-04-01) |
| DrugBank ID | Drug name | Drug activity | Drug type | Drug status |
| Top |
| TissGeneDisease for STAC2 |
| Disease information associated with TissGene (DisGeNet, 2016-06-01) |
| Disease ID | Disease name | # pubmeds | Source |
| umls:C0036346 | Schizophrenia, Childhood | 0 | CLINVAR |
|
Copyright 2016-Present - The University of Texas Health Science Center at Houston (UTHealth) Web File Viewing | How to Report, Fraud, Waste and Abuse | State of Texas | Statewide Search | Texas Homeland Security | Site Policies |