 |
| |
| |
| |
| |
| |
| |
|

| TissGeneSummary for APOC2 |
 Gene summary Gene summary |
| Basic gene information | Gene symbol | APOC2 |
| Gene name | apolipoprotein C-II | |
| Synonyms | APO-CII|APOC-II | |
| Cytomap | UCSC genome browser: 19q13.2 | |
| Type of gene | protein-coding | |
| RefGenes | NM_000483.4, | |
| Description | apolipoprotein C2 | |
| Modification date | 20141207 | |
| dbXrefs | MIM : 608083 | |
| HGNC : HGNC | ||
| Ensembl : ENSG00000224916 | ||
| HPRD : 07457 | ||
| Protein | UniProt: go to UniProt's Cross Reference DB Table | |
| Expression | CleanEX: HS_APOC2 | |
| BioGPS: 344 | ||
| Pathway | NCI Pathway Interaction Database: APOC2 | |
| KEGG: APOC2 | ||
| REACTOME: APOC2 | ||
| Pathway Commons: APOC2 | ||
| Context | iHOP: APOC2 | |
| ligand binding site mutation search in PubMed: APOC2 | ||
| UCL Cancer Institute: APOC2 | ||
| Assigned class in TissGDB* | B | |
| Included tissue-specific gene expression resources | HPA,TiGER,GTEx | |
| Specific-tissues in normal samples (assigned by TissGDB using HPA, TiGER, and GTEx) | Liver | |
| Cancer types related to the specific-tissues in cancer samples (assigned by TissGDB using TCGA) | LIHC | |
| Reference showing the relevant tissue of APOC2 | ||
| Description by TissGene annotations | ||
| * Class A consists of genes with literature evidence and is part of the cTissGenes. Class B consists of only cTissGenes without additional evidence. The remaining genes belong to Class C. |
| Gene ontology having evidence of Inferred from Direct Assay (IDA) from Entrez |
| GO ID | GO term | PubMed ID | GO:0010518 | positive regulation of phospholipase activity | 10727238 | GO:0010898 | positive regulation of triglyceride catabolic process | 10727238 | GO:0010916 | negative regulation of very-low-density lipoprotein particle clearance | 1917954 | GO:0033344 | cholesterol efflux | 11162594 | GO:0033700 | phospholipid efflux | 11162594 | GO:0034382 | chylomicron remnant clearance | 4020294 | GO:0043086 | negative regulation of catalytic activity | 182536 | GO:0045723 | positive regulation of fatty acid biosynthetic process | 10727238 | GO:0045833 | negative regulation of lipid metabolic process | 182536 | GO:0048261 | negative regulation of receptor-mediated endocytosis | 1917954 | GO:0051006 | positive regulation of lipoprotein lipase activity | 10727238 | GO:0060697 | positive regulation of phospholipid catabolic process | 10727238 | GO:0010518 | positive regulation of phospholipase activity | 10727238 | GO:0010898 | positive regulation of triglyceride catabolic process | 10727238 | GO:0010916 | negative regulation of very-low-density lipoprotein particle clearance | 1917954 | GO:0033344 | cholesterol efflux | 11162594 | GO:0033700 | phospholipid efflux | 11162594 | GO:0034382 | chylomicron remnant clearance | 4020294 | GO:0043086 | negative regulation of catalytic activity | 182536 | GO:0045723 | positive regulation of fatty acid biosynthetic process | 10727238 | GO:0045833 | negative regulation of lipid metabolic process | 182536 | GO:0048261 | negative regulation of receptor-mediated endocytosis | 1917954 | GO:0051006 | positive regulation of lipoprotein lipase activity | 10727238 | GO:0060697 | positive regulation of phospholipid catabolic process | 10727238 |
| Top |
| TissGeneExp for APOC2 |
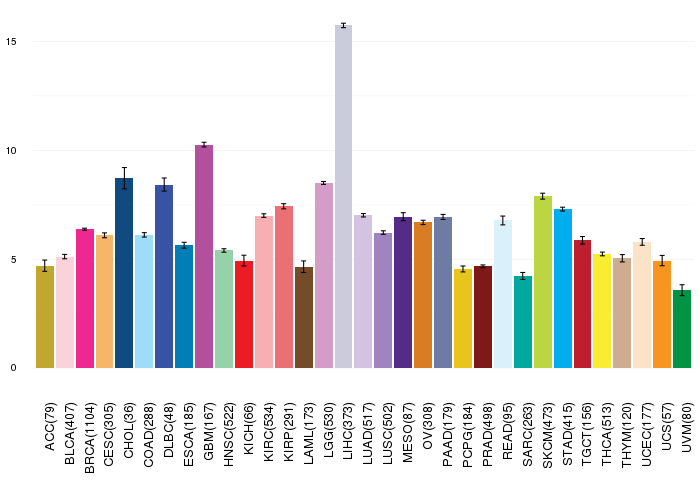
| Gene expressions across 28 cancer types (X-axis: cancer type and Y-axis: log2(norm_counts+1)) (TCGA IlluminaHiSeq_RNASeqV2, pan-cancer normalized log2(norm_counts+1) data, version 2016-08-16) |
 |
| Gene isoform expressions across 28 cancer types (X-axis: cancer type and Y-axis: log2(norm_counts+1)) (TCGA pan-cancer tcga_rsem_isoform_tpm, version 2016-09-01) |
 |
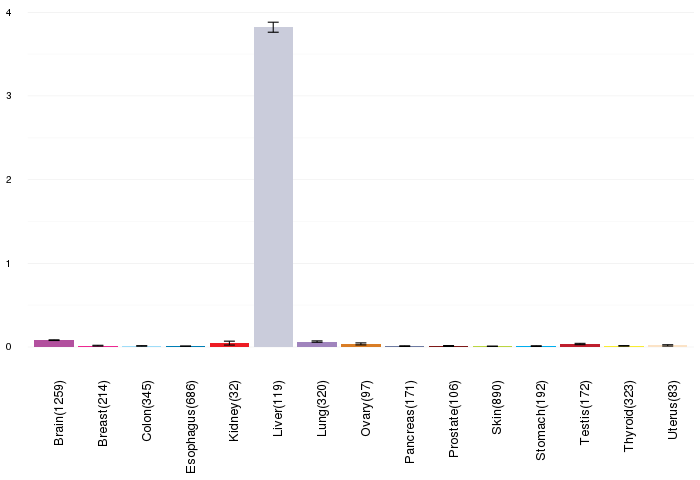
| Gene expressions across normal tissues of GTEx data (GTEx GTEx_Analysis_v6_RNA-seq_RNA-SeQCv1.1.8_gene_rpkm.gct) - Here, we shows the matched tissue types only among our 28 cancer types. |
 |
| Different expressions across 14 cancer types with more than 10 samples between matched tumors and normals (X-axis: cancer type and Y-axis: log2(norm_counts+1)) (TCGA IlluminaHiSeq_RNASeqV2, pan-cancer normalized log2(norm_counts+1) data, version 2016-08-16) |
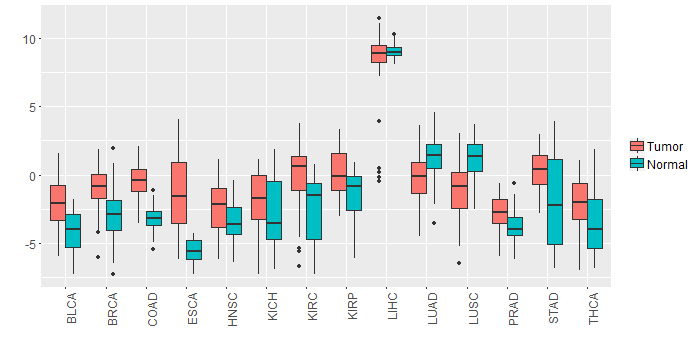 |
| - Significantly differentially expressed cancer types and information. (|Fold change|>1 and FDR<0.05) |
| Cancer type | Mean(exp) in tumor | Mean(exp) in matched normal | Log2FC | P-val. | FDR |
| LUSC | -1.063549236 | 1.184123313 | -2.247672549 | 2.27E-09 | 7.51E-09 |
| COAD | -0.461545314 | -3.130576083 | 2.669030769 | 6.03E-10 | 6.95E-09 |
| BRCA | -0.882084788 | -2.913702332 | 2.031617544 | 1.12E-17 | 6.75E-17 |
| LUAD | -0.359241866 | 1.3273771 | -1.686618966 | 1.54E-07 | 5.86E-07 |
| THCA | -2.025270738 | -3.727457178 | 1.702186441 | 1.22E-05 | 3.90E-05 |
| KIRC | 0.01484913 | -2.56398837 | 2.5788375 | 9.60E-10 | 3.15E-09 |
| ESCA | -1.289618041 | -5.600427132 | 4.310809091 | 0.00157 | 0.019727006 |
| BLCA | -1.954961104 | -4.152776893 | 2.197815789 | 0.000665 | 0.005030476 |
| HNSC | -2.24011043 | -3.36141043 | 1.1213 | 0.0014 | 0.004532374 |
| STAD | 0.286104686 | -2.005089064 | 2.29119375 | 0.00071 | 0.004042506 |
| KIRP | 0.165498436 | -1.679748439 | 1.845246875 | 0.000394 | 0.001180947 |
| Top |
| TissGene-miRNA for APOC2 |
| Significantly anti-correlated miRNAs of TissGene across 28 cancer types (Gene-miRNA relations from TargetScanHuman Relsease 7.1, Conserved_Site_Context_Scores.txt.zip, 06.01.2016) (TCGA IlluminaHiSeq_miRNASeq, log2(RPM+1) data, version 2016-11-21) (TCGA IlluminaHiSeq_RNASeqV2, log2(normalized_count+1) data, version 2016-08-16) (Spearman’s Rank Correlation (p-value<0.05 and coefficient<-0.25)) |
| Cancer type | miRNA id | miRNA accession | P-val. | Coeff. | # samples |
| Top |
| TissGeneMut for APOC2 |
| TissGeneSNV for APOC2 |
| nsSNV counts per each loci. Different colors of circles represent different cancer types. Circle size denotes number of samples. (TCGA somatic mutation (SNPs and small INDELs) data, version 2016-04-25) * Click on the image to enlarge it in a new window. |
 |
 |
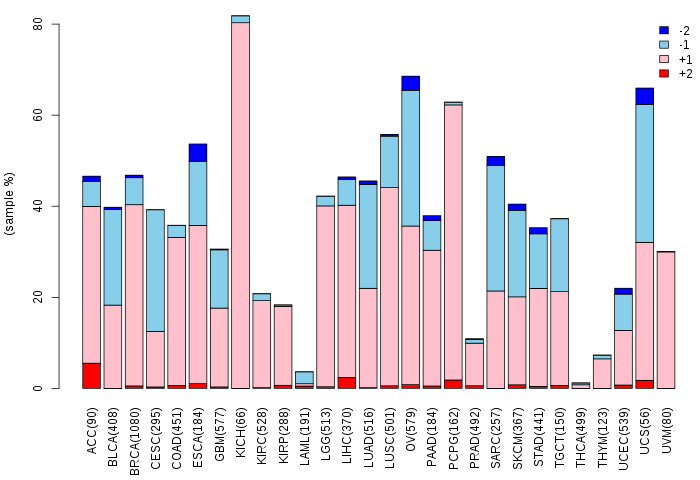
| Somatic nucleotide variants of TissGene across 28 cancer types (X-axis: cancer type and Y-axis: % of mutated samples) The numbers in parentheses are numbers of samples with mutation (nsSNVs). (TCGA somatic mutation (SNPs and small INDELs) data, version 2016-04-25) |
 |
| - nsSNVs sorted by frequency. |
| AAchange | Cancer type | # samples |
| p.P65L | READ | 1 |
| p.M82I | ESCA | 1 |
| p.P34A | LUAD | 1 |
| p.R4* | BLCA | 1 |
| p.K77Q | DLBC | 1 |
| p.P34S | SKCM | 1 |
| p.A81D | STAD | 1 |
| p.A55T | COAD | 1 |
| Top |
| TissGeneCNV for APOC2 |
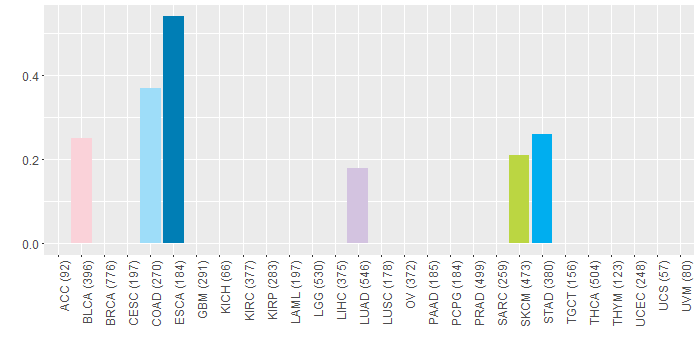
| Copy number variations of TissGene across 28 cancer types (X-axis: cancer type and Y-axis: % of CNV samples) (TCGA Gistic2_CopyNumber_Gistic2_all_data_by_genes, Gistic2 copy number data, version 2016-08-16) |
 |
| Top |
| TissGeneFusions for APOC2 |
| Fusion genes including TissGene (ChimerDB 3.0, 2016-12-01 and TCGA fusion Portal 2015-12-01) |
| Database | Src | Cancer type | Sample | Fusion gene | ORF | 5'-gene BP | 3'-gene BP |
| Top |
| TissGeneNet for APOC2 |
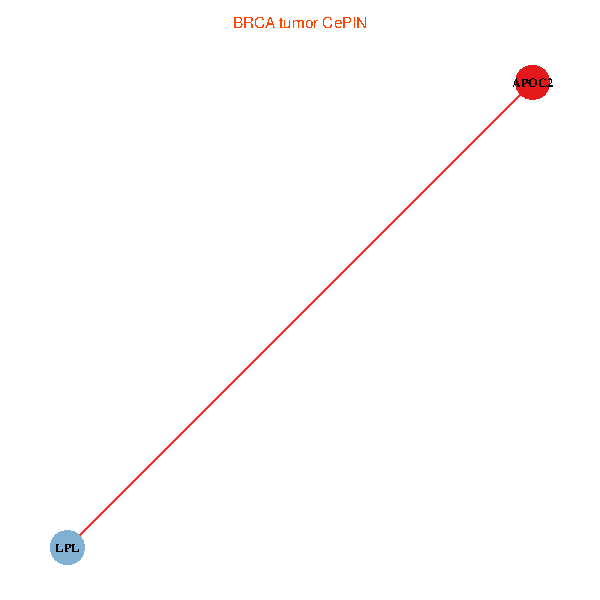
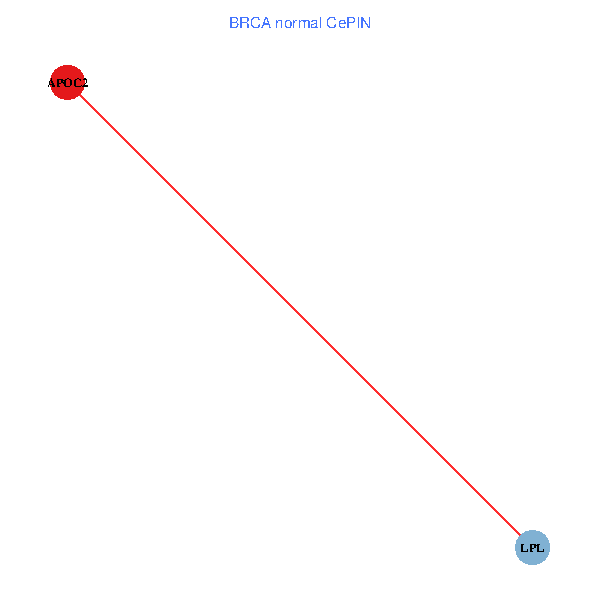
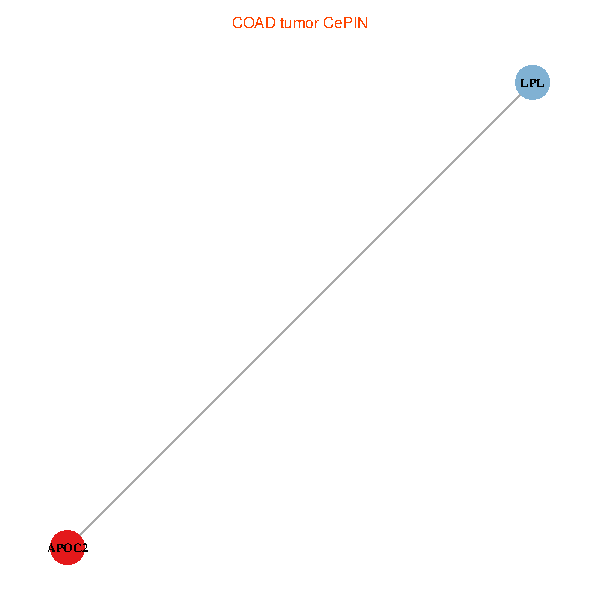
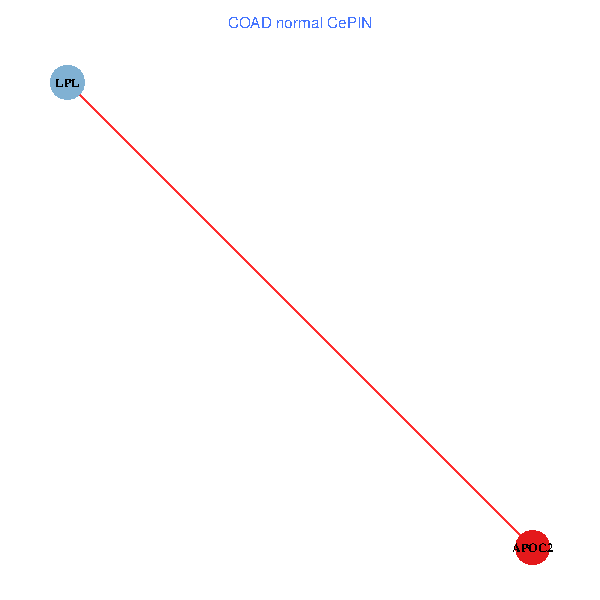
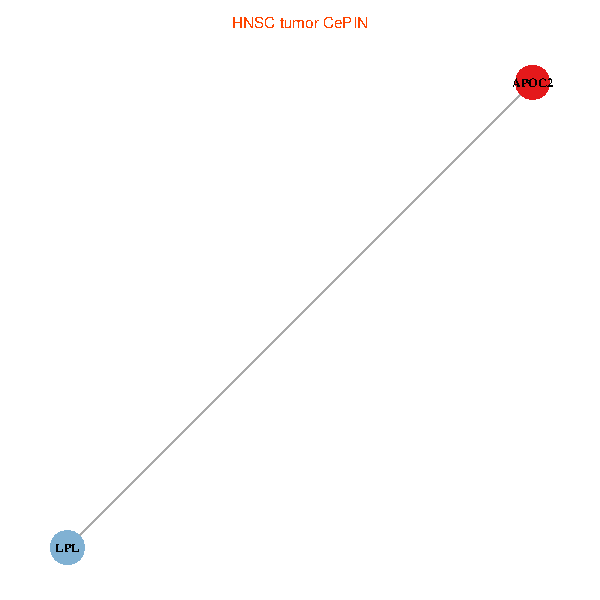
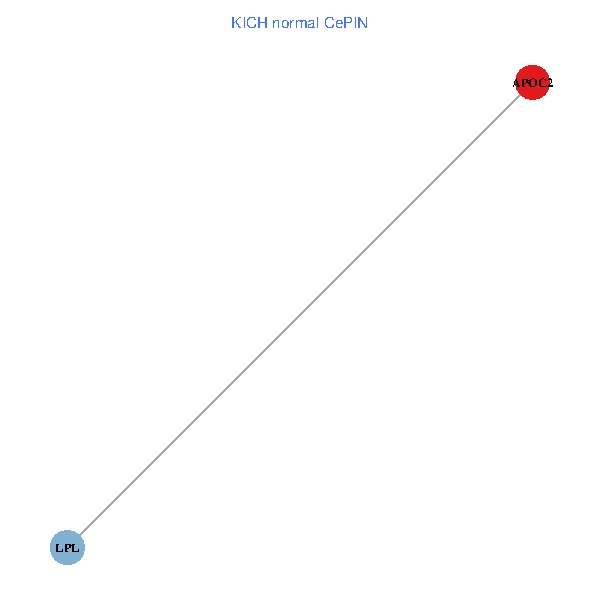
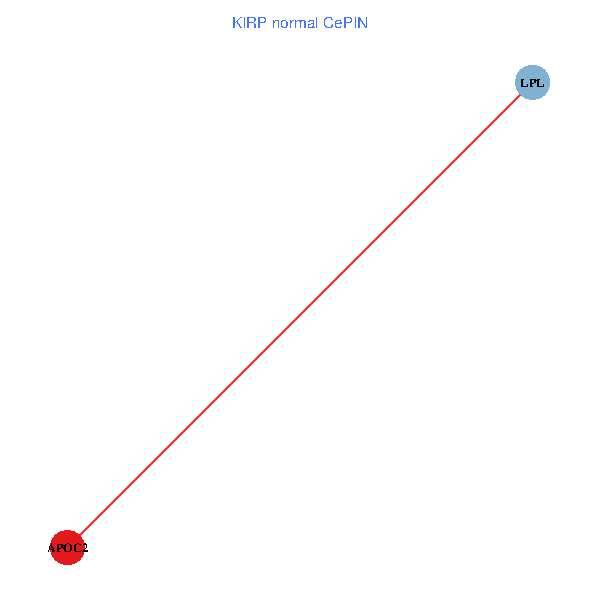
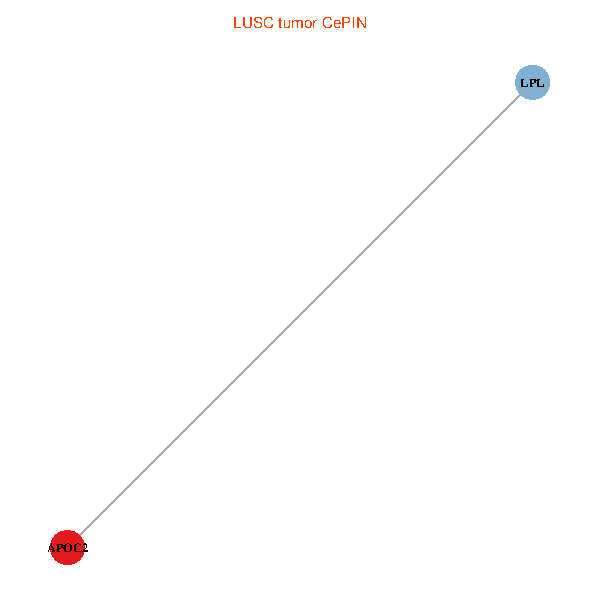
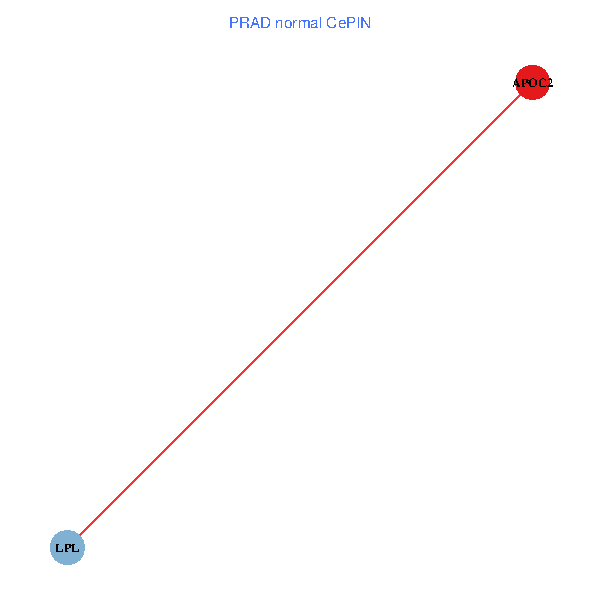
| Co-expressed gene networks based on protein-protein interaction data (CePIN) (TCGA IlluminaHiSeq_RNASeqV2, pan-cancer normalized log2(norm_counts+1) data, version 2016-08-16) (PINA2 ppi data) |
| BRCA (tumor) | BRCA (normal) |
| APOC2, LPL (tumor) | APOC2, LPL (normal) |
 |  |
| COAD (tumor) | COAD (normal) |
| APOC2, LPL (tumor) | APOC2, LPL (normal) |
 |  |
| HNSC (tumor) | HNSC (normal) |
| APOC2, LPL (tumor) | APOC2, LPL (normal) |
 |  |
| KICH (tumor) | KICH (normal) |
| APOC2, LPL (tumor) | APOC2, LPL (normal) |
 |  |
| KIRC (tumor) | KIRC (normal) |
| APOC2, LPL (tumor) | APOC2, LPL (normal) |
 |  |
| KIRP (tumor) | KIRP (normal) |
| APOC2, LPL (tumor) | APOC2, LPL (normal) |
 |  |
| LIHC (tumor) | LIHC (normal) |
| APOC2, LPL (tumor) | APOC2, LPL (normal) |
 |  |
| LUAD (tumor) | LUAD (normal) |
| APOC2, LPL (tumor) | APOC2, LPL (normal) |
 |  |
| LUSC (tumor) | LUSC (normal) |
| APOC2, LPL (tumor) | APOC2, LPL (normal) |
 |  |
| PRAD (tumor) | PRAD (normal) |
| APOC2, LPL (tumor) | APOC2, LPL (normal) |
 |  |
| STAD (tumor) | STAD (normal) |
| APOC2, LPL (tumor) | APOC2, LPL (normal) |
 |  |
| THCA (tumor) | THCA (normal) |
| APOC2, LPL (tumor) | APOC2, LPL (normal) |
 |  |
| Top |
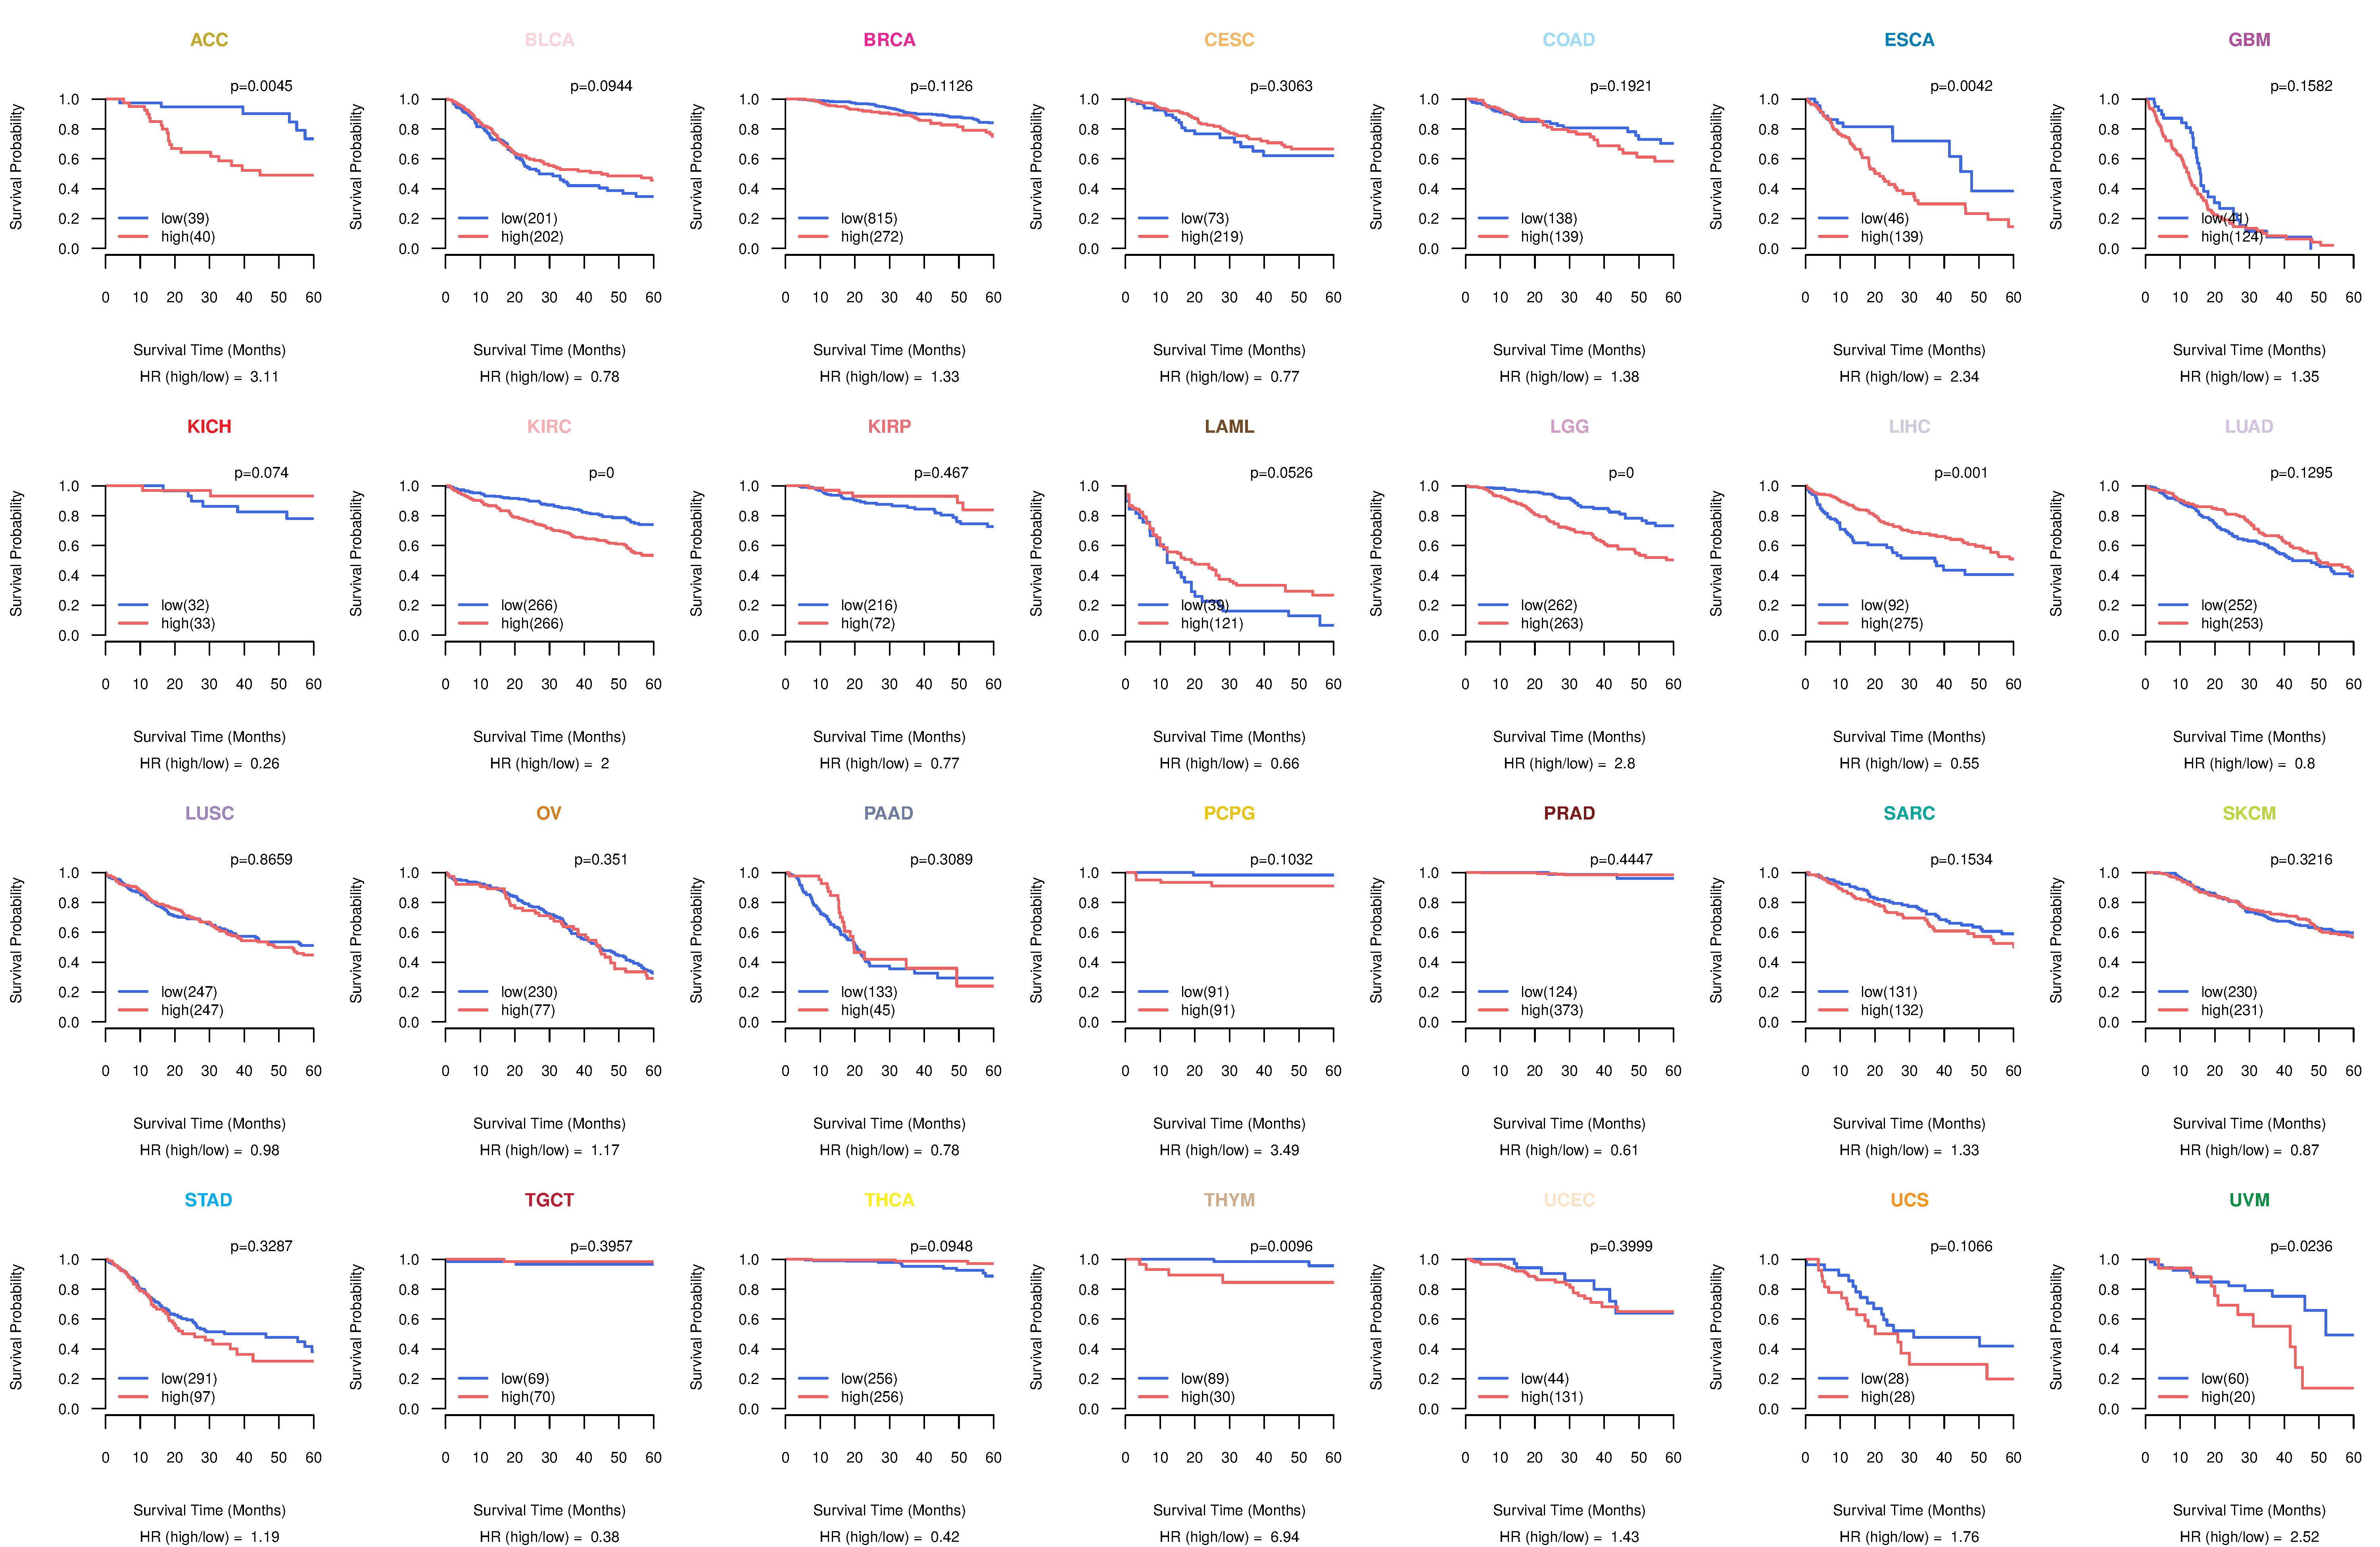
| TissGeneProg for APOC2 |
| Kaplan-Meier plots with logrank tests of overall survival (OS) using 28 cancer types (TCGA IlluminaHiSeq_RNASeqV2, pan-cancer normalized log2(norm_counts+1) data, version 2016-08-16) (TCGA clinicalMatrix, phenotype data, version 2016-04-27) * Click on the image to enlarge it in a new window. |
 |
| Kaplan-Meier plots with logrank test of relapse free survival (RFS) using 28 cancer types (TCGA IlluminaHiSeq_RNASeqV2, pan-cancer normalized log2(norm_counts+1) data, version 2016-08-16) (TCGA clinicalMatrix, phenotype data, version 2016-04-27) * Click on the image enlarge it in a new window. |
 |
| Forest plot of Cox proportional hazard ratio (HR) and 95% CI of overall survival (OS) using 28 cancer types (TCGA IlluminaHiSeq_RNASeqV2, pan-cancer normalized log2(norm_counts+1) data, version 2016-08-16) (TCGA clinicalMatrix, phenotype data, version 2016-04-27) * Click on the image enlarge it in a new window. |
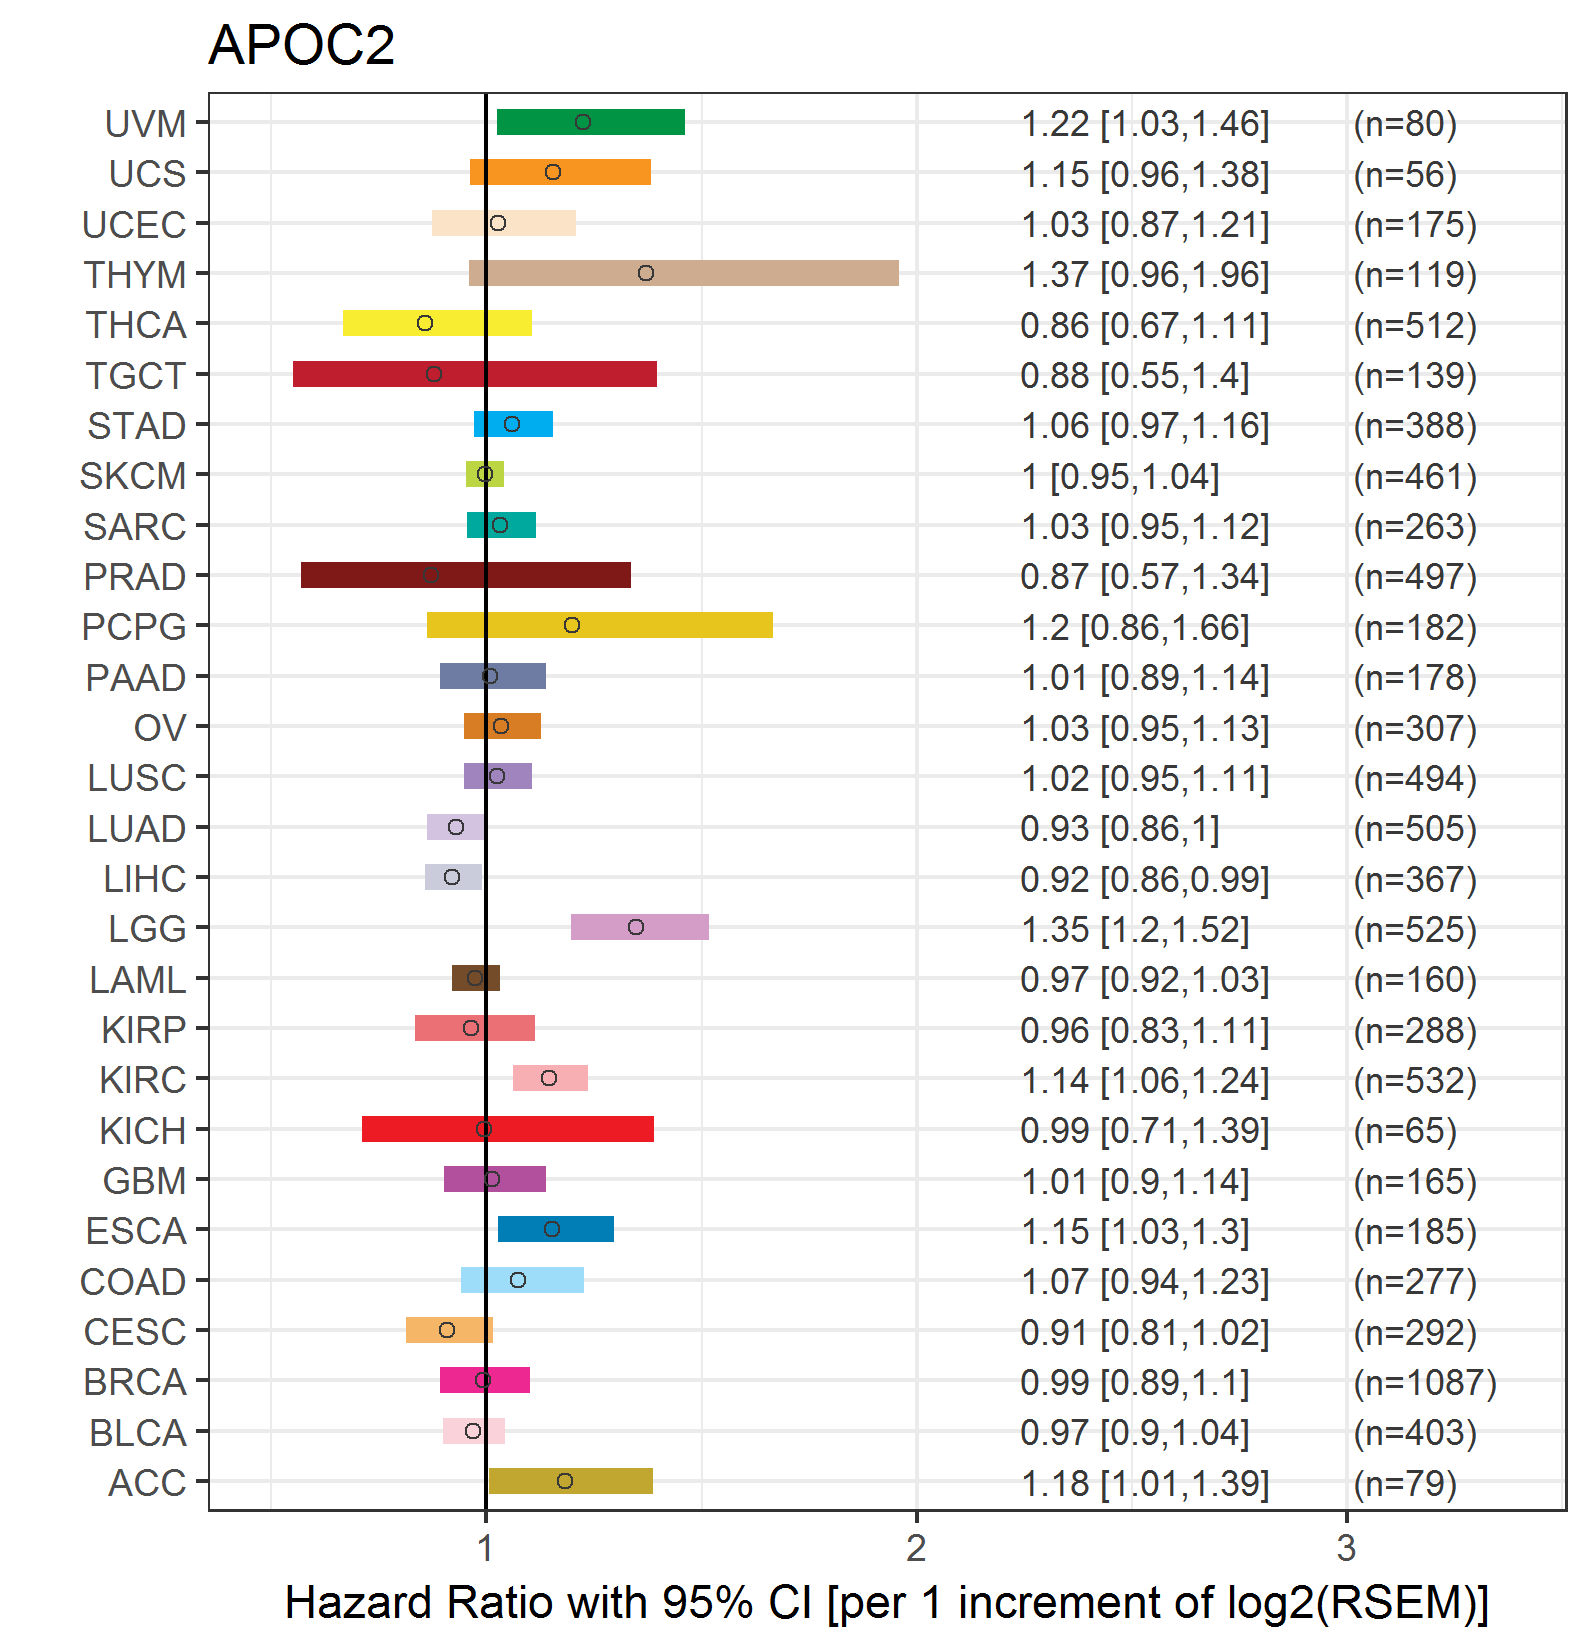 |
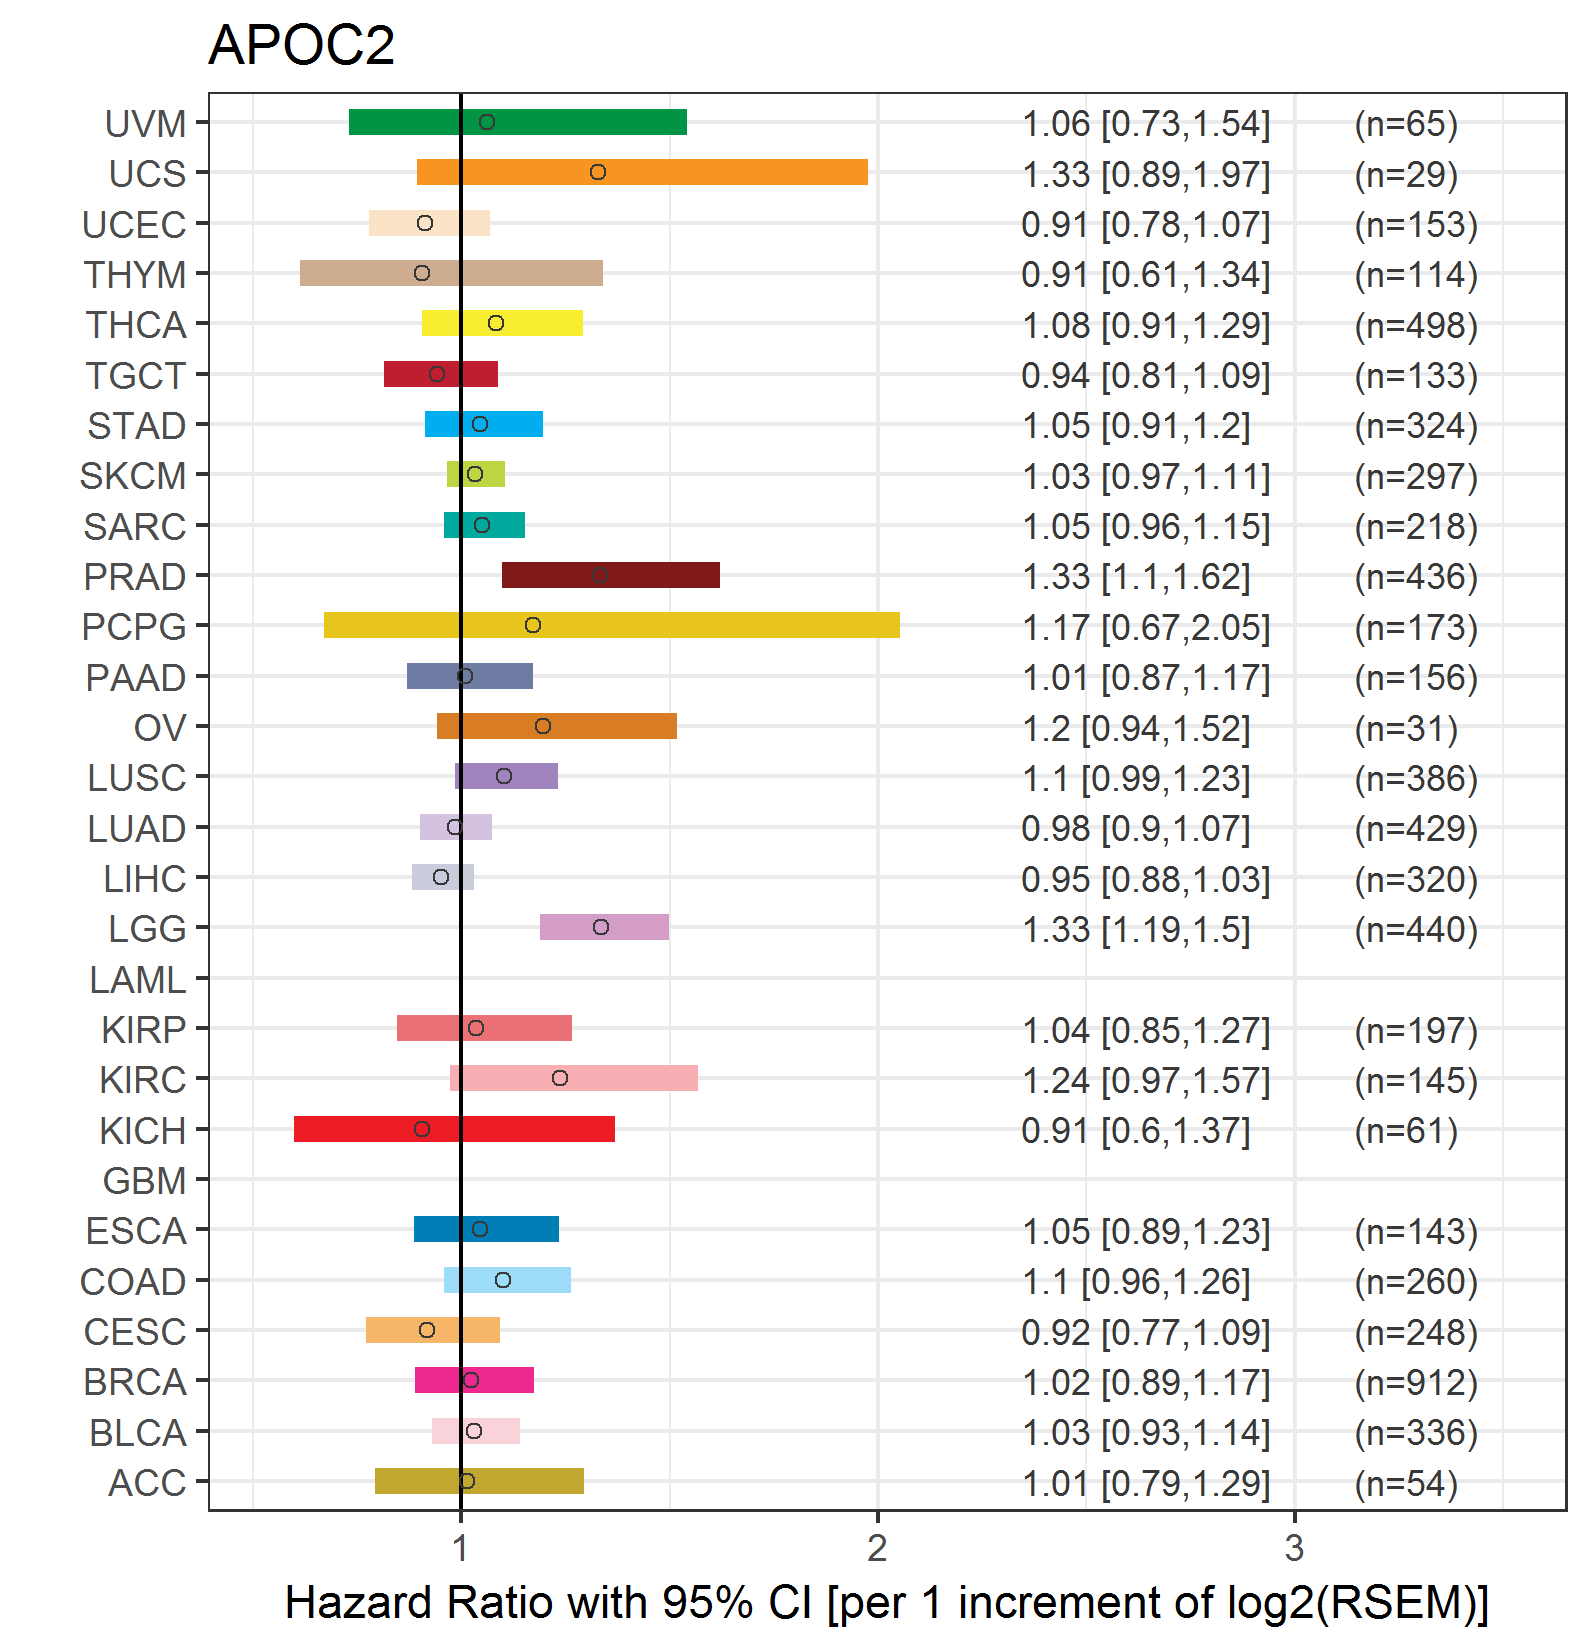
| Forest plot of Cox proportional hazard ratio (HR) and 95% CI of relapse free survival (RFS) using 28 cancer types (TCGA IlluminaHiSeq_RNASeqV2, pan-cancer normalized log2(norm_counts+1) data, version 2016-08-16) (TCGA clinicalMatrix, phenotype data, version 2016-04-27) * Click on the image enlarge it in a new window. |
 |
| Top |
| TissGeneClin for APOC2 |
| TissGeneDrug for APOC2 |
| Drug information targeting TissGene (DrugBank Version 5.0.6, 2017-04-01) |
| DrugBank ID | Drug name | Drug activity | Drug type | Drug status |
| Top |
| TissGeneDisease for APOC2 |
| Disease information associated with TissGene (DisGeNet, 2016-06-01) |
| Disease ID | Disease name | # pubmeds | Source |
| umls:C0027126 | Myotonic Dystrophy | 26 | BeFree |
| umls:C0410226 | Congenital Myotonic Dystrophy | 24 | BeFree |
| umls:C0023817 | Hyperlipoproteinemia Type I | 7 | BeFree,CTD_human |
| umls:C0032580 | Adenomatous Polyposis Coli | 5 | BeFree |
| umls:C1720779 | Apolipoprotein C-II Deficiency (disorder) | 5 | BeFree,CLINVAR,UNIPROT |
| umls:C0010068 | Coronary heart disease | 4 | BeFree,GAD |
| umls:C0011860 | Diabetes Mellitus, Non-Insulin-Dependent | 3 | BeFree,GAD |
| umls:C0020473 | Hyperlipidemia | 3 | BeFree,GAD |
| umls:C0020557 | Hypertriglyceridemia | 3 | GAD,LHGDN |
| umls:C0030305 | Pancreatitis | 3 | BeFree,GAD |
| umls:C0002395 | Alzheimer's Disease | 2 | BeFree,GAD |
| umls:C0004153 | Atherosclerosis | 2 | BeFree,GAD |
| umls:C0007222 | Cardiovascular Diseases | 2 | BeFree,GAD |
| umls:C0149521 | Pancreatitis, Chronic | 2 | BeFree |
| umls:C1956346 | Coronary Artery Disease | 2 | GAD |
| umls:C0001418 | Adenocarcinoma | 1 | BeFree |
| umls:C0003850 | Arteriosclerosis | 1 | BeFree |
| umls:C0007102 | Malignant tumor of colon | 1 | BeFree |
| umls:C0011609 | Drug Eruptions | 1 | CTD_human |
| umls:C0013080 | Down Syndrome | 1 | BeFree |
| umls:C0017638 | Glioma | 1 | BeFree |
| umls:C0019196 | Hepatitis C | 1 | GAD |
| umls:C0020445 | Hypercholesterolemia, Familial | 1 | BeFree |
| umls:C0020476 | Hyperlipoproteinemias | 1 | BeFree |
| umls:C0020479 | Hyperlipoproteinemia Type III | 1 | BeFree,GAD |
| umls:C0020597 | Hypobetalipoproteinemias | 1 | BeFree |
| umls:C0021670 | insulinoma | 1 | BeFree |
| umls:C0023903 | Liver neoplasms | 1 | BeFree |
| umls:C0023904 | Liver Neoplasms, Experimental | 1 | CTD_human |
| umls:C0026769 | Multiple Sclerosis | 1 | BeFree,GAD |
| umls:C0029925 | Ovarian Carcinoma | 1 | BeFree |
| umls:C0035335 | Retinoblastoma | 1 | BeFree |
| umls:C0038238 | Steatorrhea | 1 | GAD |
| umls:C0152013 | Adenocarcinoma of lung (disorder) | 1 | BeFree |
| umls:C0178874 | Tumor Progression | 1 | BeFree |
| umls:C0242007 | myotonic muscular dystrophy | 1 | BeFree |
| umls:C0242339 | Dyslipidemias | 1 | BeFree |
| umls:C0271650 | Impaired glucose tolerance | 1 | BeFree |
| umls:C0302314 | Xanthoma | 1 | BeFree |
| umls:C0494463 | Alzheimer Disease, Late Onset | 1 | BeFree |
| umls:C0524620 | Metabolic Syndrome X | 1 | BeFree |
| umls:C0699790 | Colon Carcinoma | 1 | BeFree |
| umls:C1140680 | Malignant neoplasm of ovary | 1 | BeFree |
| umls:C1270972 | Mild cognitive disorder | 1 | BeFree |
| umls:C1274228 | Chylomicronemia syndrome | 1 | BeFree |
| umls:C1291447 | Deficiency of triacylglycerol lipase | 1 | BeFree |
| umls:C1522137 | Hypertriglyceridemia result | 1 | GAD |
| umls:C1862596 | Familial hypobetalipoproteinemia | 1 | BeFree |
| umls:C2239176 | Liver carcinoma | 1 | BeFree |
| umls:C2931862 | Familial hyperchylomicronemia syndrome | 1 | BeFree |
| umls:C3714619 | Insulin resistance syndrome | 1 | BeFree |
| umls:C0268199 | Familial apolipoprotein C-II deficiency | 0 | ORPHANET |
|
Copyright 2016-Present - The University of Texas Health Science Center at Houston (UTHealth) Web File Viewing | How to Report, Fraud, Waste and Abuse | State of Texas | Statewide Search | Texas Homeland Security | Site Policies |