 |
| |
| |
| |
| |
| |
| |
|

| TissGeneSummary for AADACL2 |
 Gene summary Gene summary |
| Basic gene information | Gene symbol | AADACL2 |
| Gene name | arylacetamide deacetylase-like 2 | |
| Synonyms | - | |
| Cytomap | UCSC genome browser: 3q25.1 | |
| Type of gene | protein-coding | |
| RefGenes | NM_207365.3, | |
| Description | - | |
| Modification date | 20141207 | |
| dbXrefs | HGNC : HGNC | |
| Ensembl : ENSG00000197953 | ||
| HPRD : 14705 | ||
| Vega : OTTHUMG00000155914 | ||
| Protein | UniProt: go to UniProt's Cross Reference DB Table | |
| Expression | CleanEX: HS_AADACL2 | |
| BioGPS: 344752 | ||
| Pathway | NCI Pathway Interaction Database: AADACL2 | |
| KEGG: AADACL2 | ||
| REACTOME: AADACL2 | ||
| Pathway Commons: AADACL2 | ||
| Context | iHOP: AADACL2 | |
| ligand binding site mutation search in PubMed: AADACL2 | ||
| UCL Cancer Institute: AADACL2 | ||
| Assigned class in TissGDB* | B | |
| Included tissue-specific gene expression resources | HPA,TiGER,GTEx | |
| Specific-tissues in normal samples (assigned by TissGDB using HPA, TiGER, and GTEx) | SkinUterus | |
| Cancer types related to the specific-tissues in cancer samples (assigned by TissGDB using TCGA) | SKCMUCEC,UCS | |
| Reference showing the relevant tissue of AADACL2 | ||
| Description by TissGene annotations | ||
| * Class A consists of genes with literature evidence and is part of the cTissGenes. Class B consists of only cTissGenes without additional evidence. The remaining genes belong to Class C. |
| Gene ontology having evidence of Inferred from Direct Assay (IDA) from Entrez |
| GO ID | GO term | PubMed ID |
| Top |
| TissGeneExp for AADACL2 |
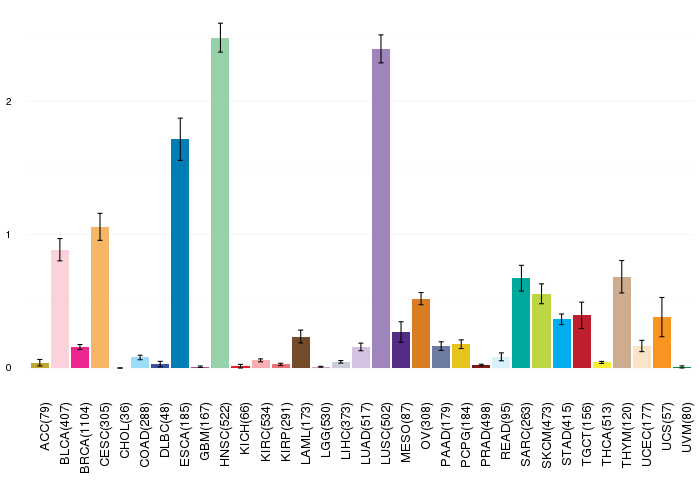
| Gene expressions across 28 cancer types (X-axis: cancer type and Y-axis: log2(norm_counts+1)) (TCGA IlluminaHiSeq_RNASeqV2, pan-cancer normalized log2(norm_counts+1) data, version 2016-08-16) |
 |
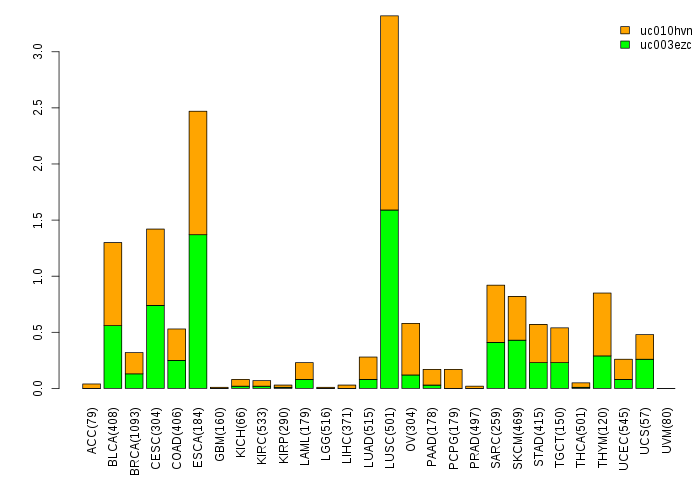
| Gene isoform expressions across 28 cancer types (X-axis: cancer type and Y-axis: log2(norm_counts+1)) (TCGA pan-cancer tcga_rsem_isoform_tpm, version 2016-09-01) |
 |
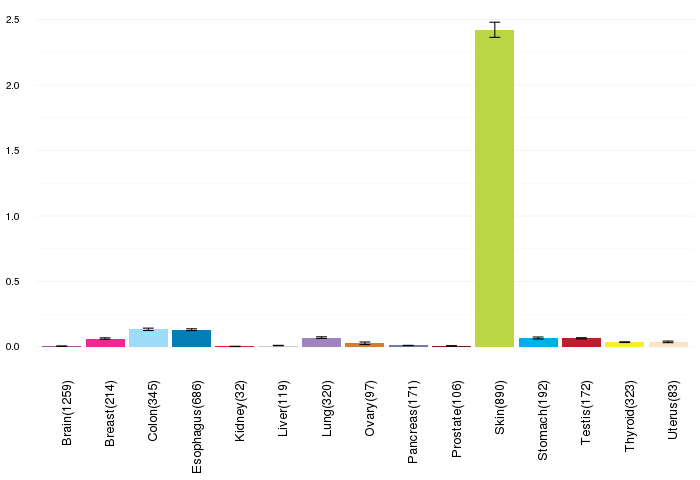
| Gene expressions across normal tissues of GTEx data (GTEx GTEx_Analysis_v6_RNA-seq_RNA-SeQCv1.1.8_gene_rpkm.gct) - Here, we shows the matched tissue types only among our 28 cancer types. |
 |
| Different expressions across 14 cancer types with more than 10 samples between matched tumors and normals (X-axis: cancer type and Y-axis: log2(norm_counts+1)) (TCGA IlluminaHiSeq_RNASeqV2, pan-cancer normalized log2(norm_counts+1) data, version 2016-08-16) |
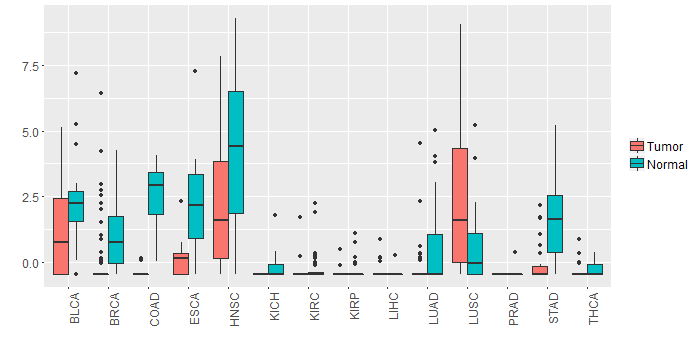 |
| - Significantly differentially expressed cancer types and information. (|Fold change|>1 and FDR<0.05) |
| Cancer type | Mean(exp) in tumor | Mean(exp) in matched normal | Log2FC | P-val. | FDR |
| BRCA | -0.147545102 | 0.971252267 | -1.118797368 | 1.80E-12 | 7.92E-12 |
| LUSC | 2.395986787 | 0.432982865 | 1.963003922 | 7.60E-06 | 1.75E-05 |
| COAD | -0.408882821 | 2.479932564 | -2.888815385 | 7.89E-12 | 1.60E-10 |
| STAD | -0.084864071 | 1.680170304 | -1.765034375 | 5.95E-07 | 1.08E-05 |
| HNSC | 2.284890435 | 4.17529276 | -1.890402326 | 0.00239 | 0.007198795 |
| Top |
| TissGene-miRNA for AADACL2 |
| Significantly anti-correlated miRNAs of TissGene across 28 cancer types (Gene-miRNA relations from TargetScanHuman Relsease 7.1, Conserved_Site_Context_Scores.txt.zip, 06.01.2016) (TCGA IlluminaHiSeq_miRNASeq, log2(RPM+1) data, version 2016-11-21) (TCGA IlluminaHiSeq_RNASeqV2, log2(normalized_count+1) data, version 2016-08-16) (Spearman’s Rank Correlation (p-value<0.05 and coefficient<-0.25)) |
| Cancer type | miRNA id | miRNA accession | P-val. | Coeff. | # samples |
| Top |
| TissGeneMut for AADACL2 |
| TissGeneSNV for AADACL2 |
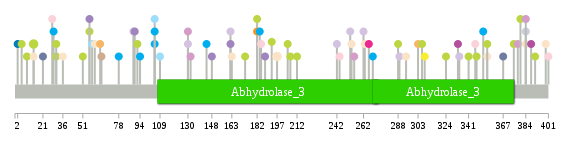
| nsSNV counts per each loci. Different colors of circles represent different cancer types. Circle size denotes number of samples. (TCGA somatic mutation (SNPs and small INDELs) data, version 2016-04-25) * Click on the image to enlarge it in a new window. |
 |
 |
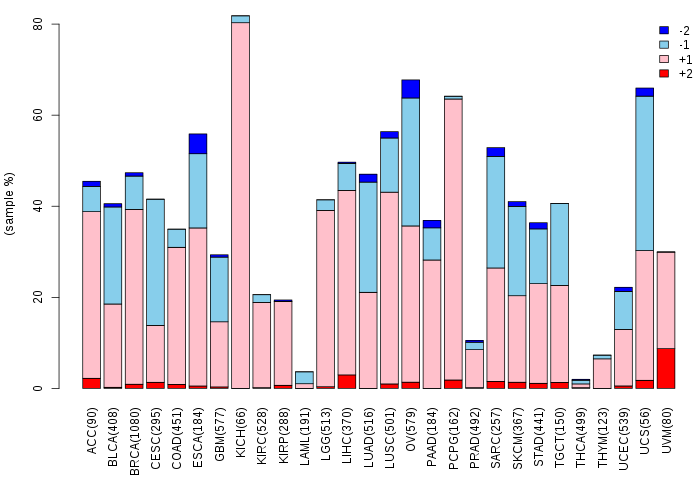
| Somatic nucleotide variants of TissGene across 28 cancer types (X-axis: cancer type and Y-axis: % of mutated samples) The numbers in parentheses are numbers of samples with mutation (nsSNVs). (TCGA somatic mutation (SNPs and small INDELs) data, version 2016-04-25) |
 |
| - nsSNVs sorted by frequency. |
| AAchange | Cancer type | # samples |
| p.A197V | UCEC | 2 |
| p.L14F | SKCM | 2 |
| p.P288S | SKCM | 1 |
| p.I185V | BLCA | 1 |
| p.R130K | LUAD | 1 |
| p.M56I | SKCM | 1 |
| p.A163V | UCEC | 1 |
| p.T352A | STAD | 1 |
| p.K399T | UCEC | 1 |
| p.Y253H | UCEC | 1 |
| p.E51K | SKCM | 1 |
| p.E28* | BLCA | 1 |
| p.G303E | CESC | 1 |
| p.R355* | UCEC | 1 |
| p.L252V | LUAD | 1 |
| p.T378S | LGG | 1 |
| p.I65L | THYM | 1 |
| p.T242N | LUAD | 1 |
| p.T255N | LGG | 1 |
| p.P90A | LUSC | 1 |
| p.T21A | PAAD | 1 |
| p.E367K | PAAD | 1 |
| p.A5V | SKCM | 1 |
| p.L401V | BLCA | 1 |
| p.R384H | LIHC | 1 |
| p.L14I | UCEC | 1 |
| p.A5T | HNSC | 1 |
| p.R182Q | UCS | 1 |
| p.R384H | LGG | 1 |
| p.S308L | THCA | 1 |
| p.R388K | GBM | 1 |
| p.M56I | LUSC | 1 |
| p.H269P | STAD | 1 |
| p.D341N | SKCM | 1 |
| p.N193D | SKCM | 1 |
| p.G347E | SKCM | 1 |
| p.D188E | LUSC | 1 |
| p.D391N | SKCM | 1 |
| p.Y58F | COAD | 1 |
| p.Y109C | COAD | 1 |
| p.M64I | CESC | 1 |
| p.R92Q | SKCM | 1 |
| p.L173P | SKCM | 1 |
| p.R355Q | SKCM | 1 |
| p.R182Q | SKCM | 1 |
| p.R105Q | COAD | 1 |
| p.C184Y | STAD | 1 |
| p.Y334N | LUAD | 1 |
| p.R384C | UCEC | 1 |
| p.T132M | LGG | 1 |
| p.E289Q | LUAD | 1 |
| p.S308X | READ | 1 |
| p.D294Y | UCEC | 1 |
| p.I89T | LUAD | 1 |
| p.W31* | SKCM | 1 |
| p.Y78N | STAD | 1 |
| p.E60* | UCEC | 1 |
| p.G2W | ESCA | 1 |
| p.D324N | SKCM | 1 |
| p.R105X | STAD | 1 |
| p.W262* | LUAD | 1 |
| p.E29D | STAD | 1 |
| p.S306R | SKCM | 1 |
| p.I212M | SKCM | 1 |
| p.L36F | UCEC | 1 |
| p.E207K | SKCM | 1 |
| p.A263V | UCEC | 1 |
| p.A162V | LUAD | 1 |
| p.P380S | SKCM | 1 |
| p.A148P | LUSC | 1 |
| p.D346N | BLCA | 1 |
| p.D244N | BLCA | 1 |
| p.R105* | STAD | 1 |
| p.D144E | STAD | 1 |
| p.R266K | BRCA | 1 |
| p.G9R | SKCM | 1 |
| p.R130T | LGG | 1 |
| p.A162D | LUSC | 1 |
| p.T333I | GBM | 1 |
| p.Y94N | STAD | 1 |
| p.W31X | SKCM | 1 |
| p.D205N | SKCM | 1 |
| p.S375L | SKCM | 1 |
| Top |
| TissGeneCNV for AADACL2 |
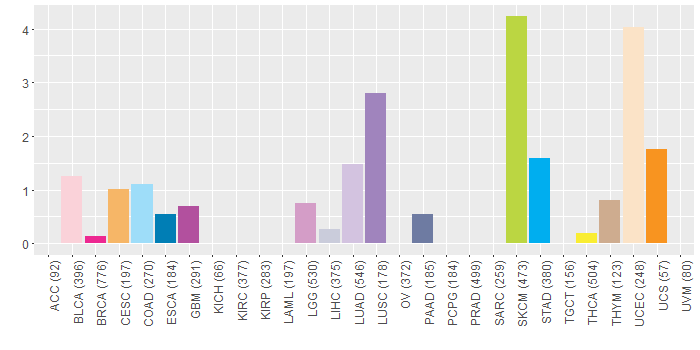
| Copy number variations of TissGene across 28 cancer types (X-axis: cancer type and Y-axis: % of CNV samples) (TCGA Gistic2_CopyNumber_Gistic2_all_data_by_genes, Gistic2 copy number data, version 2016-08-16) |
 |
| Top |
| TissGeneFusions for AADACL2 |
| Fusion genes including TissGene (ChimerDB 3.0, 2016-12-01 and TCGA fusion Portal 2015-12-01) |
| Database | Src | Cancer type | Sample | Fusion gene | ORF | 5'-gene BP | 3'-gene BP |
| Top |
| TissGeneNet for AADACL2 |
| Co-expressed gene networks based on protein-protein interaction data (CePIN) (TCGA IlluminaHiSeq_RNASeqV2, pan-cancer normalized log2(norm_counts+1) data, version 2016-08-16) (PINA2 ppi data) |
| Top |
| TissGeneProg for AADACL2 |
| Kaplan-Meier plots with logrank tests of overall survival (OS) using 28 cancer types (TCGA IlluminaHiSeq_RNASeqV2, pan-cancer normalized log2(norm_counts+1) data, version 2016-08-16) (TCGA clinicalMatrix, phenotype data, version 2016-04-27) * Click on the image to enlarge it in a new window. |
 |
| Kaplan-Meier plots with logrank test of relapse free survival (RFS) using 28 cancer types (TCGA IlluminaHiSeq_RNASeqV2, pan-cancer normalized log2(norm_counts+1) data, version 2016-08-16) (TCGA clinicalMatrix, phenotype data, version 2016-04-27) * Click on the image enlarge it in a new window. |
 |
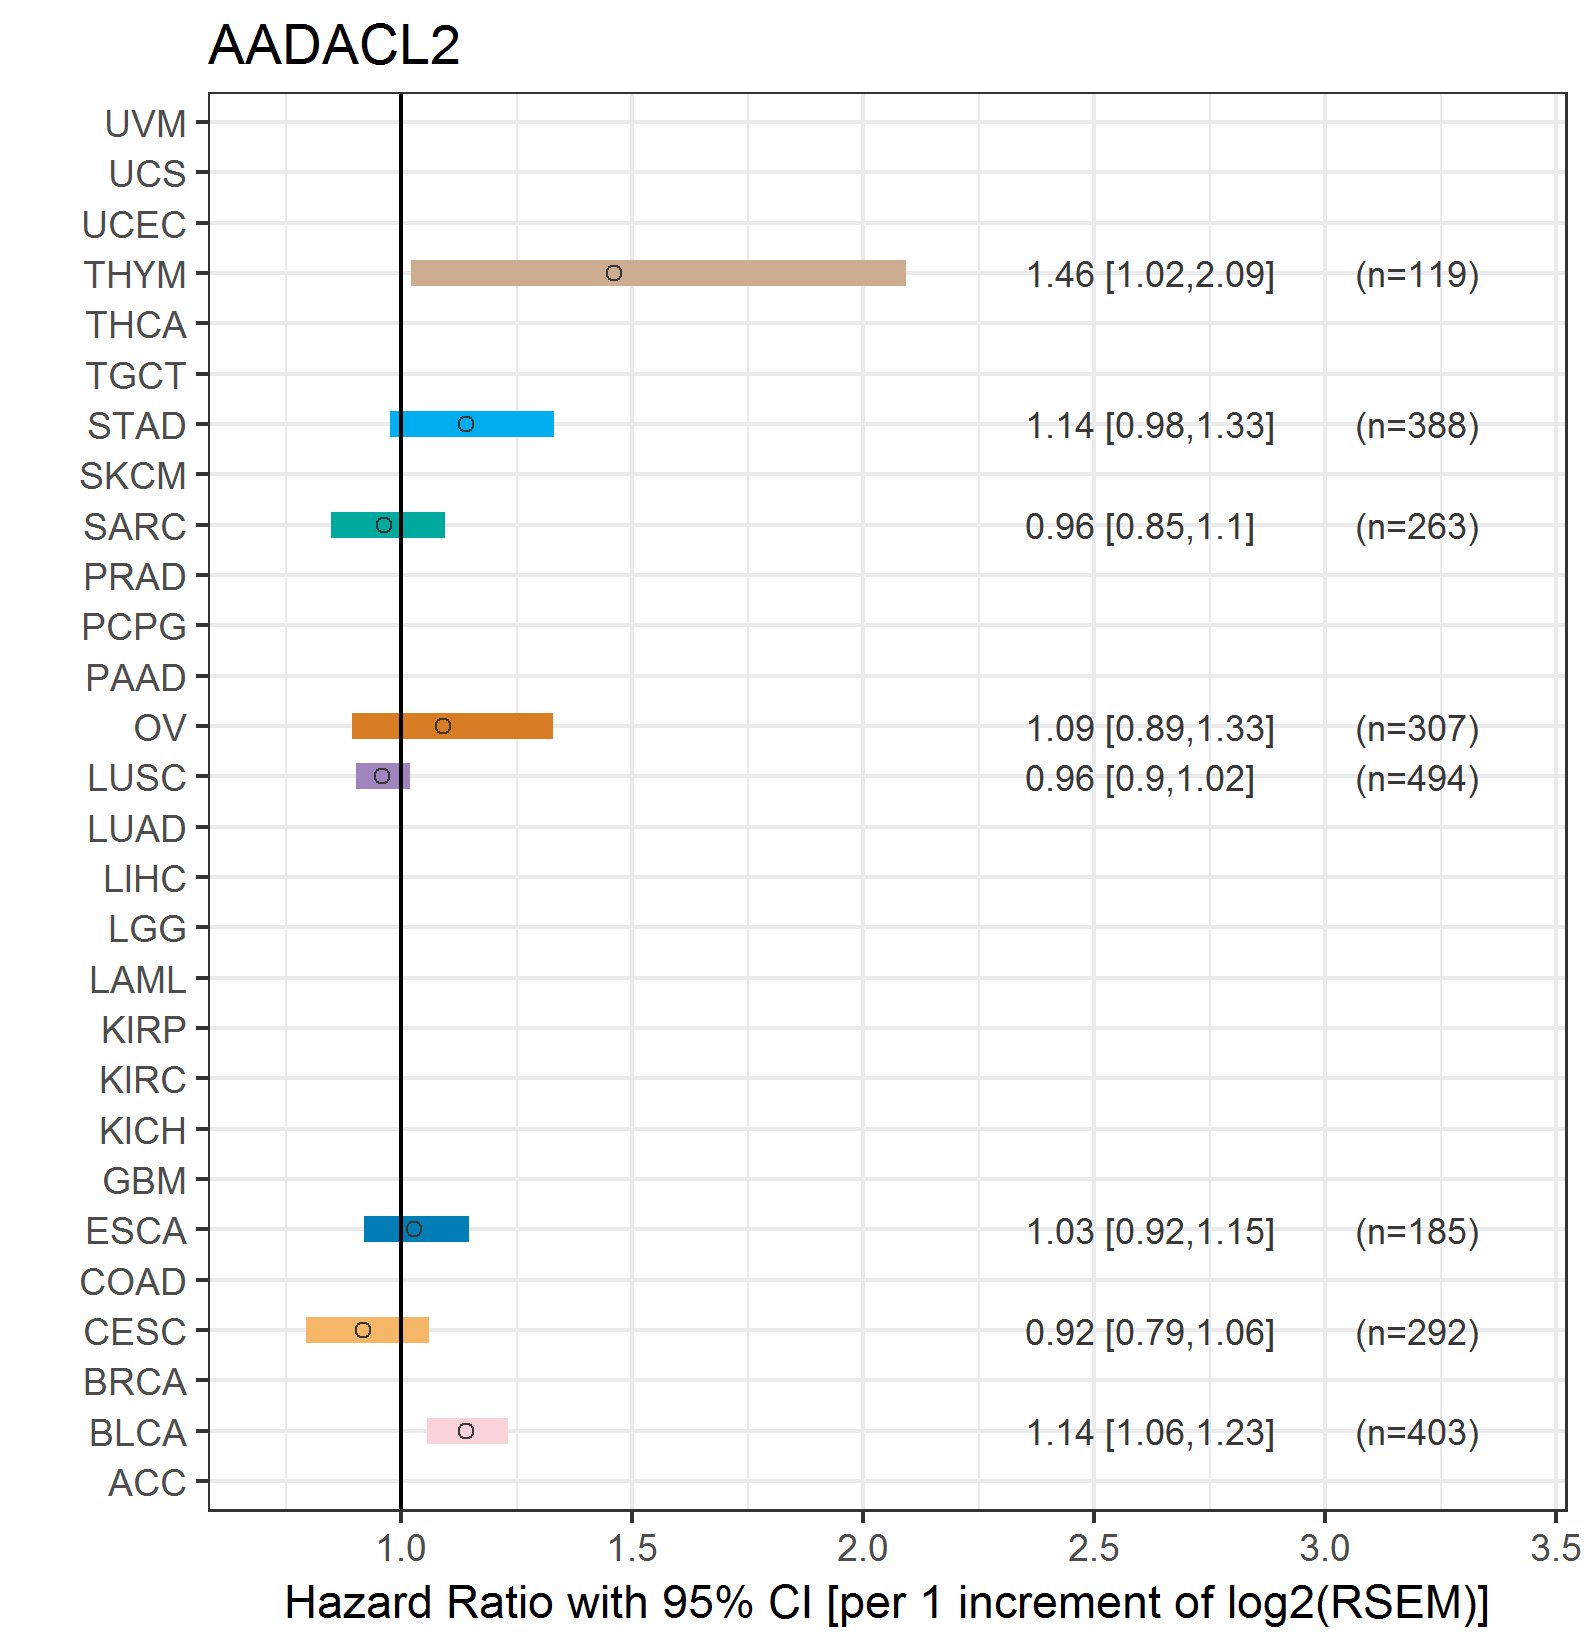
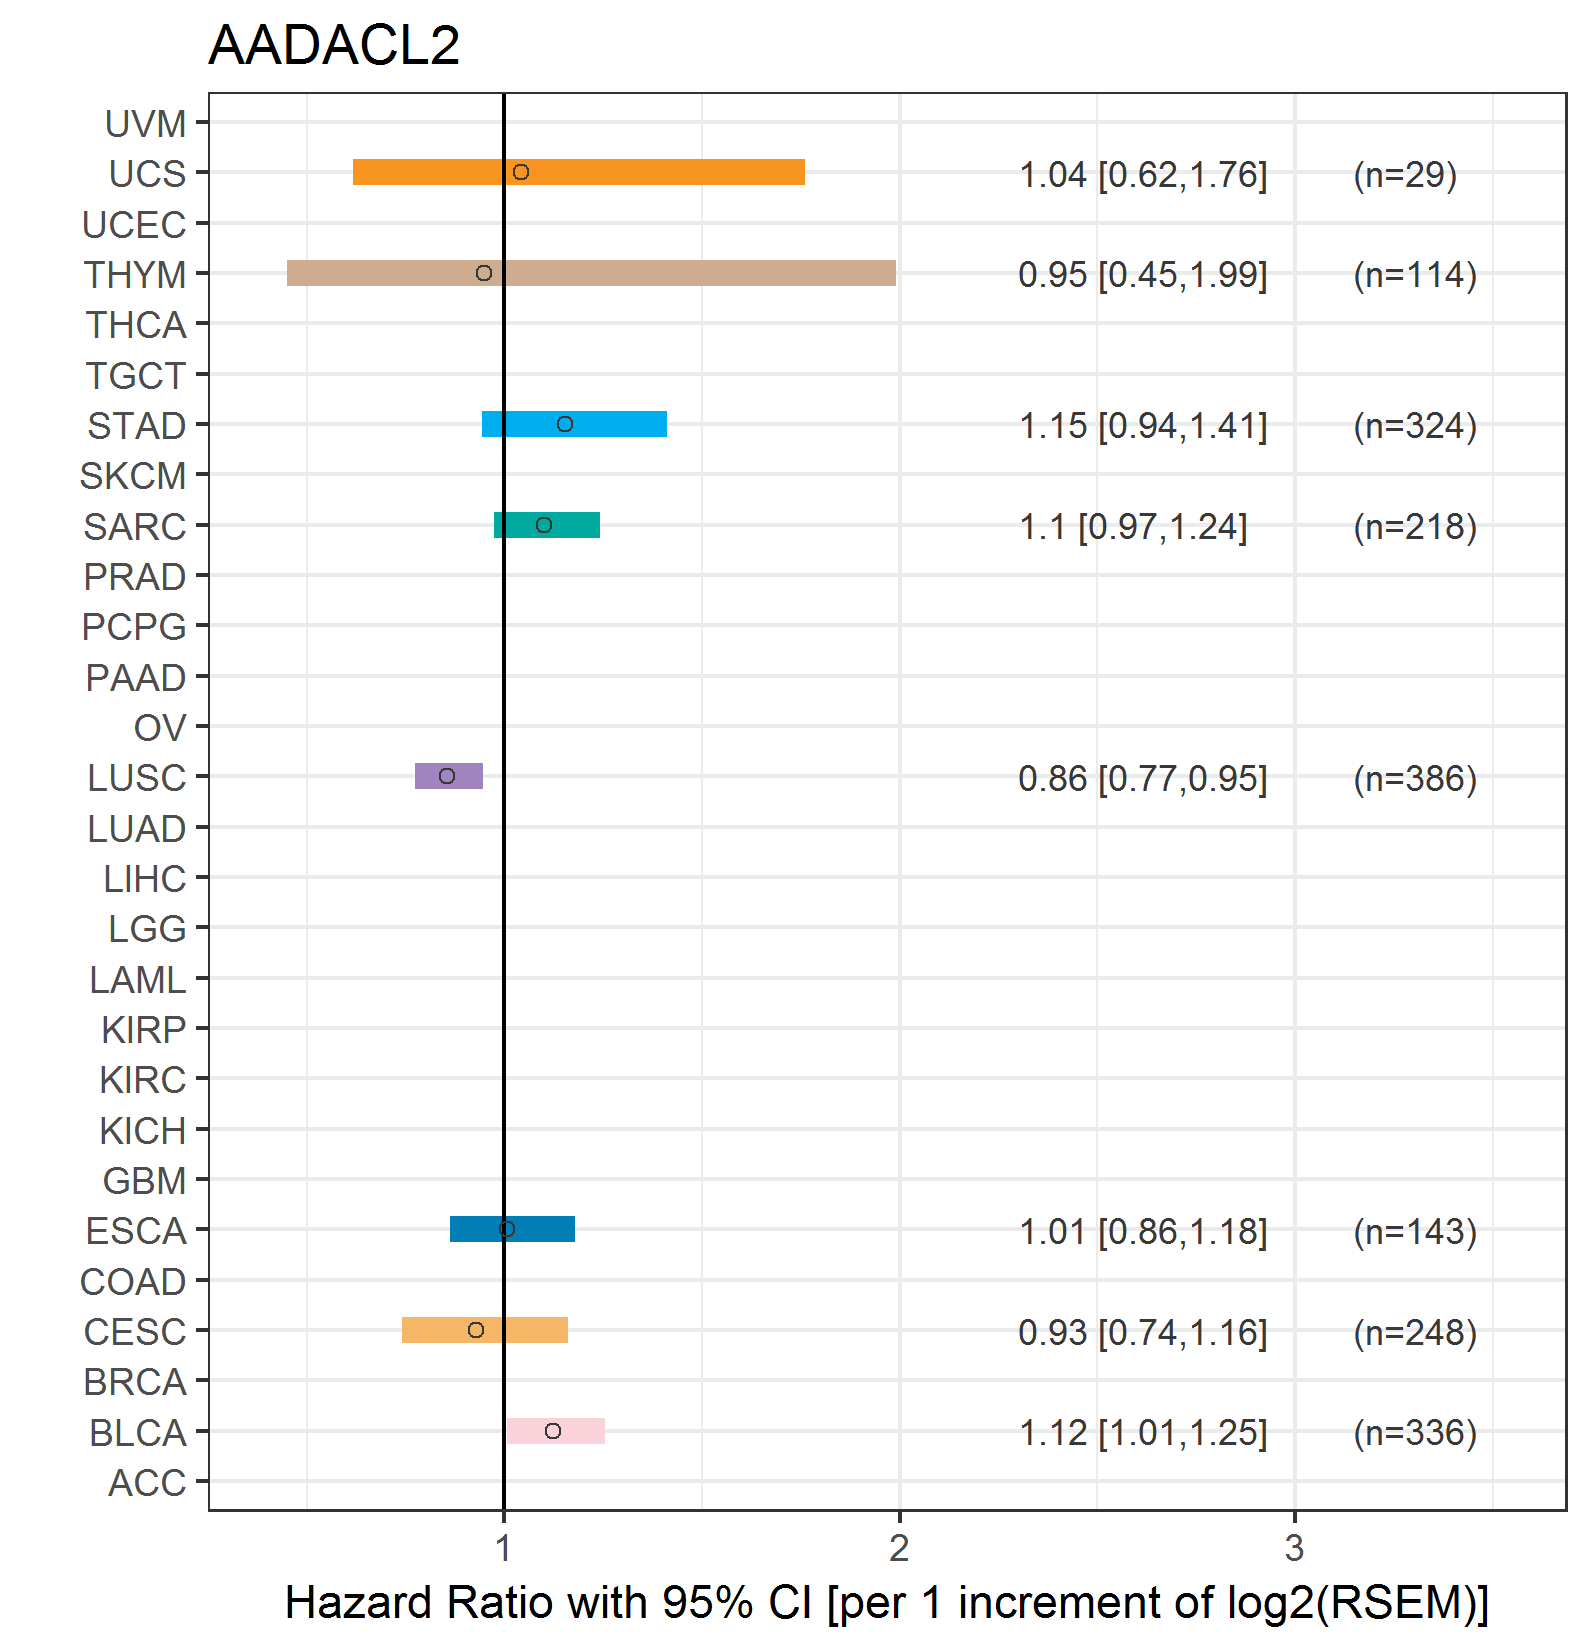
| Forest plot of Cox proportional hazard ratio (HR) and 95% CI of overall survival (OS) using 28 cancer types (TCGA IlluminaHiSeq_RNASeqV2, pan-cancer normalized log2(norm_counts+1) data, version 2016-08-16) (TCGA clinicalMatrix, phenotype data, version 2016-04-27) * Click on the image enlarge it in a new window. |
 |
| Forest plot of Cox proportional hazard ratio (HR) and 95% CI of relapse free survival (RFS) using 28 cancer types (TCGA IlluminaHiSeq_RNASeqV2, pan-cancer normalized log2(norm_counts+1) data, version 2016-08-16) (TCGA clinicalMatrix, phenotype data, version 2016-04-27) * Click on the image enlarge it in a new window. |
 |
| Top |
| TissGeneClin for AADACL2 |
| TissGeneDrug for AADACL2 |
| Drug information targeting TissGene (DrugBank Version 5.0.6, 2017-04-01) |
| DrugBank ID | Drug name | Drug activity | Drug type | Drug status |
| Top |
| TissGeneDisease for AADACL2 |
| Disease information associated with TissGene (DisGeNet, 2016-06-01) |
| Disease ID | Disease name | # pubmeds | Source |
|
Copyright 2016-Present - The University of Texas Health Science Center at Houston (UTHealth) Web File Viewing | How to Report, Fraud, Waste and Abuse | State of Texas | Statewide Search | Texas Homeland Security | Site Policies |