 |
| |
| |
| |
| |
| |
| |
|

| TissGeneSummary for IGFBPL1 |
 Gene summary Gene summary |
| Basic gene information | Gene symbol | IGFBPL1 |
| Gene name | insulin-like growth factor binding protein-like 1 | |
| Synonyms | IGFBP-RP4|IGFBPRP4|bA113O24.1 | |
| Cytomap | UCSC genome browser: 9p13.1 | |
| Type of gene | protein-coding | |
| RefGenes | NM_001007563.2, | |
| Description | IGFBP-related protein 10insulin-like growth factor binding protein related protein 4insulin-like growth factor-binding protein-like 1insulin-like growth factor-binding-related protein 4 | |
| Modification date | 20141207 | |
| dbXrefs | MIM : 610413 | |
| HGNC : HGNC | ||
| HPRD : 17138 | ||
| Protein | UniProt: go to UniProt's Cross Reference DB Table | |
| Expression | CleanEX: HS_IGFBPL1 | |
| BioGPS: 347252 | ||
| Pathway | NCI Pathway Interaction Database: IGFBPL1 | |
| KEGG: IGFBPL1 | ||
| REACTOME: IGFBPL1 | ||
| Pathway Commons: IGFBPL1 | ||
| Context | iHOP: IGFBPL1 | |
| ligand binding site mutation search in PubMed: IGFBPL1 | ||
| UCL Cancer Institute: IGFBPL1 | ||
| Assigned class in TissGDB* | C | |
| Included tissue-specific gene expression resources | HPA,GTEx | |
| Specific-tissues in normal samples (assigned by TissGDB using HPA, TiGER, and GTEx) | Thyroid gland | |
| Cancer types related to the specific-tissues in cancer samples (assigned by TissGDB using TCGA) | THCA | |
| Reference showing the relevant tissue of IGFBPL1 | ||
| Description by TissGene annotations | Cancer gene | |
| * Class A consists of genes with literature evidence and is part of the cTissGenes. Class B consists of only cTissGenes without additional evidence. The remaining genes belong to Class C. |
| Gene ontology having evidence of Inferred from Direct Assay (IDA) from Entrez |
| GO ID | GO term | PubMed ID |
| Top |
| TissGeneExp for IGFBPL1 |
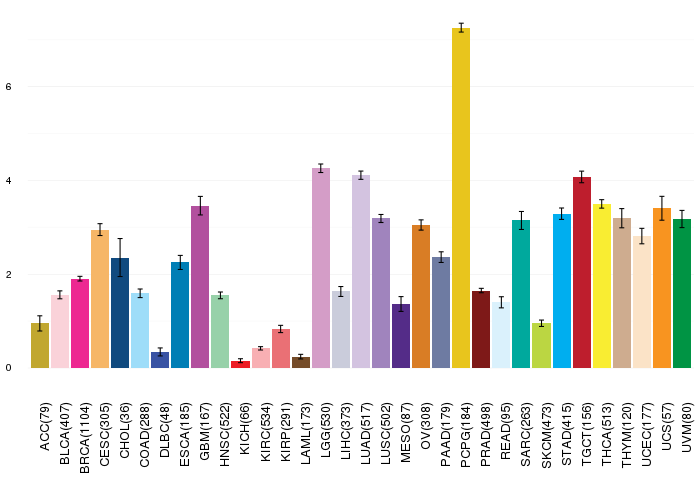
| Gene expressions across 28 cancer types (X-axis: cancer type and Y-axis: log2(norm_counts+1)) (TCGA IlluminaHiSeq_RNASeqV2, pan-cancer normalized log2(norm_counts+1) data, version 2016-08-16) |
 |
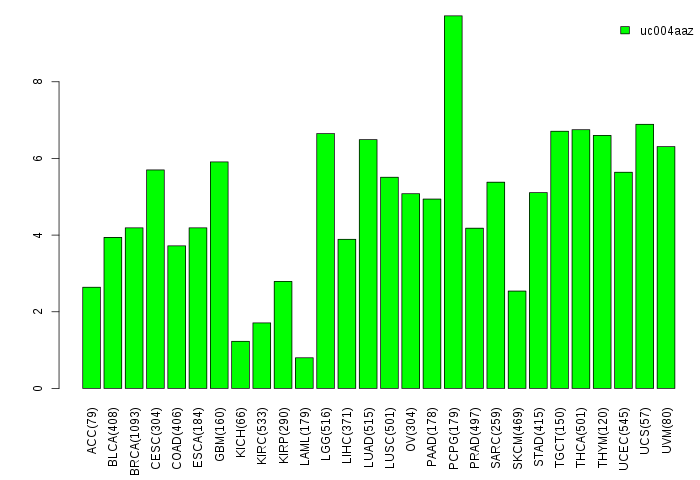
| Gene isoform expressions across 28 cancer types (X-axis: cancer type and Y-axis: log2(norm_counts+1)) (TCGA pan-cancer tcga_rsem_isoform_tpm, version 2016-09-01) |
 |
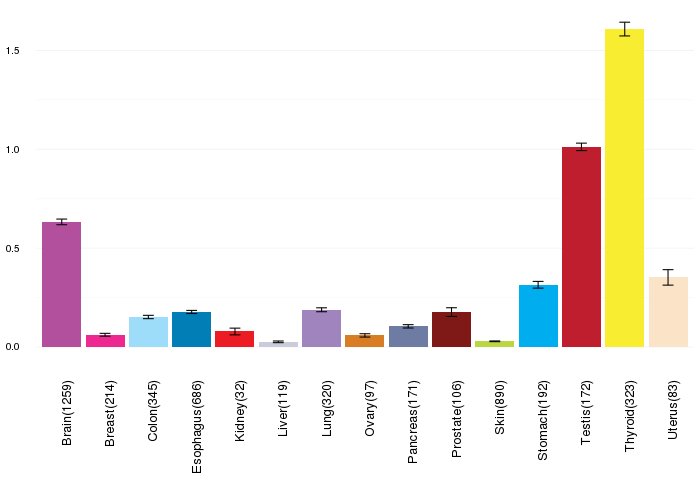
| Gene expressions across normal tissues of GTEx data (GTEx GTEx_Analysis_v6_RNA-seq_RNA-SeQCv1.1.8_gene_rpkm.gct) - Here, we shows the matched tissue types only among our 28 cancer types. |
 |
| Different expressions across 14 cancer types with more than 10 samples between matched tumors and normals (X-axis: cancer type and Y-axis: log2(norm_counts+1)) (TCGA IlluminaHiSeq_RNASeqV2, pan-cancer normalized log2(norm_counts+1) data, version 2016-08-16) |
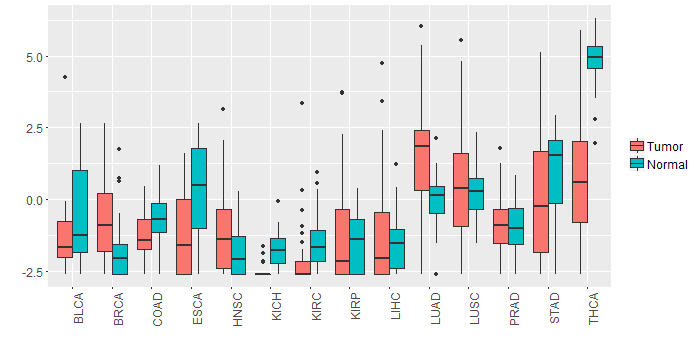 |
| - Significantly differentially expressed cancer types and information. (|Fold change|>1 and FDR<0.05) |
| Cancer type | Mean(exp) in tumor | Mean(exp) in matched normal | Log2FC | P-val. | FDR |
| BRCA | -0.712495059 | -1.885802953 | 1.173307895 | 1.42E-13 | 6.70E-13 |
| THCA | 0.705632476 | 4.825025697 | -4.11939322 | 5.24E-24 | 5.52E-22 |
| LUAD | 1.575774119 | -0.016777606 | 1.592551724 | 3.48E-08 | 1.46E-07 |
| Top |
| TissGene-miRNA for IGFBPL1 |
| Significantly anti-correlated miRNAs of TissGene across 28 cancer types (Gene-miRNA relations from TargetScanHuman Relsease 7.1, Conserved_Site_Context_Scores.txt.zip, 06.01.2016) (TCGA IlluminaHiSeq_miRNASeq, log2(RPM+1) data, version 2016-11-21) (TCGA IlluminaHiSeq_RNASeqV2, log2(normalized_count+1) data, version 2016-08-16) (Spearman’s Rank Correlation (p-value<0.05 and coefficient<-0.25)) |
| Cancer type | miRNA id | miRNA accession | P-val. | Coeff. | # samples |
| Top |
| TissGeneMut for IGFBPL1 |
| TissGeneSNV for IGFBPL1 |
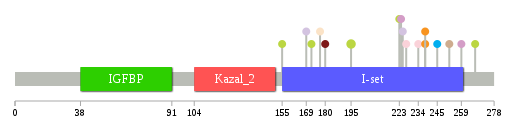
| nsSNV counts per each loci. Different colors of circles represent different cancer types. Circle size denotes number of samples. (TCGA somatic mutation (SNPs and small INDELs) data, version 2016-04-25) * Click on the image to enlarge it in a new window. |
 |
 |
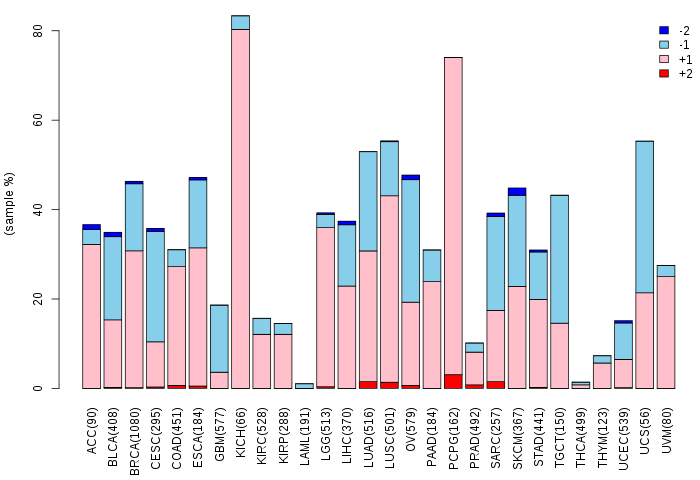
| Somatic nucleotide variants of TissGene across 28 cancer types (X-axis: cancer type and Y-axis: % of mutated samples) The numbers in parentheses are numbers of samples with mutation (nsSNVs). (TCGA somatic mutation (SNPs and small INDELs) data, version 2016-04-25) |
 |
| - nsSNVs sorted by frequency. |
| AAchange | Cancer type | # samples |
| p.P195S | SKCM | 2 |
| p.V258M | HNSC | 1 |
| p.R234Q | BLCA | 1 |
| p.W227C | BLCA | 1 |
| p.E238* | UCS | 1 |
| p.E238X | UCS | 1 |
| p.V172M | SKCM | 1 |
| p.A180V | PRAD | 1 |
| p.G169V | LUAD | 1 |
| p.A252T | THYM | 1 |
| p.E223Q | SKCM | 1 |
| p.A245V | STAD | 1 |
| p.T225S | LUAD | 1 |
| p.P160S | HNSC | 1 |
| p.T259M | LGG | 1 |
| p.P155L | SKCM | 1 |
| p.E177D | UCEC | 1 |
| p.R267K | SKCM | 1 |
| p.A224D | LGG | 1 |
| Top |
| TissGeneCNV for IGFBPL1 |
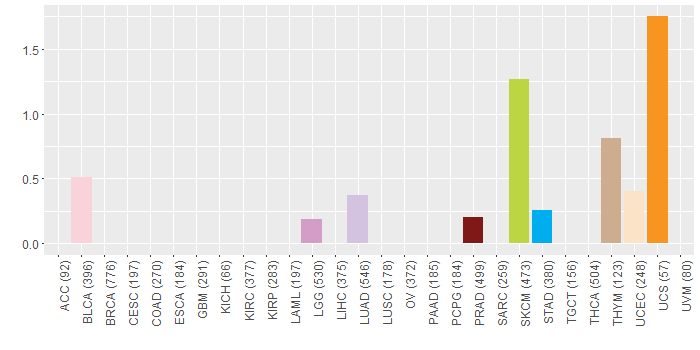
| Copy number variations of TissGene across 28 cancer types (X-axis: cancer type and Y-axis: % of CNV samples) (TCGA Gistic2_CopyNumber_Gistic2_all_data_by_genes, Gistic2 copy number data, version 2016-08-16) |
 |
| Top |
| TissGeneFusions for IGFBPL1 |
| Fusion genes including TissGene (ChimerDB 3.0, 2016-12-01 and TCGA fusion Portal 2015-12-01) |
| Database | Src | Cancer type | Sample | Fusion gene | ORF | 5'-gene BP | 3'-gene BP |
| Chimerdb3.0 | FusionScan | LUAD | TCGA-05-5425-01A | IGFBPL1-SHB | Out-of-Frame | chr9:38423961 | chr9:37920001 |
| Top |
| TissGeneNet for IGFBPL1 |
| Co-expressed gene networks based on protein-protein interaction data (CePIN) (TCGA IlluminaHiSeq_RNASeqV2, pan-cancer normalized log2(norm_counts+1) data, version 2016-08-16) (PINA2 ppi data) |
| Top |
| TissGeneProg for IGFBPL1 |
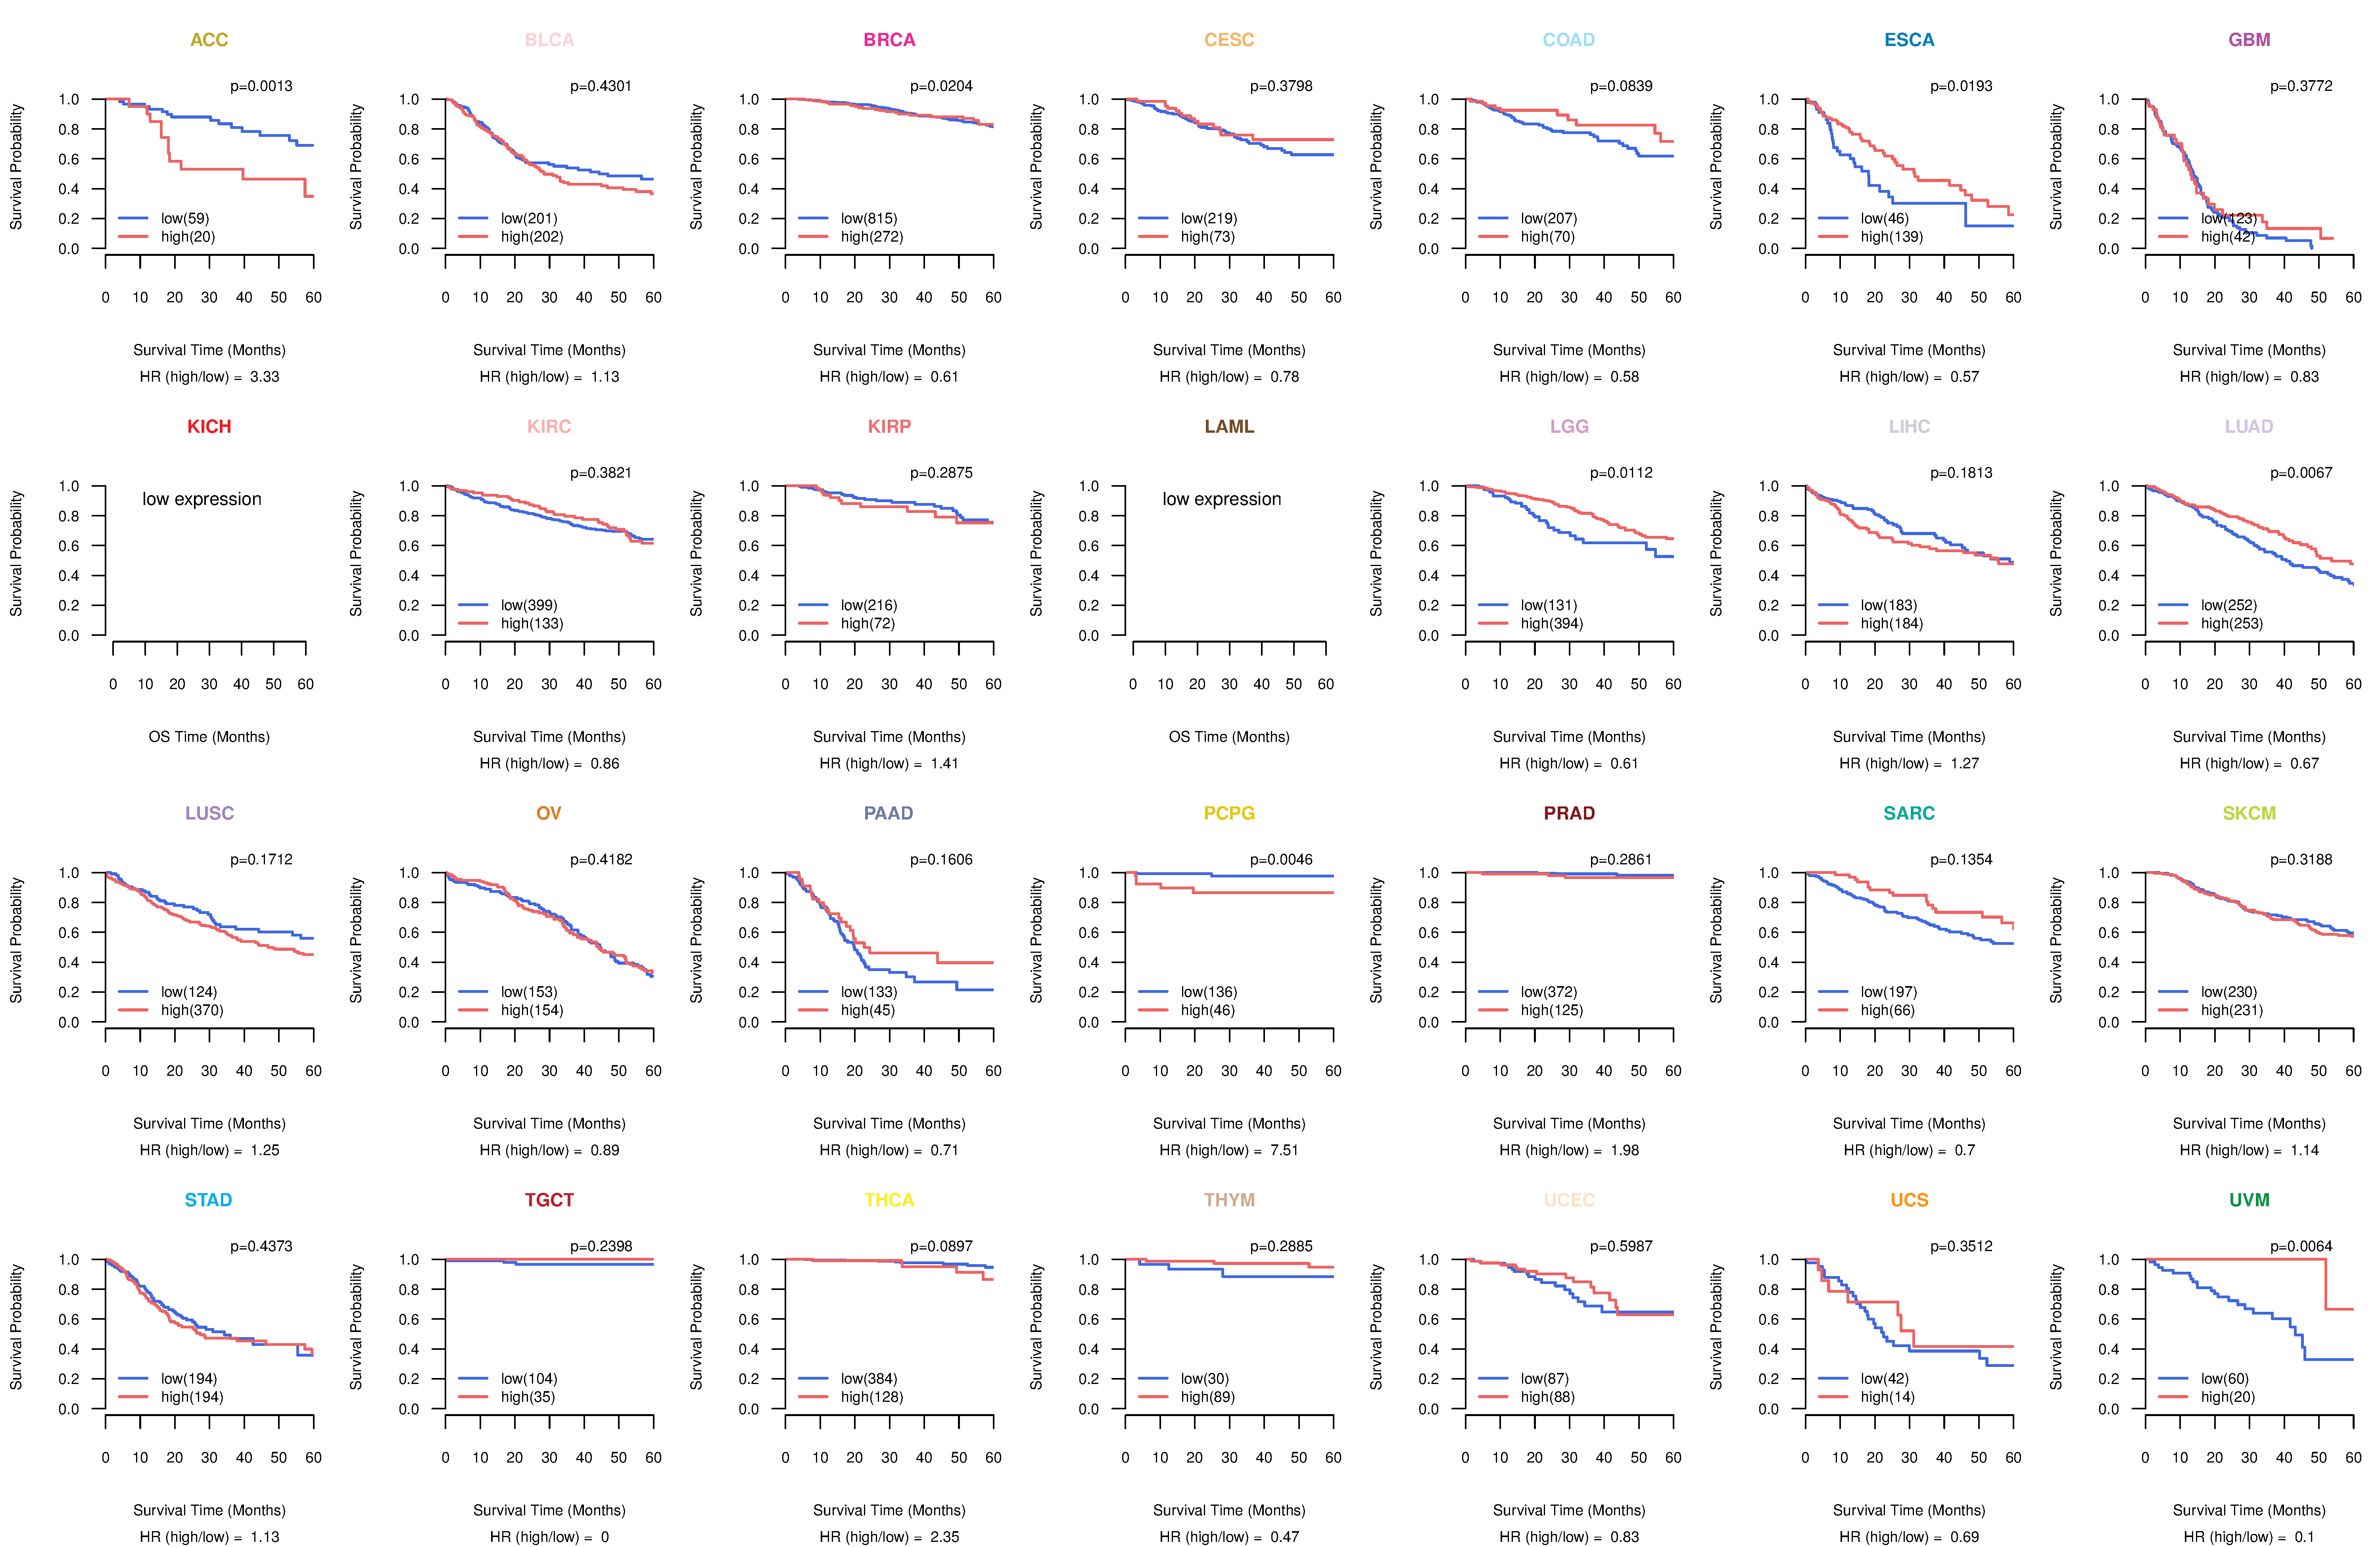
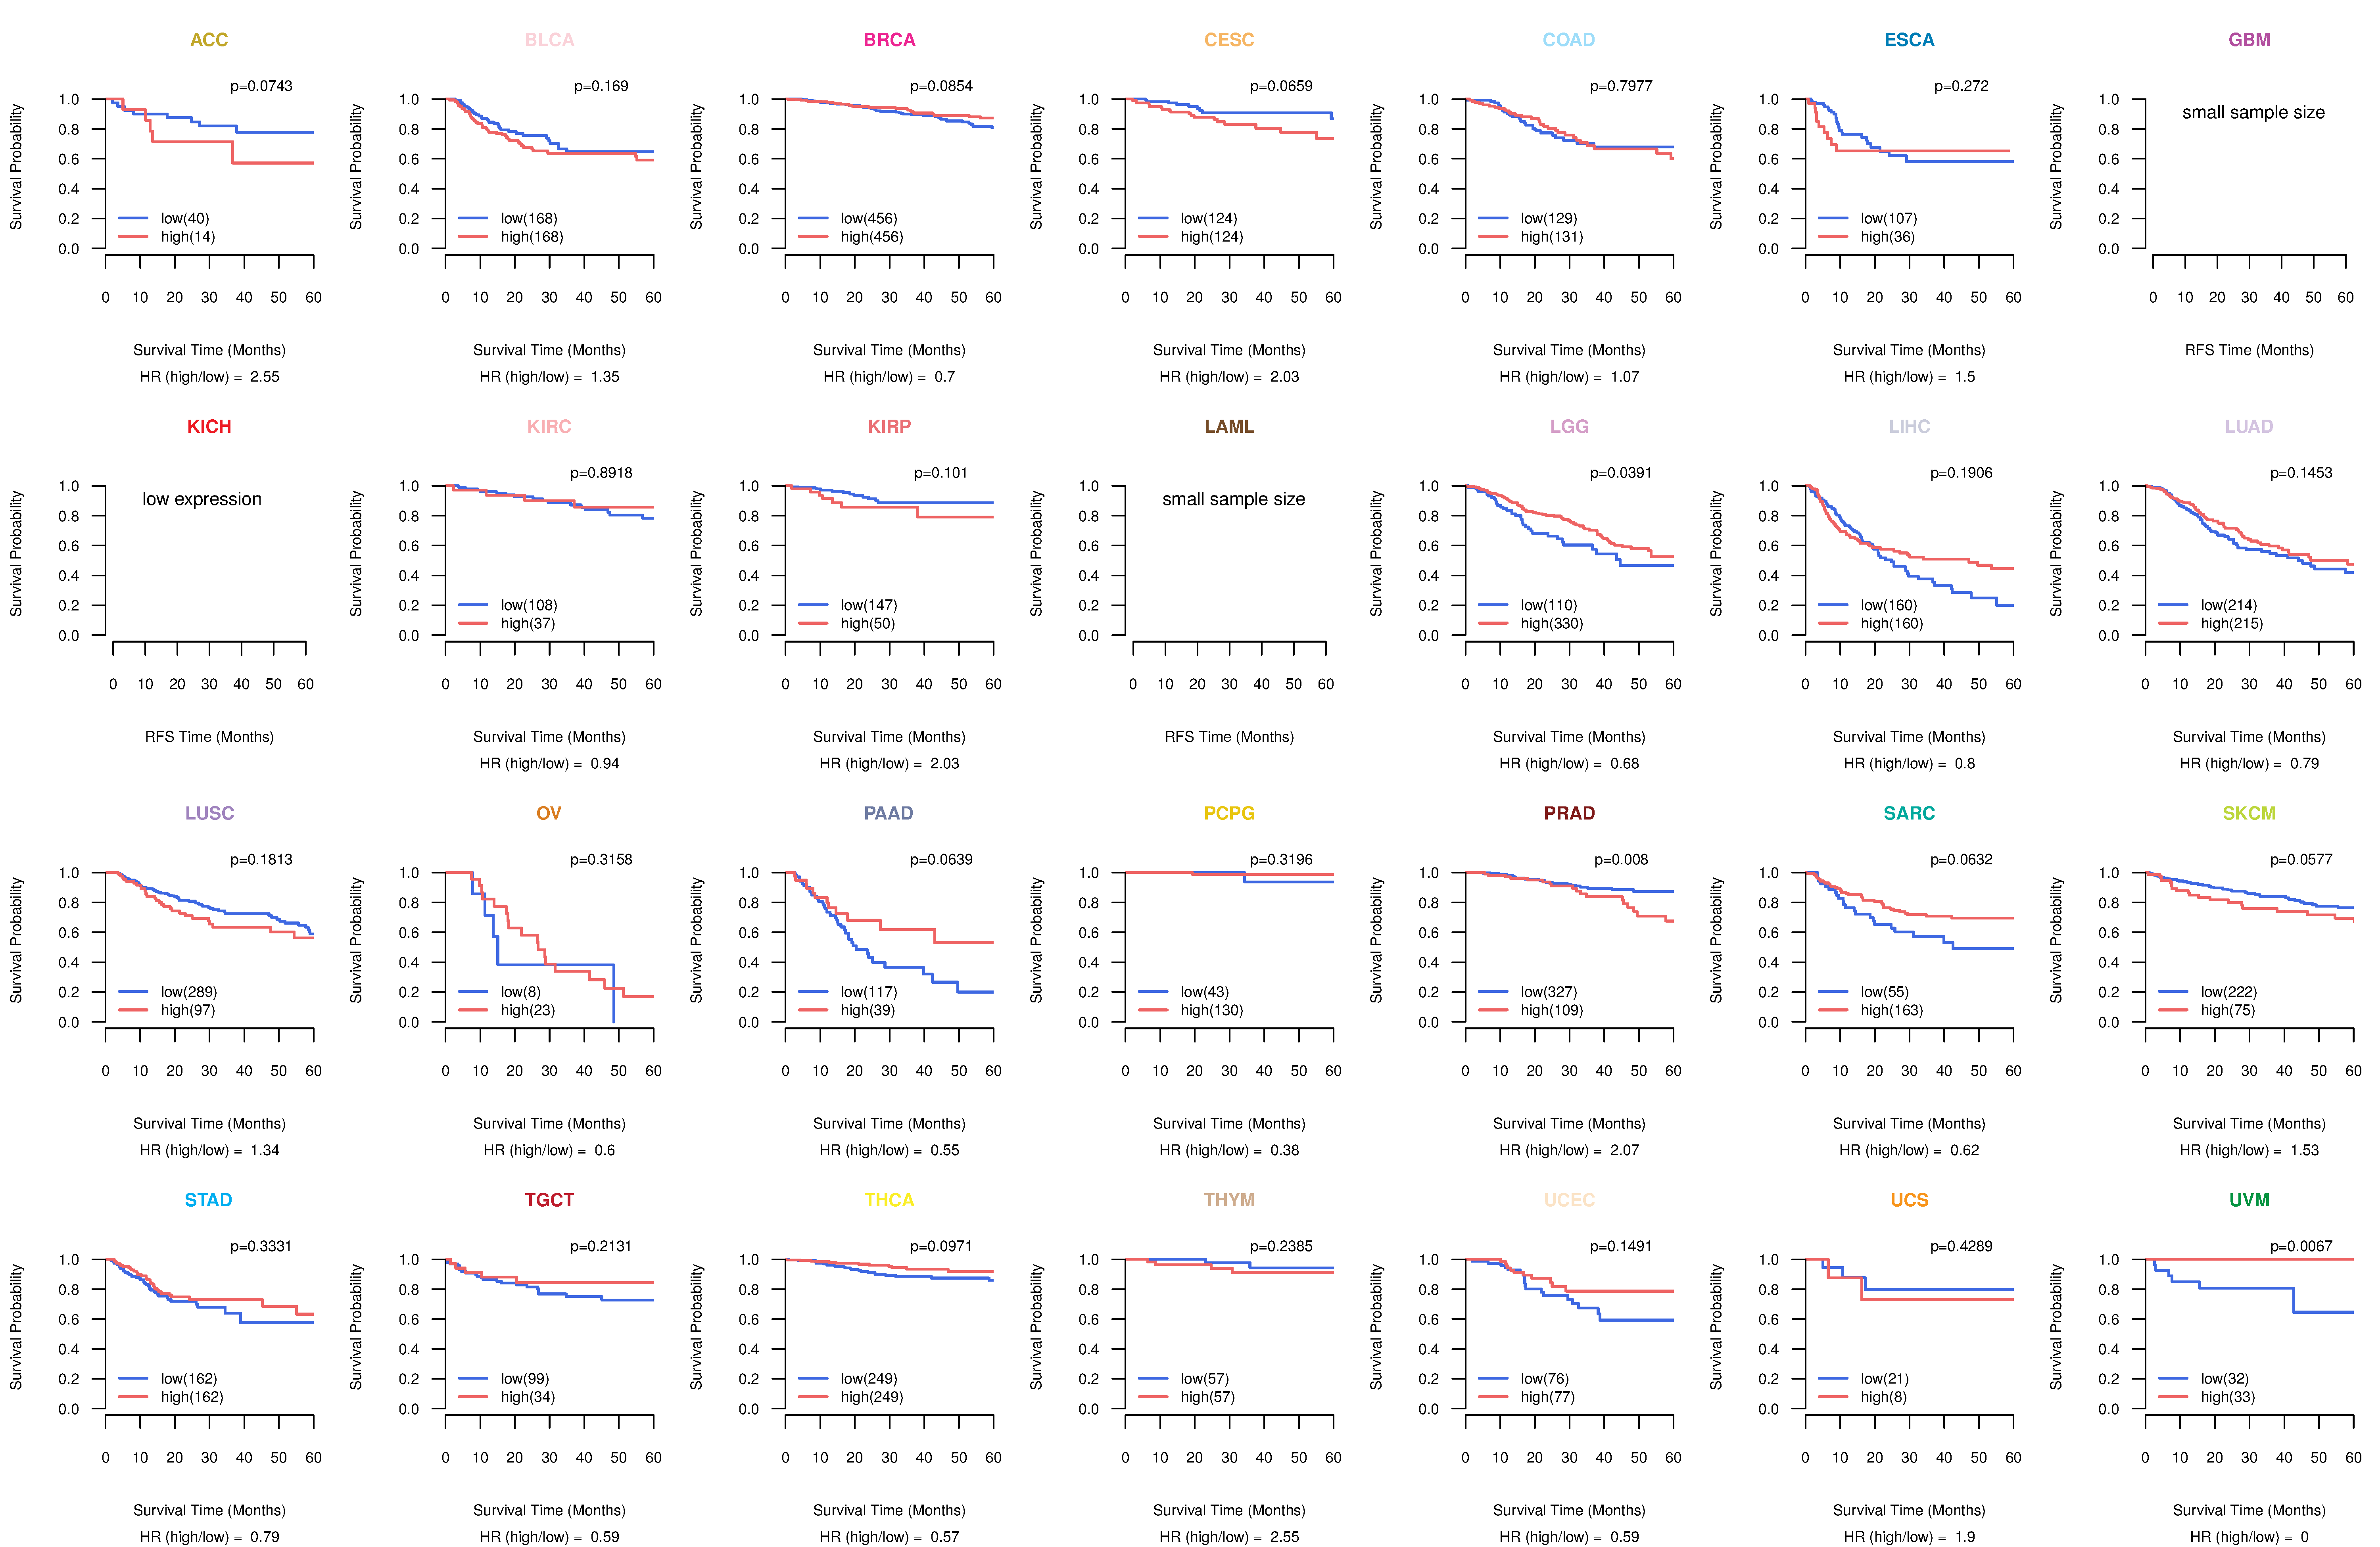
| Kaplan-Meier plots with logrank tests of overall survival (OS) using 28 cancer types (TCGA IlluminaHiSeq_RNASeqV2, pan-cancer normalized log2(norm_counts+1) data, version 2016-08-16) (TCGA clinicalMatrix, phenotype data, version 2016-04-27) * Click on the image to enlarge it in a new window. |
 |
| Kaplan-Meier plots with logrank test of relapse free survival (RFS) using 28 cancer types (TCGA IlluminaHiSeq_RNASeqV2, pan-cancer normalized log2(norm_counts+1) data, version 2016-08-16) (TCGA clinicalMatrix, phenotype data, version 2016-04-27) * Click on the image enlarge it in a new window. |
 |
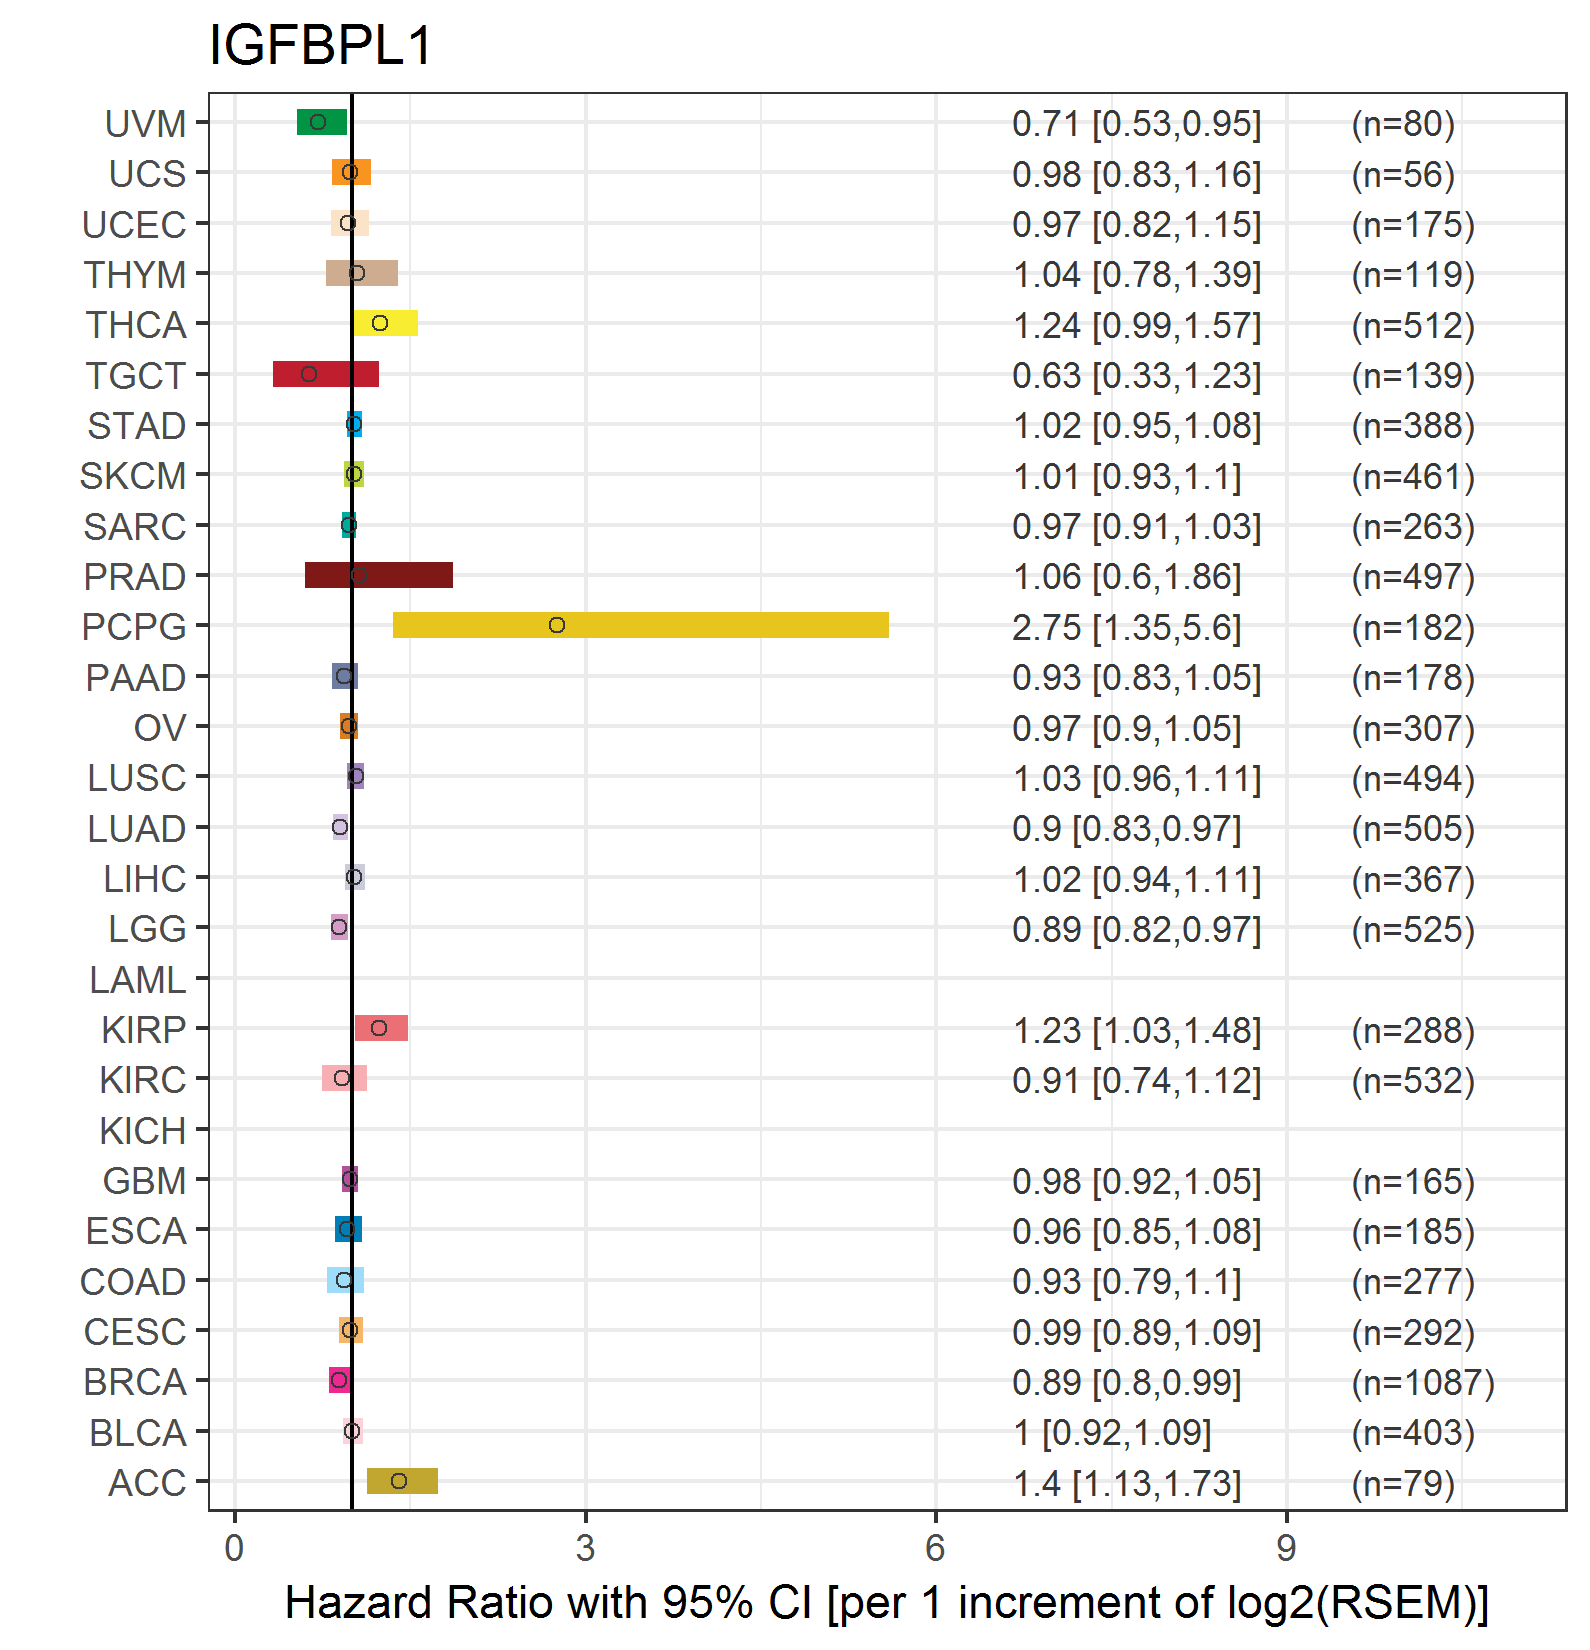
| Forest plot of Cox proportional hazard ratio (HR) and 95% CI of overall survival (OS) using 28 cancer types (TCGA IlluminaHiSeq_RNASeqV2, pan-cancer normalized log2(norm_counts+1) data, version 2016-08-16) (TCGA clinicalMatrix, phenotype data, version 2016-04-27) * Click on the image enlarge it in a new window. |
 |
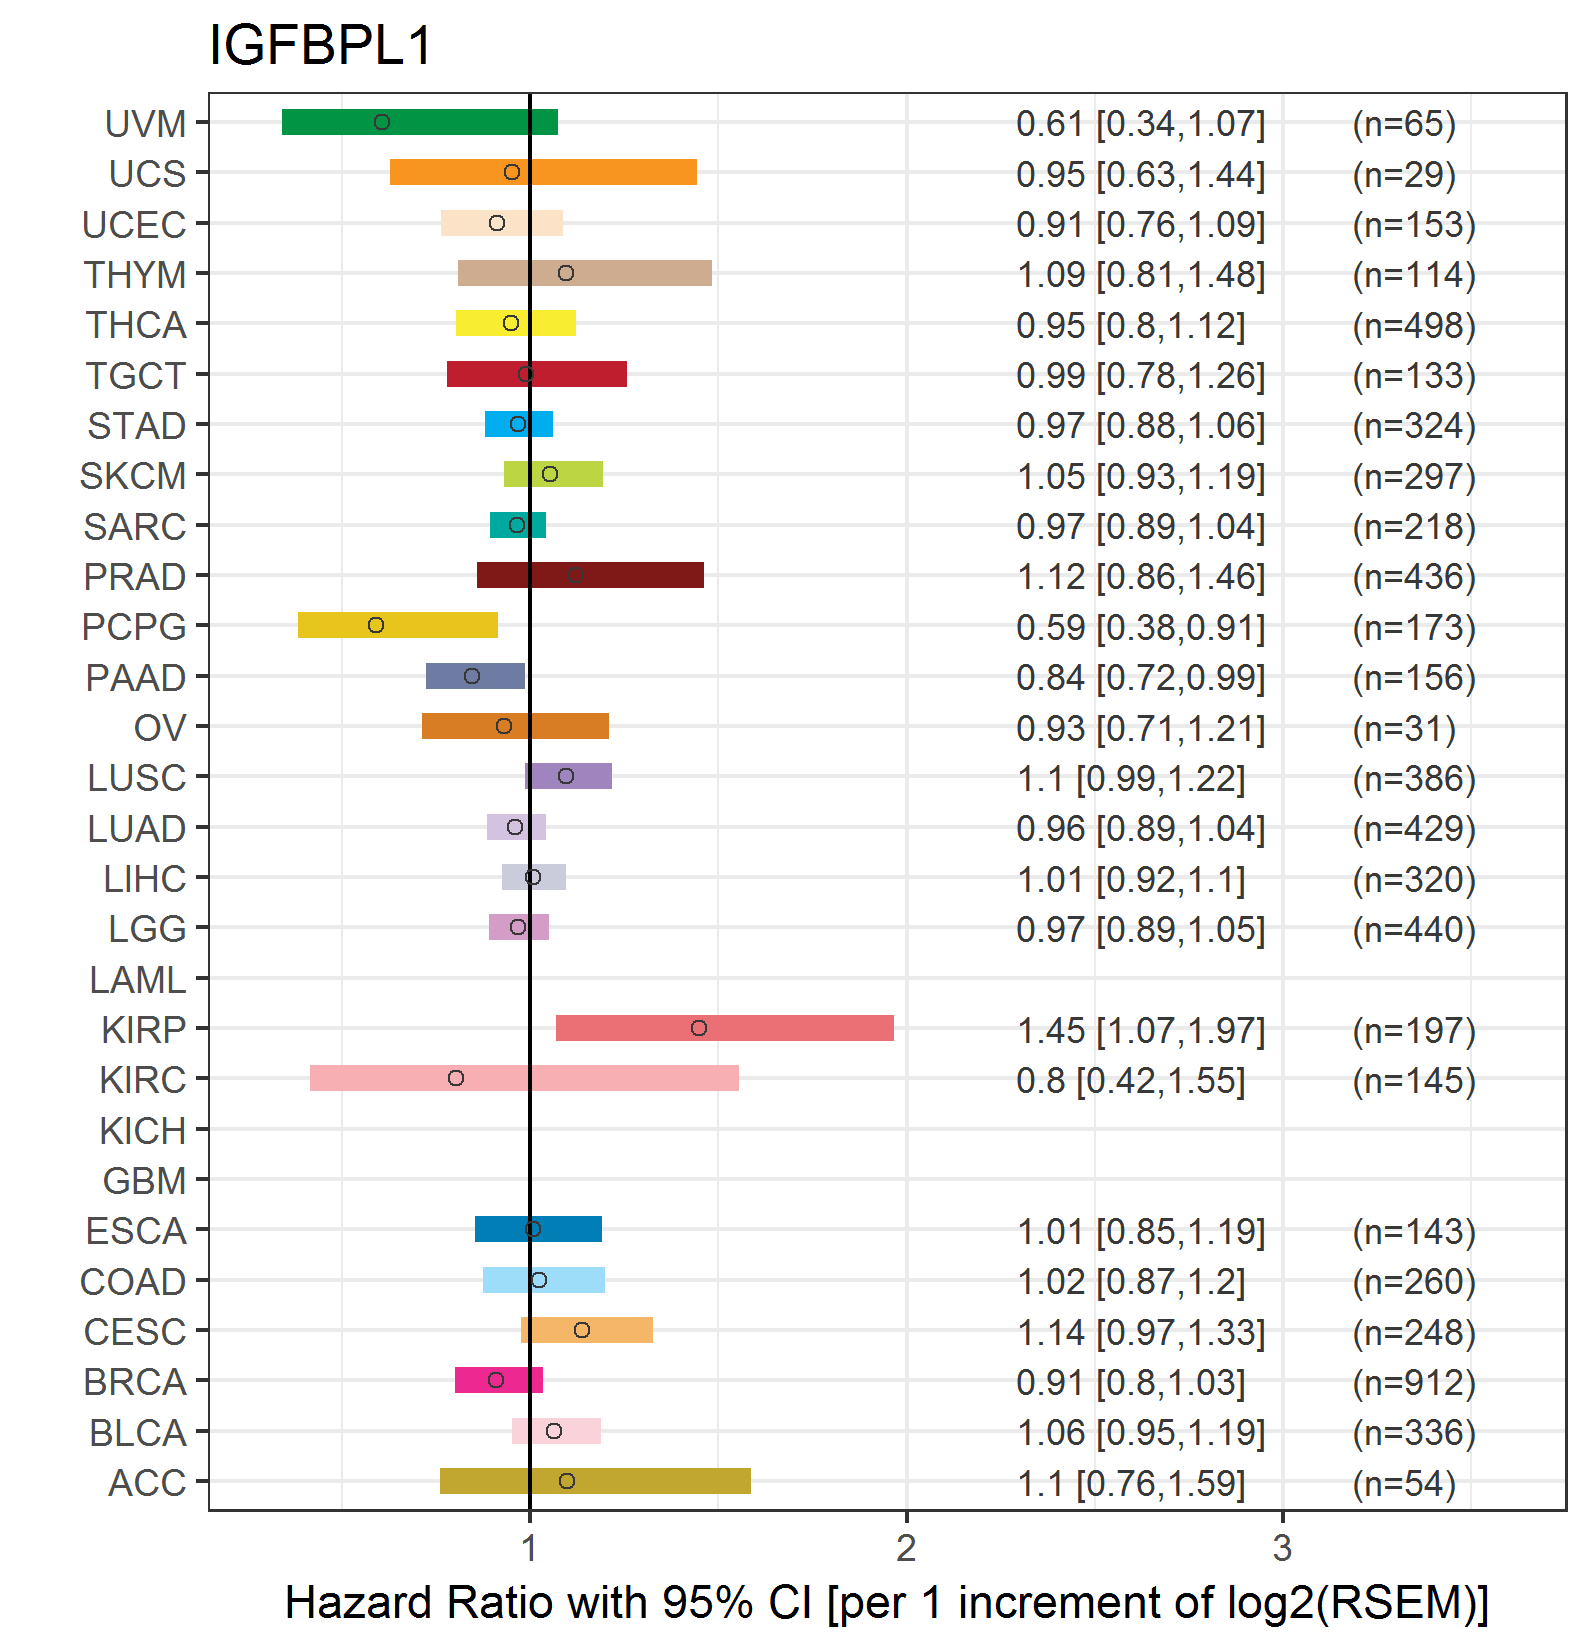
| Forest plot of Cox proportional hazard ratio (HR) and 95% CI of relapse free survival (RFS) using 28 cancer types (TCGA IlluminaHiSeq_RNASeqV2, pan-cancer normalized log2(norm_counts+1) data, version 2016-08-16) (TCGA clinicalMatrix, phenotype data, version 2016-04-27) * Click on the image enlarge it in a new window. |
 |
| Top |
| TissGeneClin for IGFBPL1 |
| TissGeneDrug for IGFBPL1 |
| Drug information targeting TissGene (DrugBank Version 5.0.6, 2017-04-01) |
| DrugBank ID | Drug name | Drug activity | Drug type | Drug status |
| Top |
| TissGeneDisease for IGFBPL1 |
| Disease information associated with TissGene (DisGeNet, 2016-06-01) |
| Disease ID | Disease name | # pubmeds | Source |
| umls:C0006142 | Malignant neoplasm of breast | 1 | BeFree |
| umls:C0011570 | Mental Depression | 1 | BeFree |
| umls:C0011581 | Depressive disorder | 1 | BeFree |
| umls:C0020538 | Hypertensive disease | 1 | GAD |
| umls:C0041696 | Unipolar Depression | 1 | BeFree |
| umls:C0678222 | Breast Carcinoma | 1 | BeFree |
| umls:C1269683 | Major Depressive Disorder | 1 | BeFree |
| umls:C1458155 | Mammary Neoplasms | 1 | LHGDN |
|
Copyright 2016-Present - The University of Texas Health Science Center at Houston (UTHealth) Web File Viewing | How to Report, Fraud, Waste and Abuse | State of Texas | Statewide Search | Texas Homeland Security | Site Policies |