 |
| |
| |
| |
| |
| |
| |
|

| TissGeneSummary for BMP8A |
 Gene summary Gene summary |
| Basic gene information | Gene symbol | BMP8A |
| Gene name | bone morphogenetic protein 8a | |
| Synonyms | - | |
| Cytomap | UCSC genome browser: 1p34.3 | |
| Type of gene | protein-coding | |
| RefGenes | NM_181809.3, | |
| Description | BMP-8Abone morphogenetic protein 8A | |
| Modification date | 20141207 | |
| dbXrefs | HGNC : HGNC | |
| HPRD : 16555 | ||
| Protein | UniProt: go to UniProt's Cross Reference DB Table | |
| Expression | CleanEX: HS_BMP8A | |
| BioGPS: 353500 | ||
| Pathway | NCI Pathway Interaction Database: BMP8A | |
| KEGG: BMP8A | ||
| REACTOME: BMP8A | ||
| Pathway Commons: BMP8A | ||
| Context | iHOP: BMP8A | |
| ligand binding site mutation search in PubMed: BMP8A | ||
| UCL Cancer Institute: BMP8A | ||
| Assigned class in TissGDB* | C | |
| Included tissue-specific gene expression resources | HPA,GTEx | |
| Specific-tissues in normal samples (assigned by TissGDB using HPA, TiGER, and GTEx) | Thyroid gland | |
| Cancer types related to the specific-tissues in cancer samples (assigned by TissGDB using TCGA) | THCA | |
| Reference showing the relevant tissue of BMP8A | ||
| Description by TissGene annotations | ||
| * Class A consists of genes with literature evidence and is part of the cTissGenes. Class B consists of only cTissGenes without additional evidence. The remaining genes belong to Class C. |
| Gene ontology having evidence of Inferred from Direct Assay (IDA) from Entrez |
| GO ID | GO term | PubMed ID | GO:0002024 | diet induced thermogenesis | 22579288 | GO:0046676 | negative regulation of insulin secretion | 22579288 | GO:2000505 | regulation of energy homeostasis | 22579288 | GO:0002024 | diet induced thermogenesis | 22579288 | GO:0046676 | negative regulation of insulin secretion | 22579288 | GO:2000505 | regulation of energy homeostasis | 22579288 |
| Top |
| TissGeneExp for BMP8A |
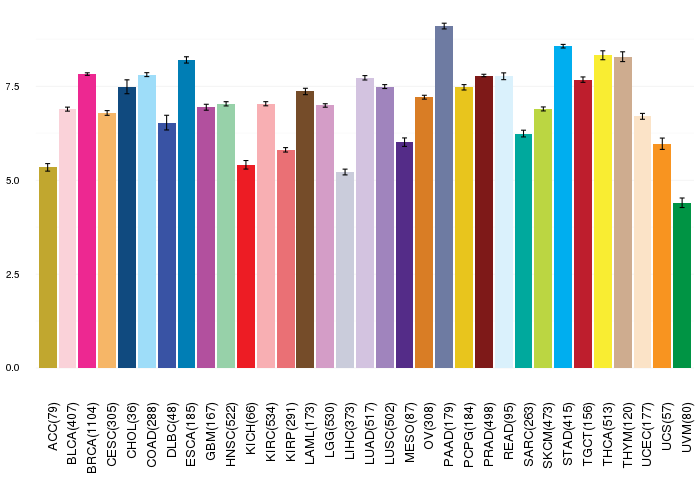
| Gene expressions across 28 cancer types (X-axis: cancer type and Y-axis: log2(norm_counts+1)) (TCGA IlluminaHiSeq_RNASeqV2, pan-cancer normalized log2(norm_counts+1) data, version 2016-08-16) |
 |
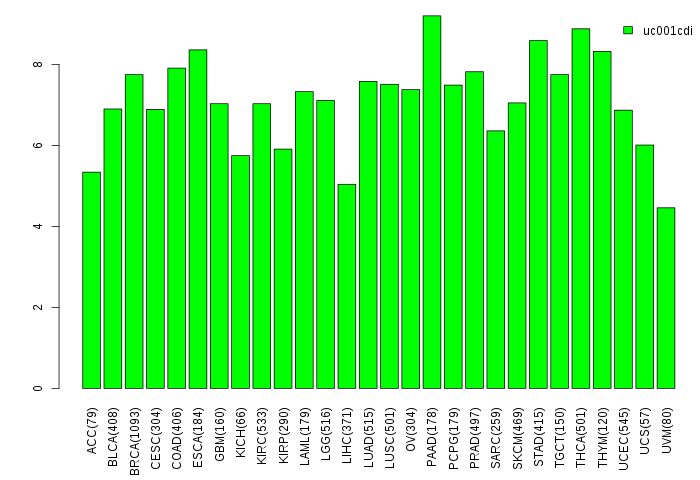
| Gene isoform expressions across 28 cancer types (X-axis: cancer type and Y-axis: log2(norm_counts+1)) (TCGA pan-cancer tcga_rsem_isoform_tpm, version 2016-09-01) |
 |
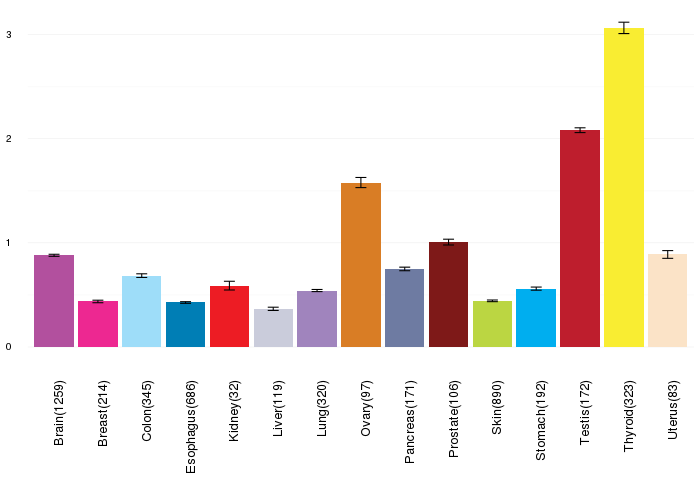
| Gene expressions across normal tissues of GTEx data (GTEx GTEx_Analysis_v6_RNA-seq_RNA-SeQCv1.1.8_gene_rpkm.gct) - Here, we shows the matched tissue types only among our 28 cancer types. |
 |
| Different expressions across 14 cancer types with more than 10 samples between matched tumors and normals (X-axis: cancer type and Y-axis: log2(norm_counts+1)) (TCGA IlluminaHiSeq_RNASeqV2, pan-cancer normalized log2(norm_counts+1) data, version 2016-08-16) |
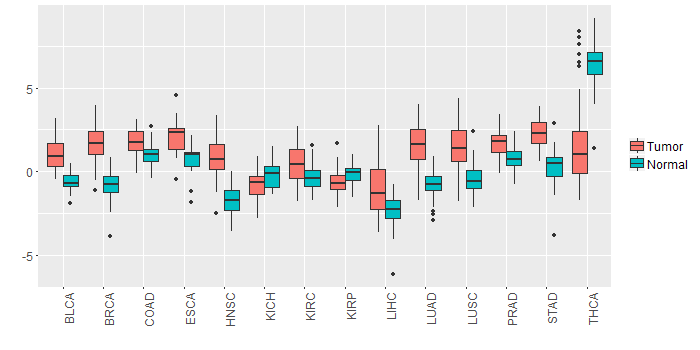 |
| - Significantly differentially expressed cancer types and information. (|Fold change|>1 and FDR<0.05) |
| Cancer type | Mean(exp) in tumor | Mean(exp) in matched normal | Log2FC | P-val. | FDR |
| STAD | 2.22817246 | 0.29696621 | 1.93120625 | 3.46E-10 | 3.24E-08 |
| HNSC | 0.783704 | -1.688865767 | 2.472569767 | 6.02E-18 | 2.26E-15 |
| LUAD | 1.510237761 | -0.811839825 | 2.322077586 | 1.32E-18 | 1.96E-17 |
| BRCA | 1.716699981 | -0.775905282 | 2.492605263 | 2.25E-51 | 1.95E-49 |
| THCA | 1.568129345 | 6.346963243 | -4.778833898 | 3.21E-22 | 1.92E-20 |
| LIHC | -1.02802679 | -2.34300279 | 1.314976 | 3.90E-06 | 1.85E-05 |
| LUSC | 1.447421602 | -0.466150947 | 1.913572549 | 3.10E-13 | 1.52E-12 |
| BLCA | 0.985730683 | -0.657721948 | 1.643452632 | 2.53E-07 | 1.10E-05 |
| Top |
| TissGene-miRNA for BMP8A |
| Significantly anti-correlated miRNAs of TissGene across 28 cancer types (Gene-miRNA relations from TargetScanHuman Relsease 7.1, Conserved_Site_Context_Scores.txt.zip, 06.01.2016) (TCGA IlluminaHiSeq_miRNASeq, log2(RPM+1) data, version 2016-11-21) (TCGA IlluminaHiSeq_RNASeqV2, log2(normalized_count+1) data, version 2016-08-16) (Spearman’s Rank Correlation (p-value<0.05 and coefficient<-0.25)) |
| Cancer type | miRNA id | miRNA accession | P-val. | Coeff. | # samples |
| Top |
| TissGeneMut for BMP8A |
| TissGeneSNV for BMP8A |
| nsSNV counts per each loci. Different colors of circles represent different cancer types. Circle size denotes number of samples. (TCGA somatic mutation (SNPs and small INDELs) data, version 2016-04-25) * Click on the image to enlarge it in a new window. |
 |
 |
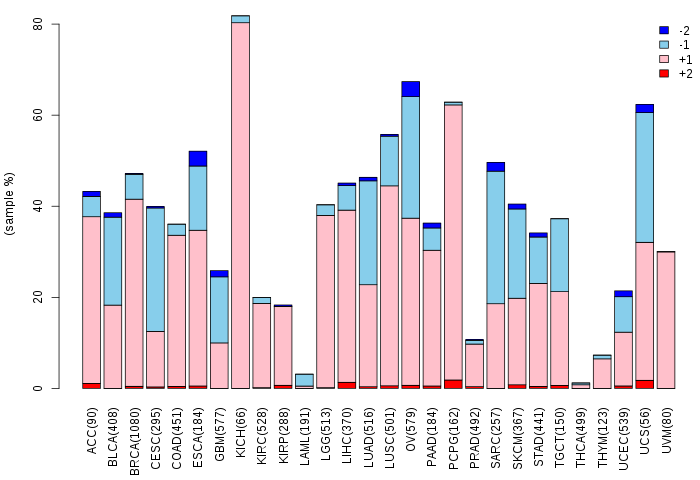
| Somatic nucleotide variants of TissGene across 28 cancer types (X-axis: cancer type and Y-axis: % of mutated samples) The numbers in parentheses are numbers of samples with mutation (nsSNVs). (TCGA somatic mutation (SNPs and small INDELs) data, version 2016-04-25) |
 |
| - nsSNVs sorted by frequency. |
| AAchange | Cancer type | # samples |
| p.G400S | COAD | 1 |
| p.M106I | LUAD | 1 |
| p.G297D | HNSC | 1 |
| p.D312N | SKCM | 1 |
| p.R293H | COAD | 1 |
| p.D339N | SKCM | 1 |
| p.F180L | UCEC | 1 |
| p.A361T | UCEC | 1 |
| p.G294S | STAD | 1 |
| p.M357T | LUAD | 1 |
| p.E278K | SKCM | 1 |
| p.R392H | UCEC | 1 |
| p.A361T | COAD | 1 |
| p.Y307F | SARC | 1 |
| p.R293H | CESC | 1 |
| p.C366S | COAD | 1 |
| Top |
| TissGeneCNV for BMP8A |
| Copy number variations of TissGene across 28 cancer types (X-axis: cancer type and Y-axis: % of CNV samples) (TCGA Gistic2_CopyNumber_Gistic2_all_data_by_genes, Gistic2 copy number data, version 2016-08-16) |
 |
| Top |
| TissGeneFusions for BMP8A |
| Fusion genes including TissGene (ChimerDB 3.0, 2016-12-01 and TCGA fusion Portal 2015-12-01) |
| Database | Src | Cancer type | Sample | Fusion gene | ORF | 5'-gene BP | 3'-gene BP |
| Chimerdb3.0 | ChiTaRs | NA | AW836221 | BMP8A-PPIEL | chr1:39992694 | chr1:40007763 | |
| Chimerdb3.0 | ChiTaRs | NA | AW836213 | BMP8A-PPIEL | chr1:39992707 | chr1:40007763 |
| Top |
| TissGeneNet for BMP8A |
| Co-expressed gene networks based on protein-protein interaction data (CePIN) (TCGA IlluminaHiSeq_RNASeqV2, pan-cancer normalized log2(norm_counts+1) data, version 2016-08-16) (PINA2 ppi data) |
| Top |
| TissGeneProg for BMP8A |
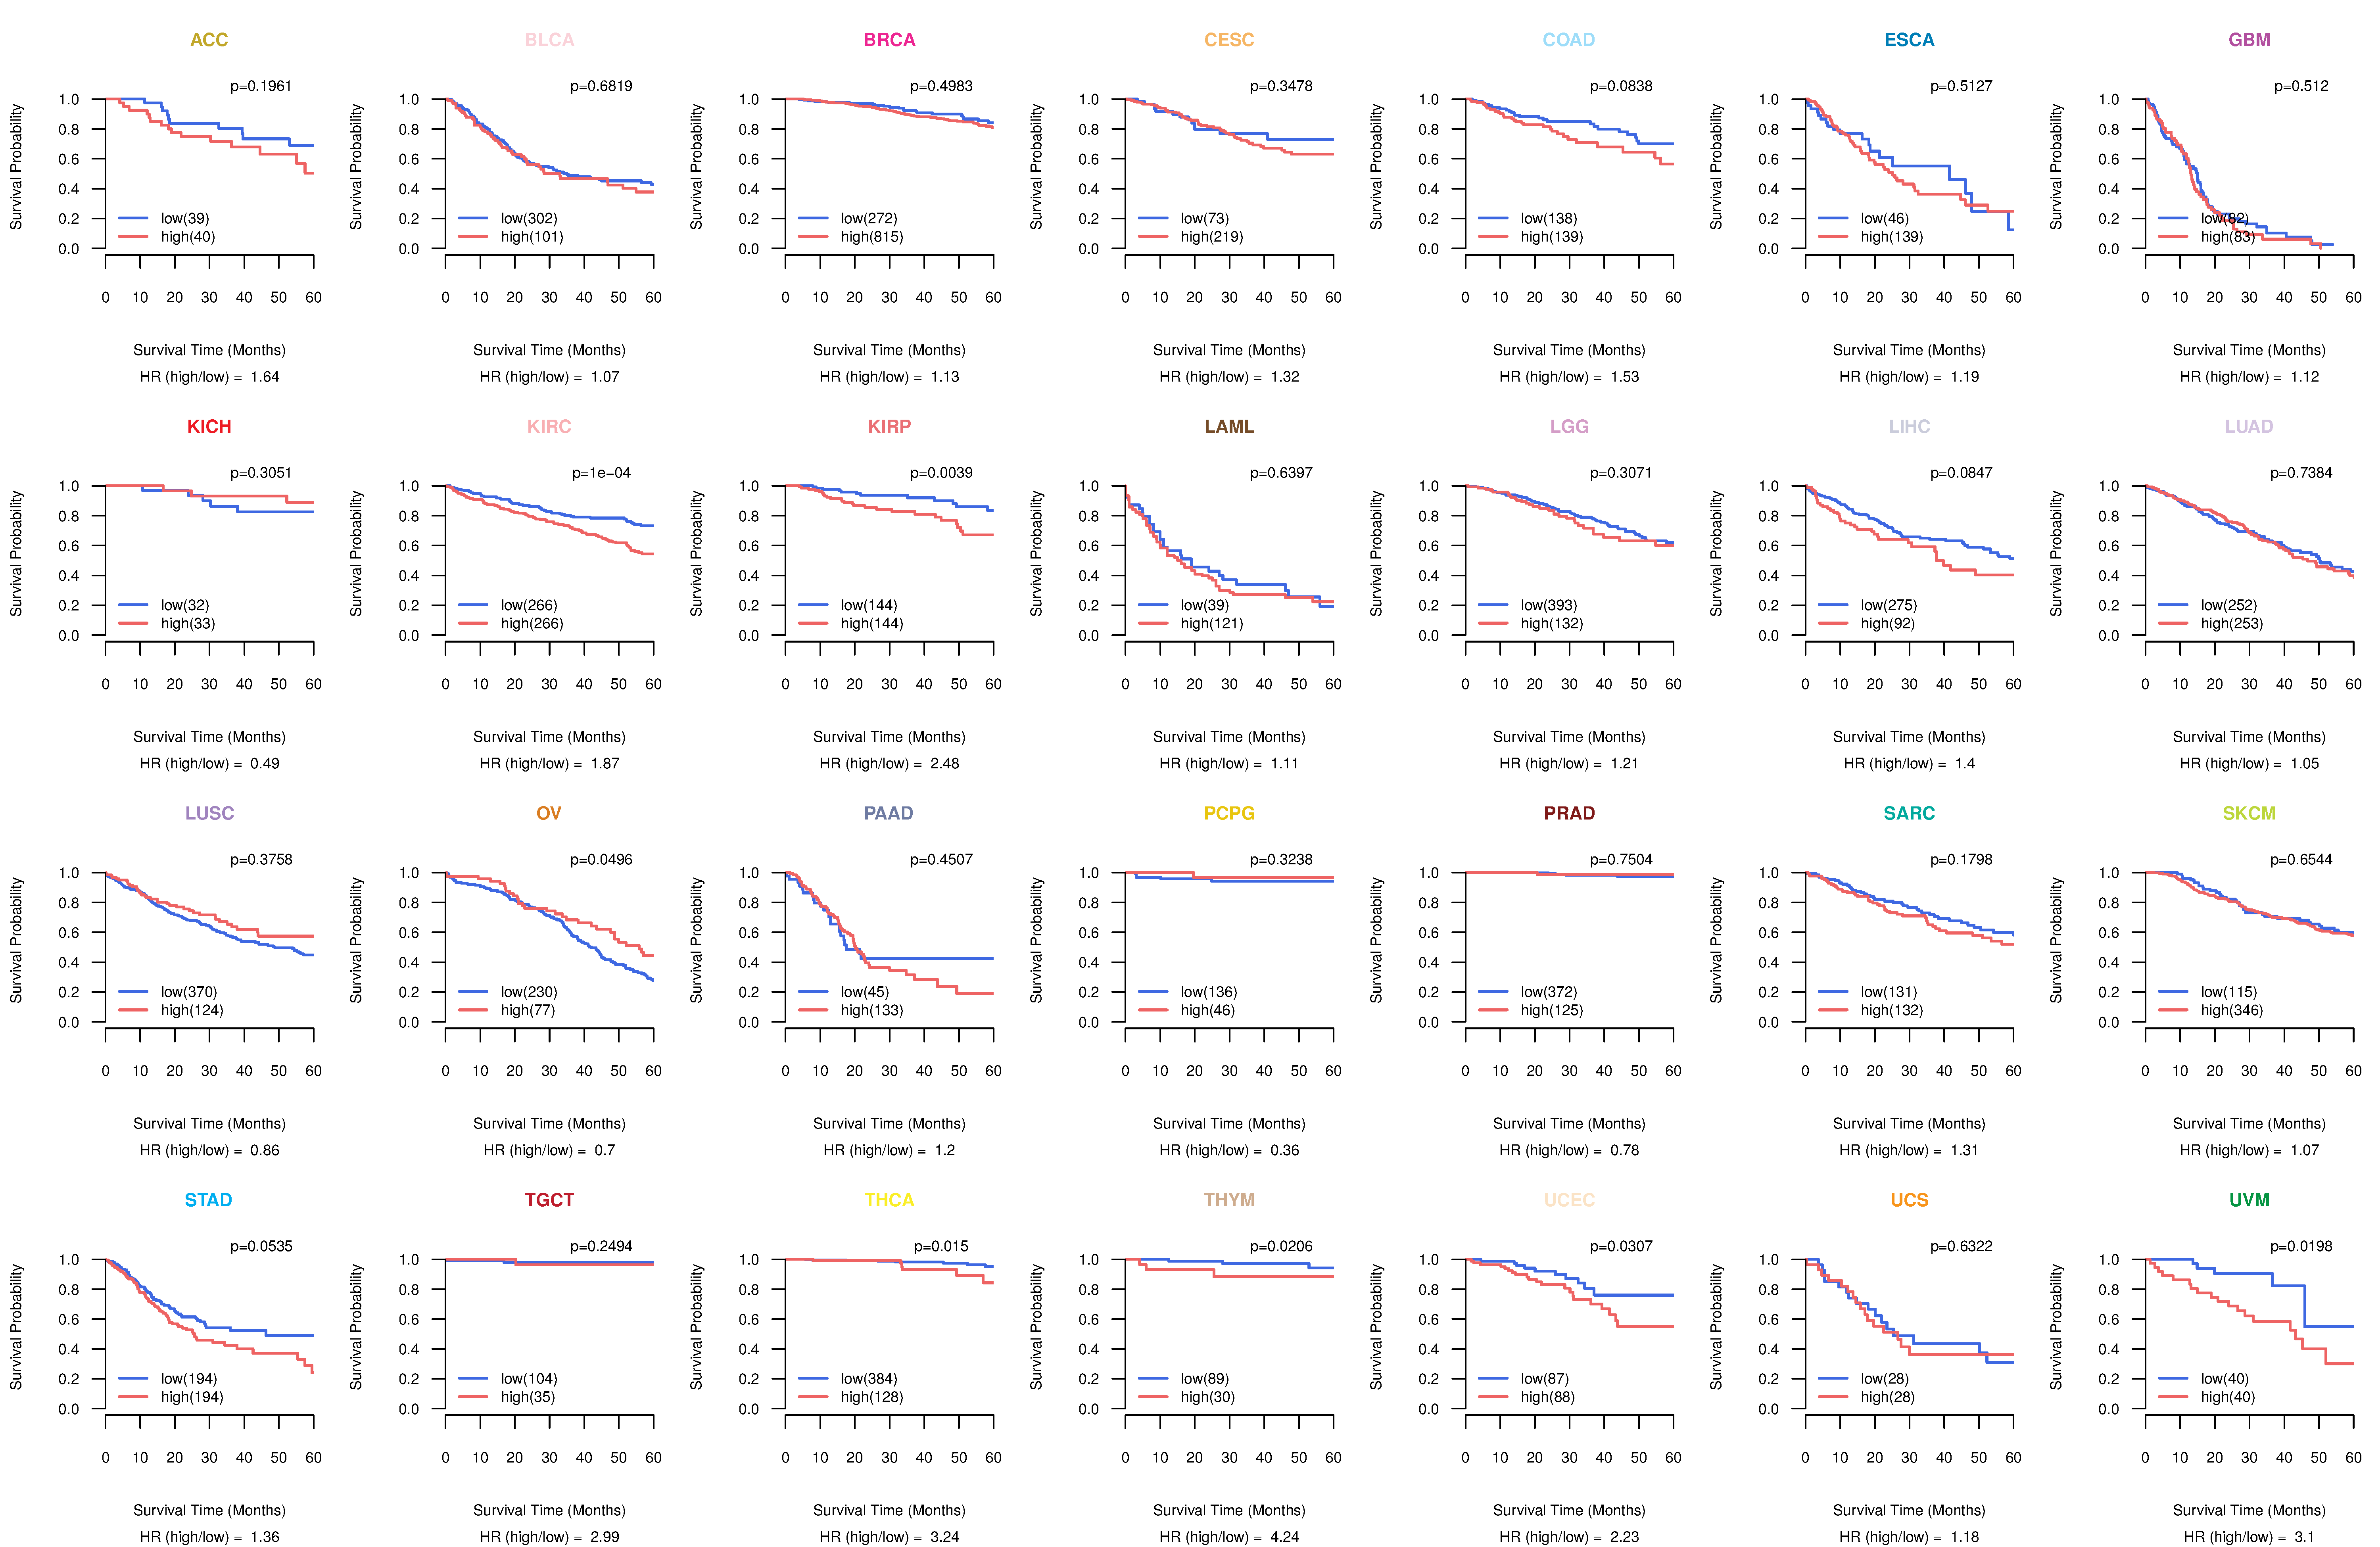
| Kaplan-Meier plots with logrank tests of overall survival (OS) using 28 cancer types (TCGA IlluminaHiSeq_RNASeqV2, pan-cancer normalized log2(norm_counts+1) data, version 2016-08-16) (TCGA clinicalMatrix, phenotype data, version 2016-04-27) * Click on the image to enlarge it in a new window. |
 |
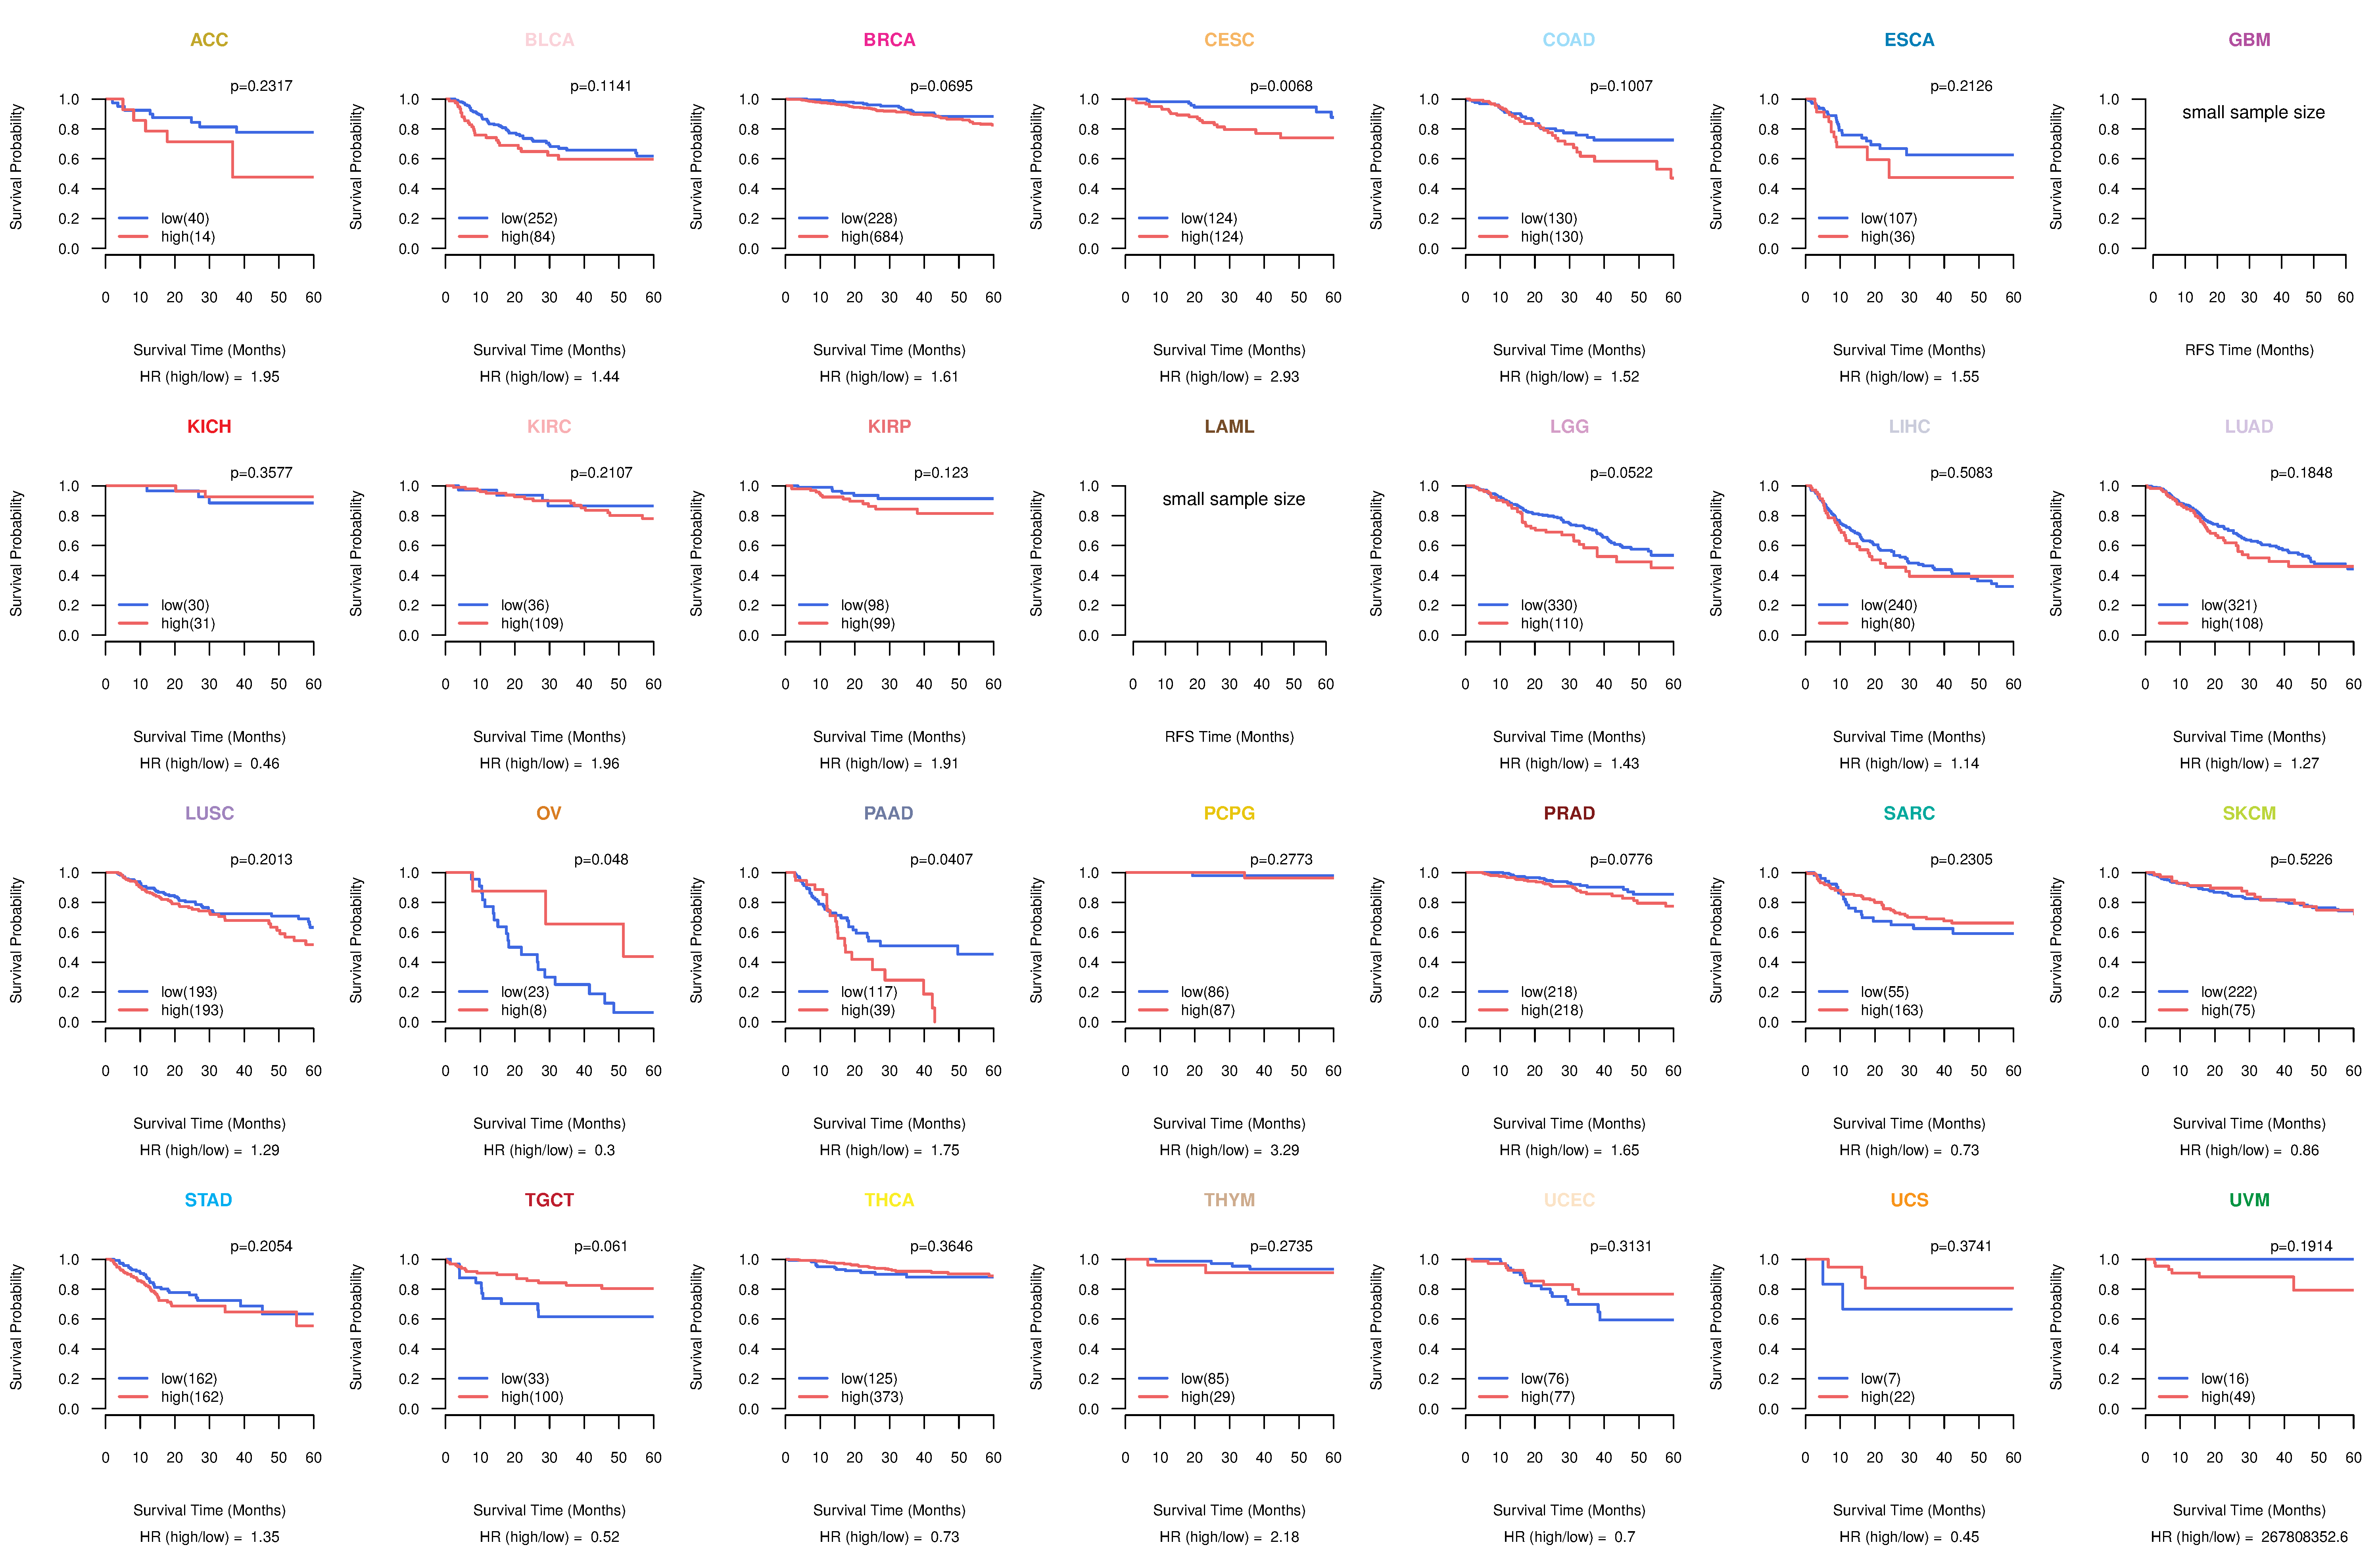
| Kaplan-Meier plots with logrank test of relapse free survival (RFS) using 28 cancer types (TCGA IlluminaHiSeq_RNASeqV2, pan-cancer normalized log2(norm_counts+1) data, version 2016-08-16) (TCGA clinicalMatrix, phenotype data, version 2016-04-27) * Click on the image enlarge it in a new window. |
 |
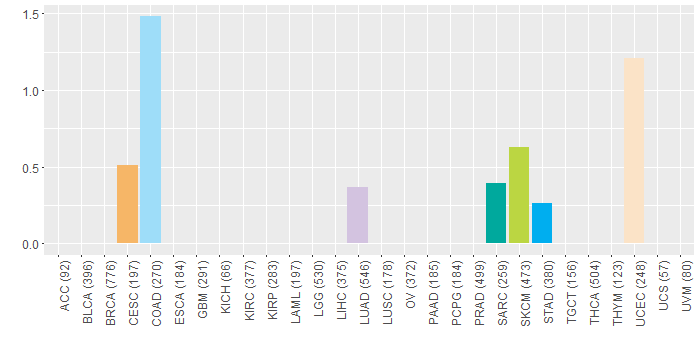
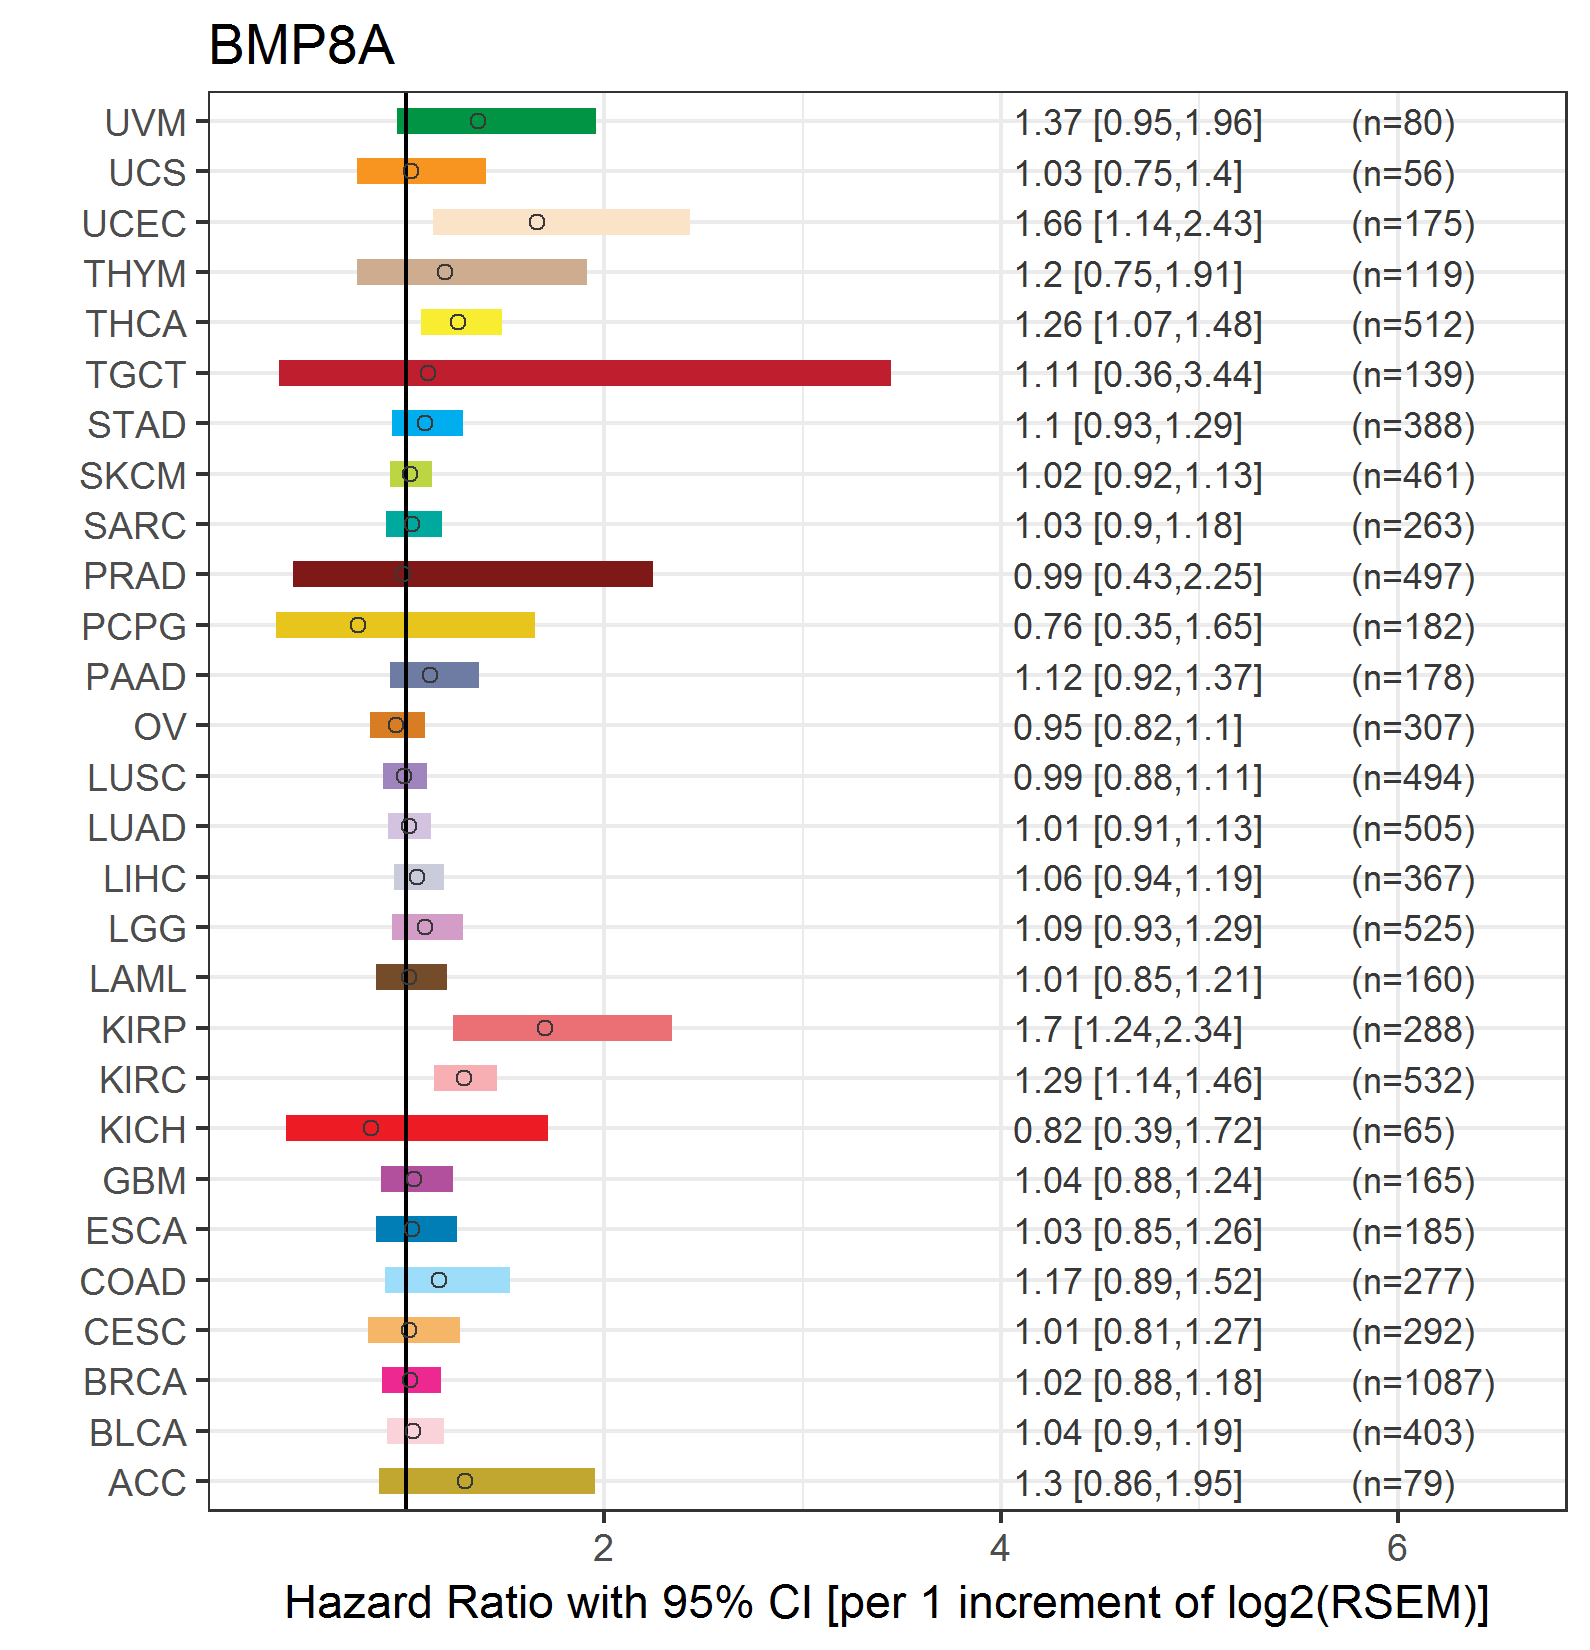
| Forest plot of Cox proportional hazard ratio (HR) and 95% CI of overall survival (OS) using 28 cancer types (TCGA IlluminaHiSeq_RNASeqV2, pan-cancer normalized log2(norm_counts+1) data, version 2016-08-16) (TCGA clinicalMatrix, phenotype data, version 2016-04-27) * Click on the image enlarge it in a new window. |
 |
| Forest plot of Cox proportional hazard ratio (HR) and 95% CI of relapse free survival (RFS) using 28 cancer types (TCGA IlluminaHiSeq_RNASeqV2, pan-cancer normalized log2(norm_counts+1) data, version 2016-08-16) (TCGA clinicalMatrix, phenotype data, version 2016-04-27) * Click on the image enlarge it in a new window. |
 |
| Top |
| TissGeneClin for BMP8A |
| TissGeneDrug for BMP8A |
| Drug information targeting TissGene (DrugBank Version 5.0.6, 2017-04-01) |
| DrugBank ID | Drug name | Drug activity | Drug type | Drug status |
| Top |
| TissGeneDisease for BMP8A |
| Disease information associated with TissGene (DisGeNet, 2016-06-01) |
| Disease ID | Disease name | # pubmeds | Source |
| umls:C0020503 | Hyperparathyroidism, Secondary | 1 | GAD |
|
Copyright 2016-Present - The University of Texas Health Science Center at Houston (UTHealth) Web File Viewing | How to Report, Fraud, Waste and Abuse | State of Texas | Statewide Search | Texas Homeland Security | Site Policies |