 |
| |
| |
| |
| |
| |
| |
|

| TissGeneSummary for IMPA1 |
 Gene summary Gene summary |
| Basic gene information | Gene symbol | IMPA1 |
| Gene name | inositol(myo)-1(or 4)-monophosphatase 1 | |
| Synonyms | IMP|IMPA | |
| Cytomap | UCSC genome browser: 8q21.13-q21.3 | |
| Type of gene | protein-coding | |
| RefGenes | NM_001144878.1, NM_001144879.1,NM_005536.3, | |
| Description | D-galactose 1-phosphate phosphataseIMP 1IMPase 1inositol monophosphatase 1inositol-1(or 4)-monophosphatase 1lithium-sensitive myo-inositol monophosphatase A1 | |
| Modification date | 20141209 | |
| dbXrefs | MIM : 602064 | |
| HGNC : HGNC | ||
| HPRD : 03641 | ||
| Protein | UniProt: go to UniProt's Cross Reference DB Table | |
| Expression | CleanEX: HS_IMPA1 | |
| BioGPS: 3612 | ||
| Pathway | NCI Pathway Interaction Database: IMPA1 | |
| KEGG: IMPA1 | ||
| REACTOME: IMPA1 | ||
| Pathway Commons: IMPA1 | ||
| Context | iHOP: IMPA1 | |
| ligand binding site mutation search in PubMed: IMPA1 | ||
| UCL Cancer Institute: IMPA1 | ||
| Assigned class in TissGDB* | C | |
| Included tissue-specific gene expression resources | TiGER,GTEx | |
| Specific-tissues in normal samples (assigned by TissGDB using HPA, TiGER, and GTEx) | BladderBone marrowTestis | |
| Cancer types related to the specific-tissues in cancer samples (assigned by TissGDB using TCGA) | BLCALAMLTGCT | |
| Reference showing the relevant tissue of IMPA1 | ||
| Description by TissGene annotations | TissgsLTS | |
| * Class A consists of genes with literature evidence and is part of the cTissGenes. Class B consists of only cTissGenes without additional evidence. The remaining genes belong to Class C. |
| Gene ontology having evidence of Inferred from Direct Assay (IDA) from Entrez |
| GO ID | GO term | PubMed ID | GO:0046855 | inositol phosphate dephosphorylation | 17068342 | GO:0046855 | inositol phosphate dephosphorylation | 17068342 |
| Top |
| TissGeneExp for IMPA1 |
| Gene expressions across 28 cancer types (X-axis: cancer type and Y-axis: log2(norm_counts+1)) (TCGA IlluminaHiSeq_RNASeqV2, pan-cancer normalized log2(norm_counts+1) data, version 2016-08-16) |
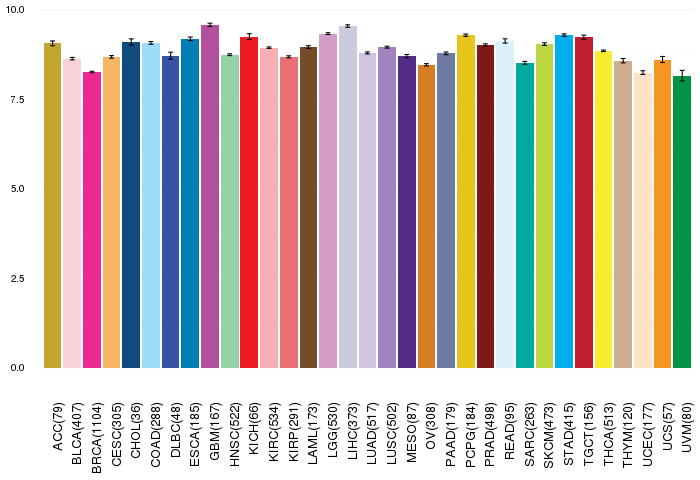 |
| Gene isoform expressions across 28 cancer types (X-axis: cancer type and Y-axis: log2(norm_counts+1)) (TCGA pan-cancer tcga_rsem_isoform_tpm, version 2016-09-01) |
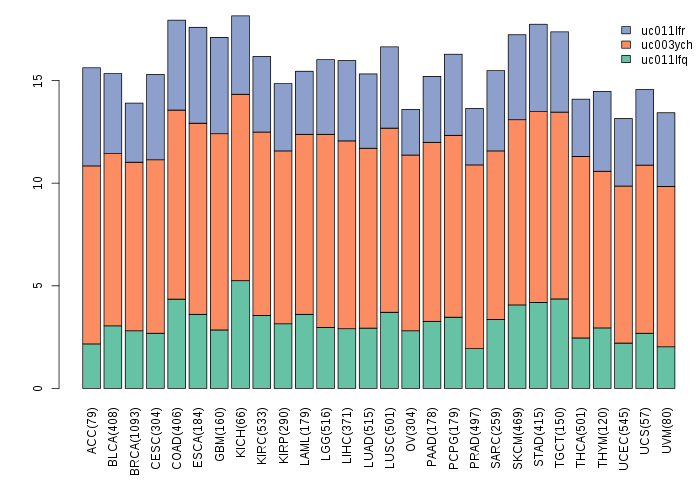 |
| Gene expressions across normal tissues of GTEx data (GTEx GTEx_Analysis_v6_RNA-seq_RNA-SeQCv1.1.8_gene_rpkm.gct) - Here, we shows the matched tissue types only among our 28 cancer types. |
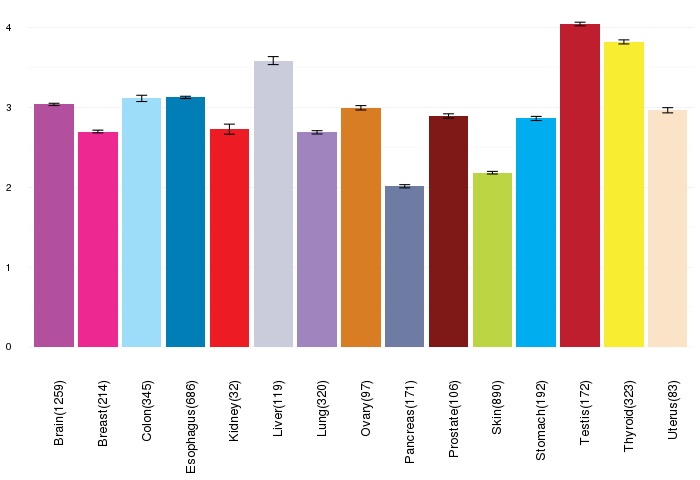 |
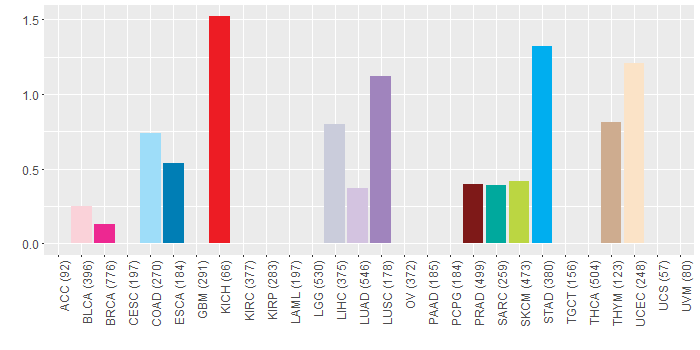
| Different expressions across 14 cancer types with more than 10 samples between matched tumors and normals (X-axis: cancer type and Y-axis: log2(norm_counts+1)) (TCGA IlluminaHiSeq_RNASeqV2, pan-cancer normalized log2(norm_counts+1) data, version 2016-08-16) |
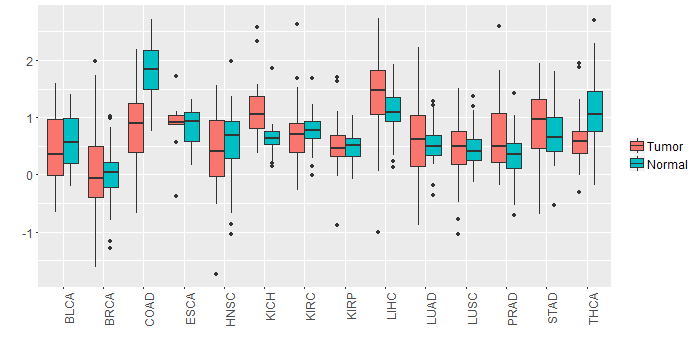 |
| - Significantly differentially expressed cancer types and information. (|Fold change|>1 and FDR<0.05) |
| Cancer type | Mean(exp) in tumor | Mean(exp) in matched normal | Log2FC | P-val. | FDR |
| Top |
| TissGene-miRNA for IMPA1 |
| Significantly anti-correlated miRNAs of TissGene across 28 cancer types (Gene-miRNA relations from TargetScanHuman Relsease 7.1, Conserved_Site_Context_Scores.txt.zip, 06.01.2016) (TCGA IlluminaHiSeq_miRNASeq, log2(RPM+1) data, version 2016-11-21) (TCGA IlluminaHiSeq_RNASeqV2, log2(normalized_count+1) data, version 2016-08-16) (Spearman’s Rank Correlation (p-value<0.05 and coefficient<-0.25)) |
| Cancer type | miRNA id | miRNA accession | P-val. | Coeff. | # samples |
| LUAD | hsa-miR-365b-3p | MIMAT0022834 | 0.029 | -0.28 | 60 |
| LUAD | hsa-miR-365a-3p | MIMAT0000710 | 0.028 | -0.29 | 60 |
| Top |
| TissGeneMut for IMPA1 |
| TissGeneSNV for IMPA1 |
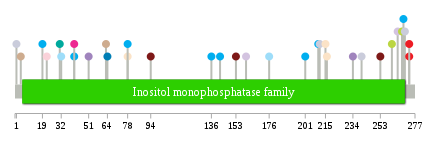
| nsSNV counts per each loci. Different colors of circles represent different cancer types. Circle size denotes number of samples. (TCGA somatic mutation (SNPs and small INDELs) data, version 2016-04-25) * Click on the image to enlarge it in a new window. |
 |
 |
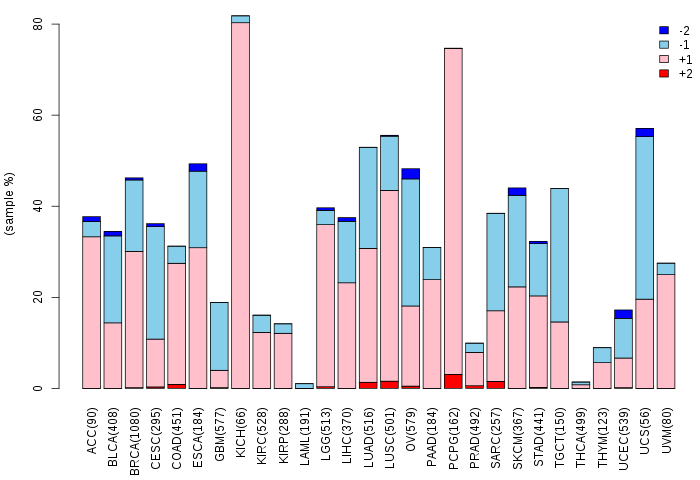
| Somatic nucleotide variants of TissGene across 28 cancer types (X-axis: cancer type and Y-axis: % of mutated samples) The numbers in parentheses are numbers of samples with mutation (nsSNVs). (TCGA somatic mutation (SNPs and small INDELs) data, version 2016-04-25) |
 |
| - nsSNVs sorted by frequency. |
| AAchange | Cancer type | # samples |
| p.Y211C | LIHC | 1 |
| p.R273X | KICH | 1 |
| p.K240Q | LIHC | 1 |
| p.G153E | PRAD | 1 |
| p.E51Q | LUSC | 1 |
| p.A210V | STAD | 1 |
| p.K28Q | READ | 1 |
| p.S216Y | UCEC | 1 |
| p.N201D | STAD | 1 |
| p.E136G | STAD | 1 |
| p.A269V | STAD | 1 |
| p.R261K | SKCM | 1 |
| p.G94E | PRAD | 1 |
| p.A31D | SARC | 1 |
| p.A78T | STAD | 1 |
| p.A253T | PRAD | 1 |
| p.A78D | UCEC | 1 |
| p.A19T | STAD | 1 |
| p.P4A | THYM | 1 |
| p.N32Y | COAD | 1 |
| p.R273* | KICH | 1 |
| p.L176I | COAD | 1 |
| p.N142D | STAD | 1 |
| p.M1I | LIHC | 1 |
| p.V268G | SKCM | 1 |
| p.V22L | BLCA | 1 |
| p.P63A | THYM | 1 |
| p.Y270C | LIHC | 1 |
| p.K215T | UCEC | 1 |
| p.W64L | ESCA | 1 |
| p.D41Y | STAD | 1 |
| p.V113E | CHOL | 1 |
| p.V234M | LUSC | 1 |
| p.V172E | CHOL | 1 |
| p.S41T | BRCA | 1 |
| p.Q160L | LUAD | 1 |
| p.H100R | HNSC | 1 |
| p.E265Q | LUAD | 1 |
| Top |
| TissGeneCNV for IMPA1 |
| Copy number variations of TissGene across 28 cancer types (X-axis: cancer type and Y-axis: % of CNV samples) (TCGA Gistic2_CopyNumber_Gistic2_all_data_by_genes, Gistic2 copy number data, version 2016-08-16) |
 |
| Top |
| TissGeneFusions for IMPA1 |
| Fusion genes including TissGene (ChimerDB 3.0, 2016-12-01 and TCGA fusion Portal 2015-12-01) |
| Database | Src | Cancer type | Sample | Fusion gene | ORF | 5'-gene BP | 3'-gene BP |
| TCGAfusionPortal | PRADA | SKCM | TCGA-ER-A19T-01A | ZNF704-IMPA1 | Out-of-frame | Chr8:81599461 | Chr8:82583282 |
| Top |
| TissGeneNet for IMPA1 |
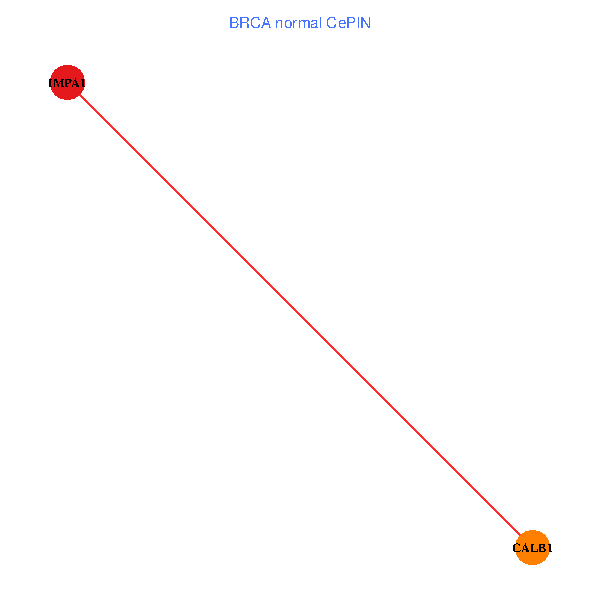
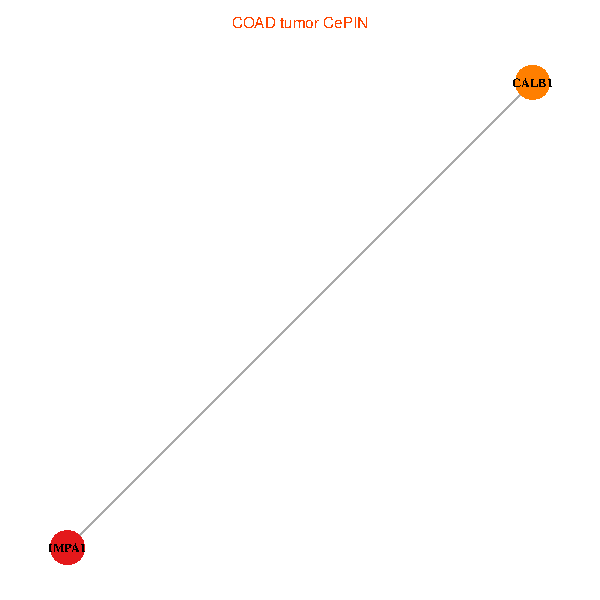
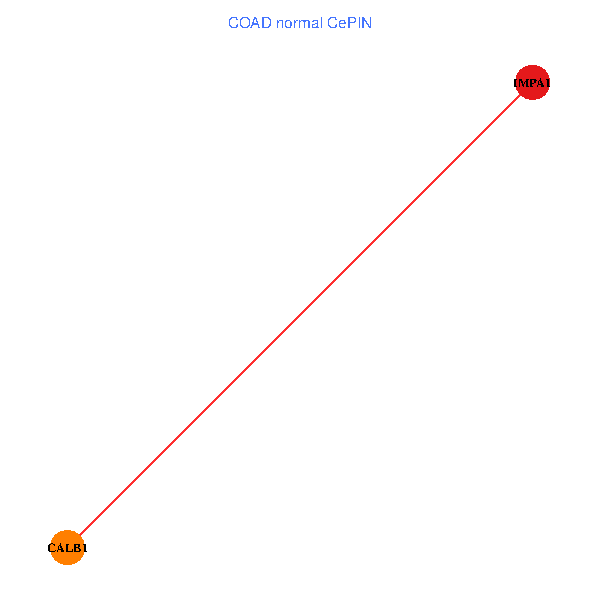
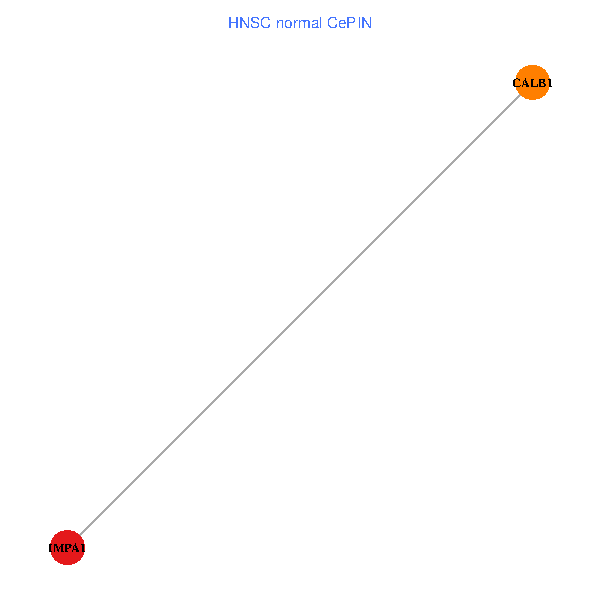
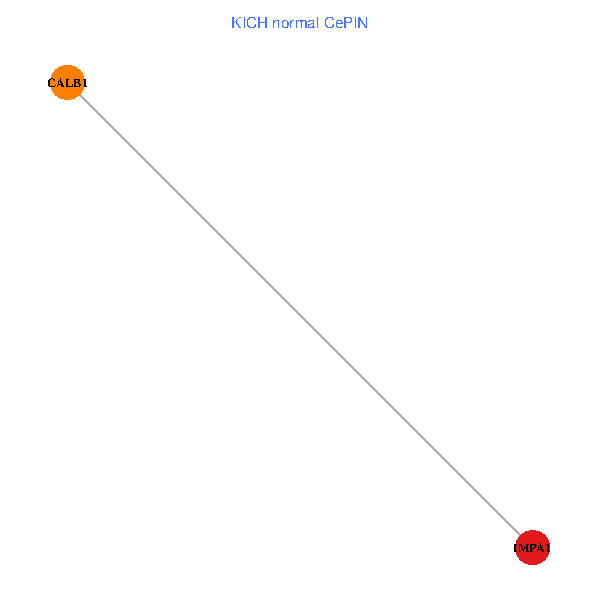
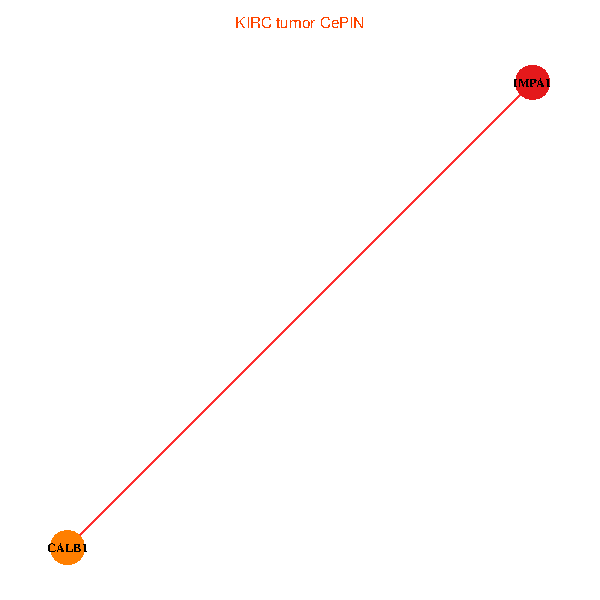
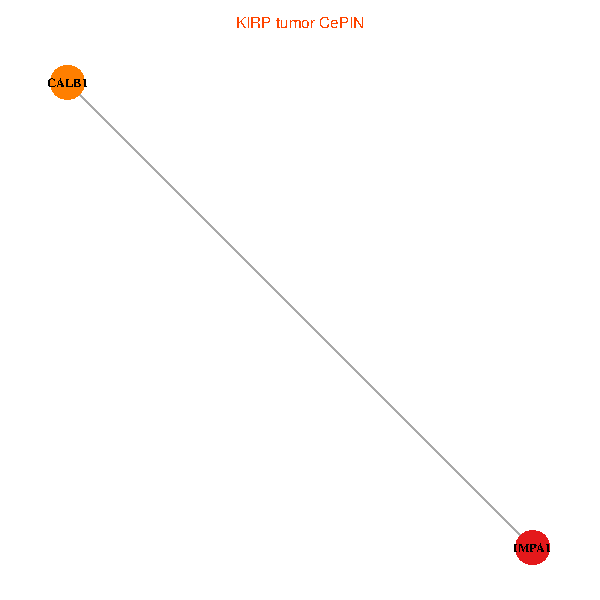
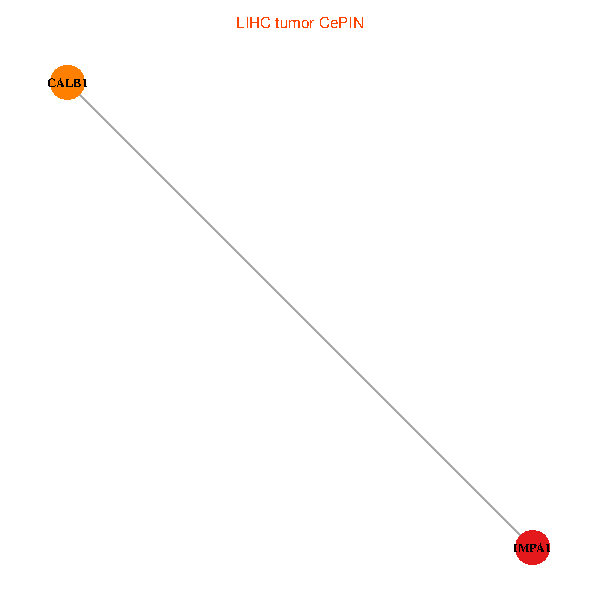
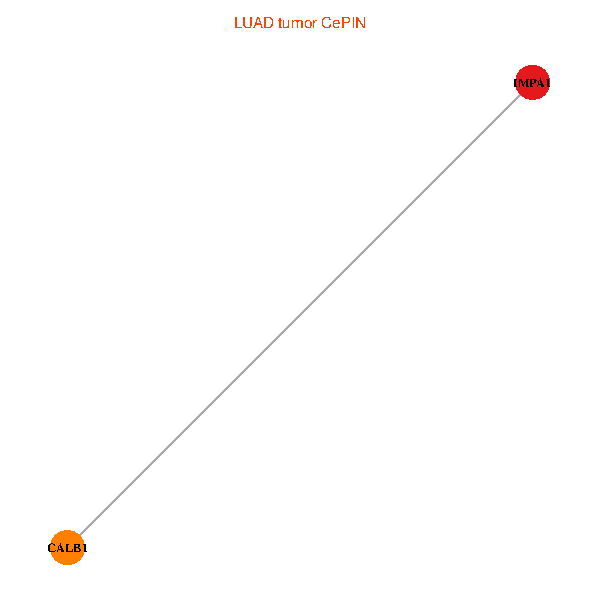
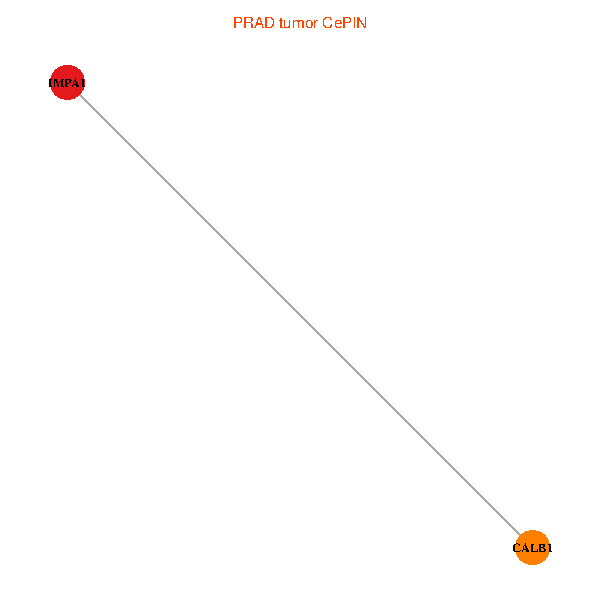
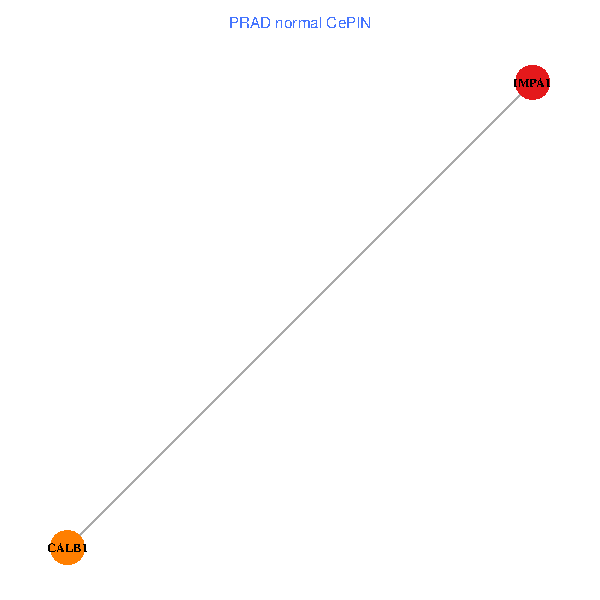
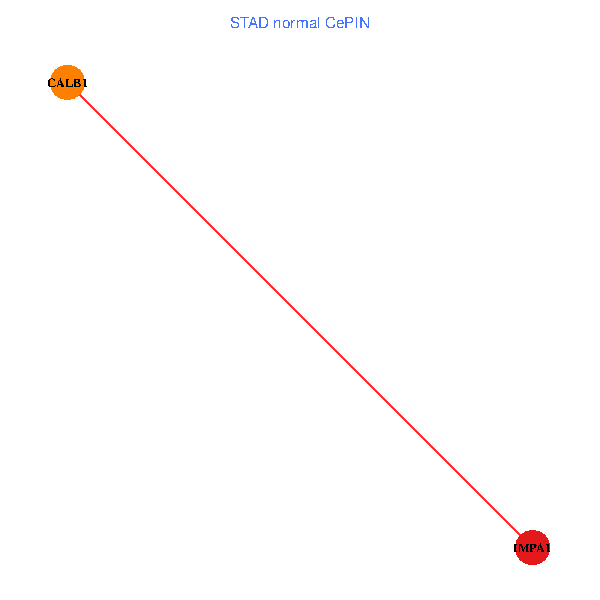
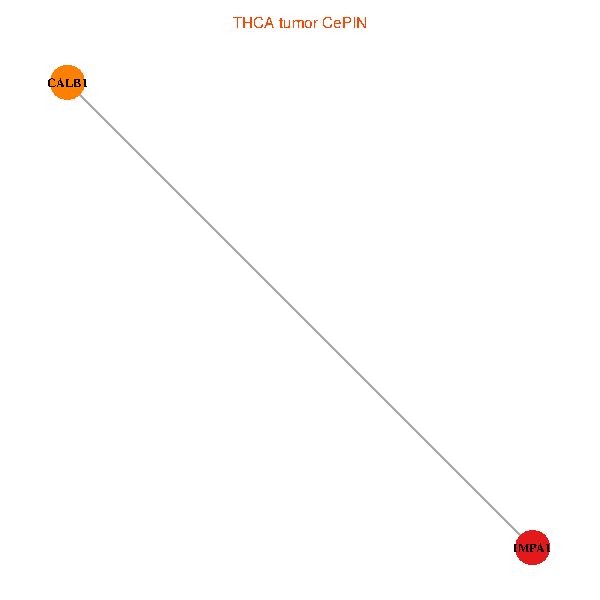
| Co-expressed gene networks based on protein-protein interaction data (CePIN) (TCGA IlluminaHiSeq_RNASeqV2, pan-cancer normalized log2(norm_counts+1) data, version 2016-08-16) (PINA2 ppi data) |
| BRCA (tumor) | BRCA (normal) |
| IMPA1, CALB1 (tumor) | IMPA1, CALB1 (normal) |
 |  |
| COAD (tumor) | COAD (normal) |
| IMPA1, CALB1 (tumor) | IMPA1, CALB1 (normal) |
 |  |
| HNSC (tumor) | HNSC (normal) |
| IMPA1, CALB1 (tumor) | IMPA1, CALB1 (normal) |
 |  |
| KICH (tumor) | KICH (normal) |
| IMPA1, CALB1 (tumor) | IMPA1, CALB1 (normal) |
 |  |
| KIRC (tumor) | KIRC (normal) |
| IMPA1, CALB1 (tumor) | IMPA1, CALB1 (normal) |
 |  |
| KIRP (tumor) | KIRP (normal) |
| IMPA1, CALB1 (tumor) | IMPA1, CALB1 (normal) |
 |  |
| LIHC (tumor) | LIHC (normal) |
| IMPA1, CALB1 (tumor) | IMPA1, CALB1 (normal) |
 |  |
| LUAD (tumor) | LUAD (normal) |
| IMPA1, CALB1 (tumor) | IMPA1, CALB1 (normal) |
 |  |
| LUSC (tumor) | LUSC (normal) |
| IMPA1, CALB1 (tumor) | IMPA1, CALB1 (normal) |
 |  |
| PRAD (tumor) | PRAD (normal) |
| IMPA1, CALB1 (tumor) | IMPA1, CALB1 (normal) |
 |  |
| STAD (tumor) | STAD (normal) |
| IMPA1, CALB1 (tumor) | IMPA1, CALB1 (normal) |
 |  |
| THCA (tumor) | THCA (normal) |
| IMPA1, CALB1 (tumor) | IMPA1, CALB1 (normal) |
 |  |
| Top |
| TissGeneProg for IMPA1 |
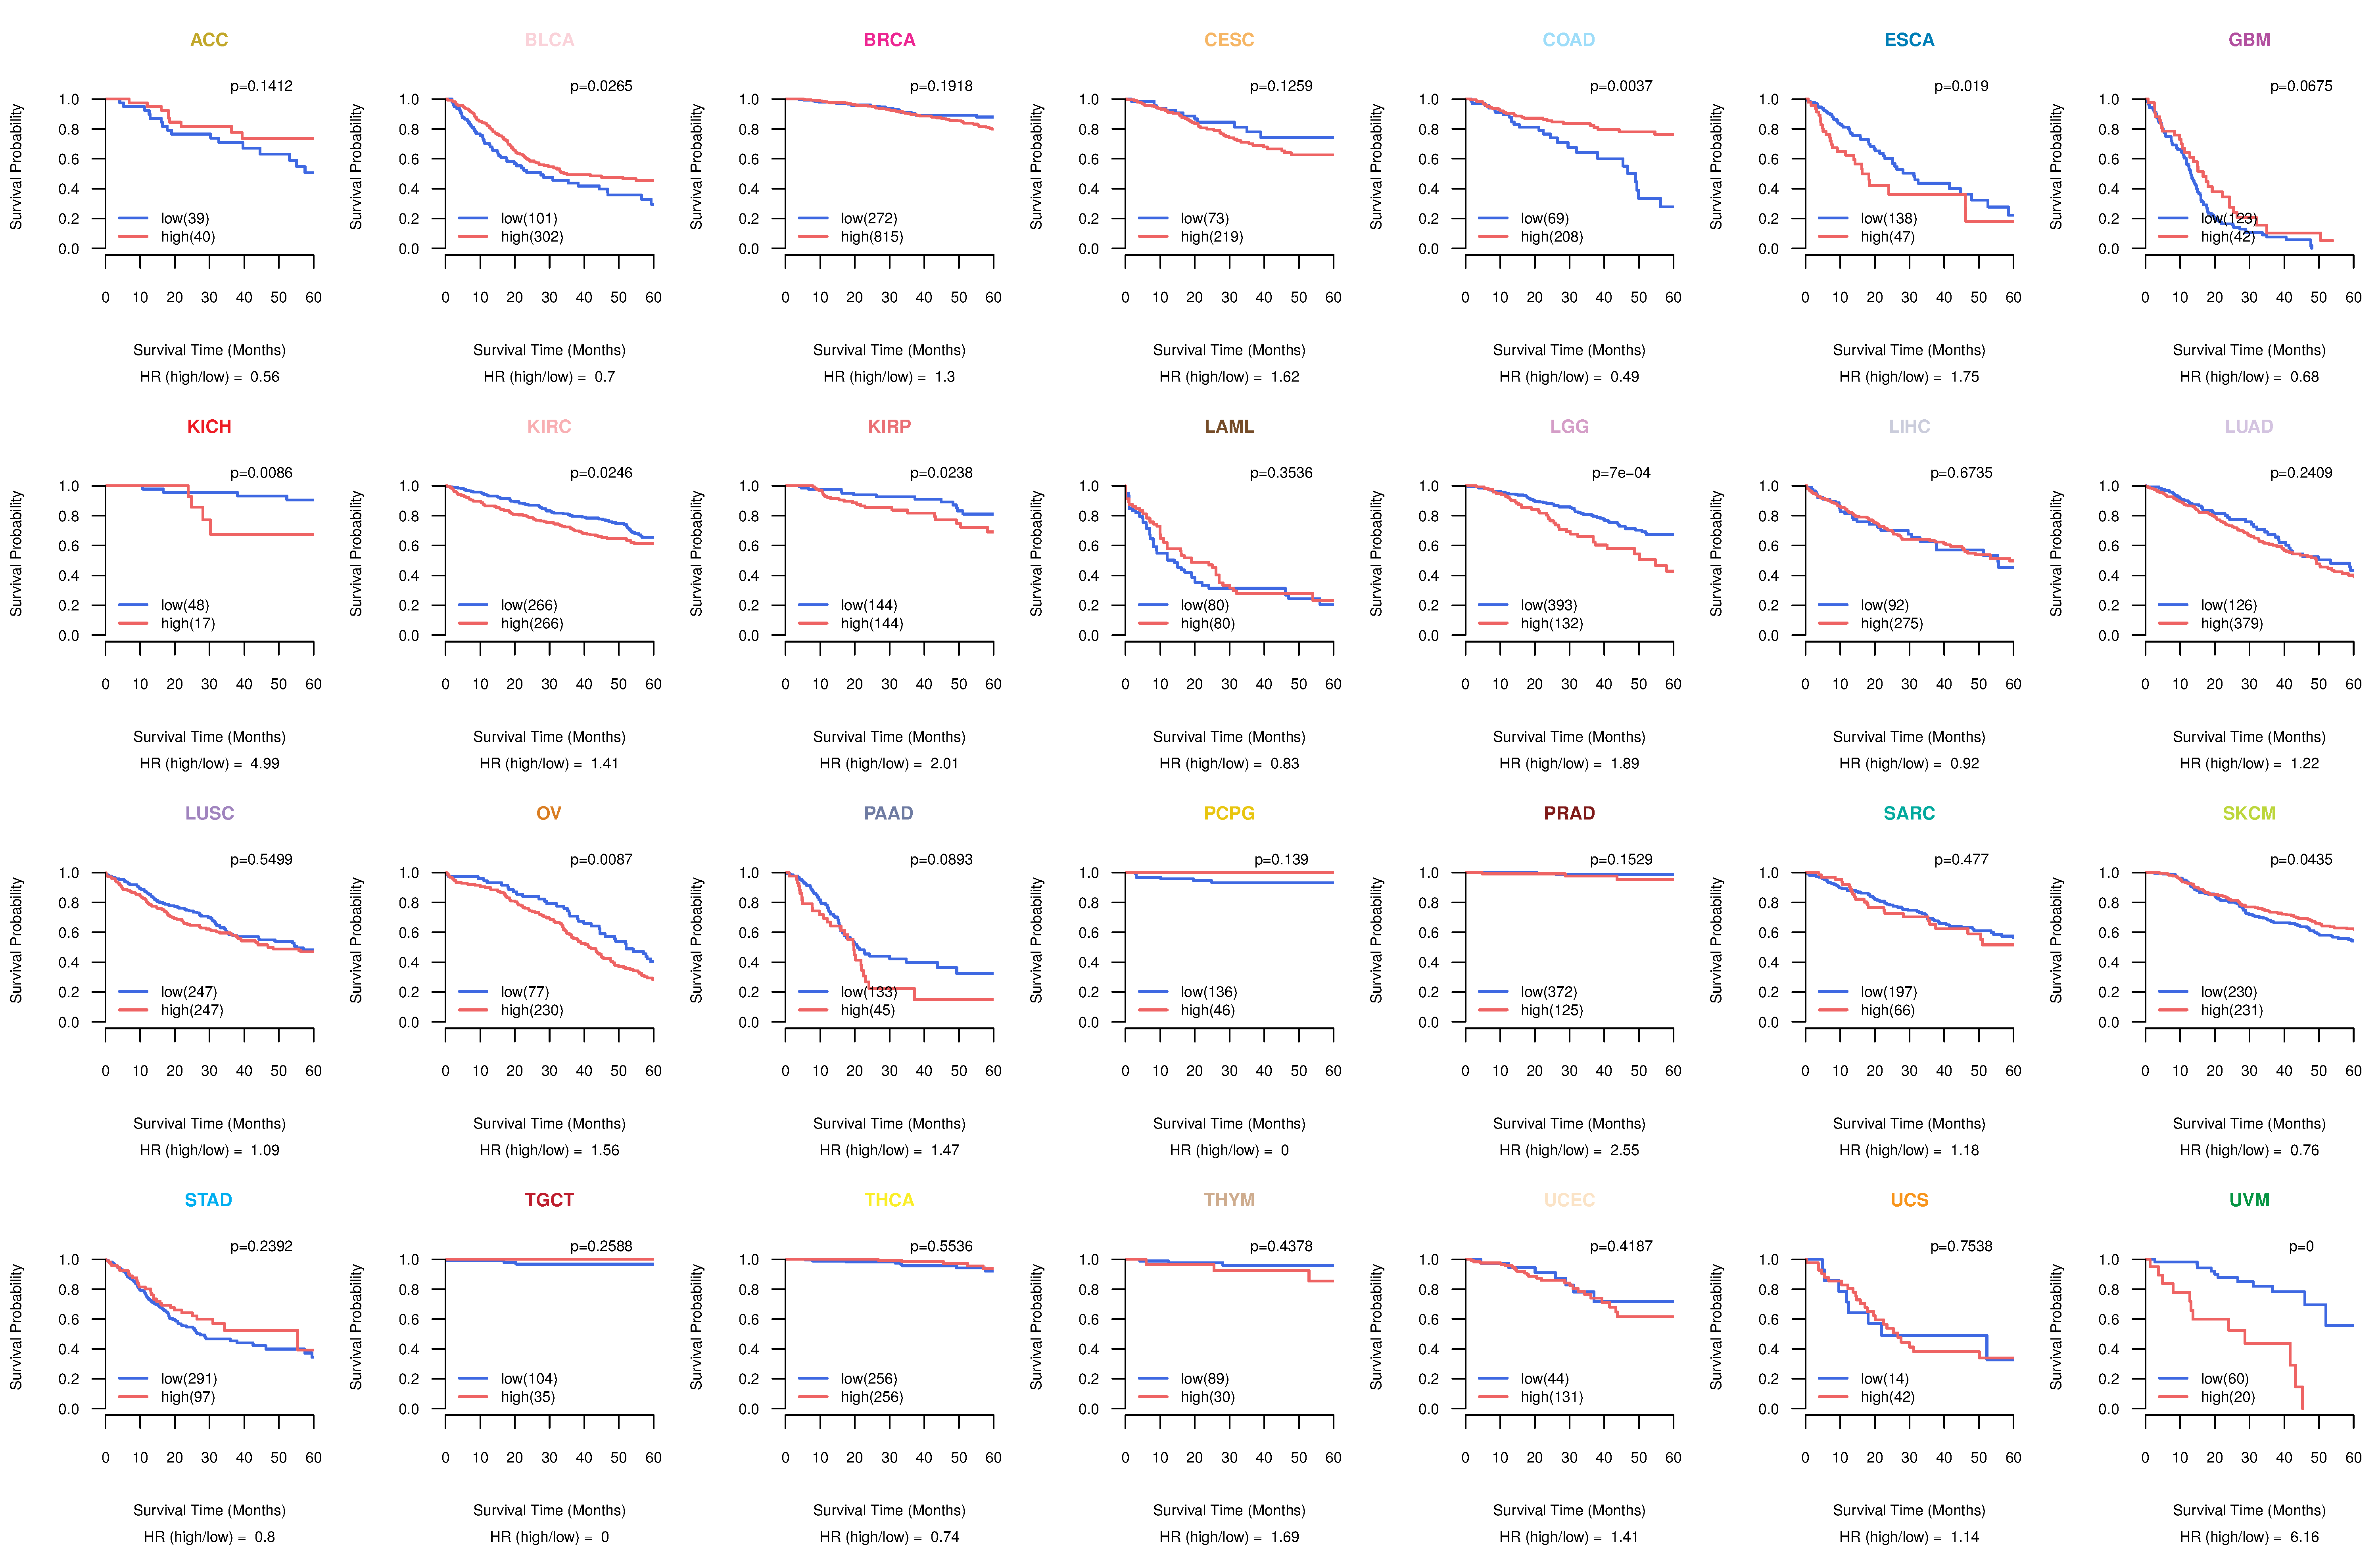
| Kaplan-Meier plots with logrank tests of overall survival (OS) using 28 cancer types (TCGA IlluminaHiSeq_RNASeqV2, pan-cancer normalized log2(norm_counts+1) data, version 2016-08-16) (TCGA clinicalMatrix, phenotype data, version 2016-04-27) * Click on the image to enlarge it in a new window. |
 |
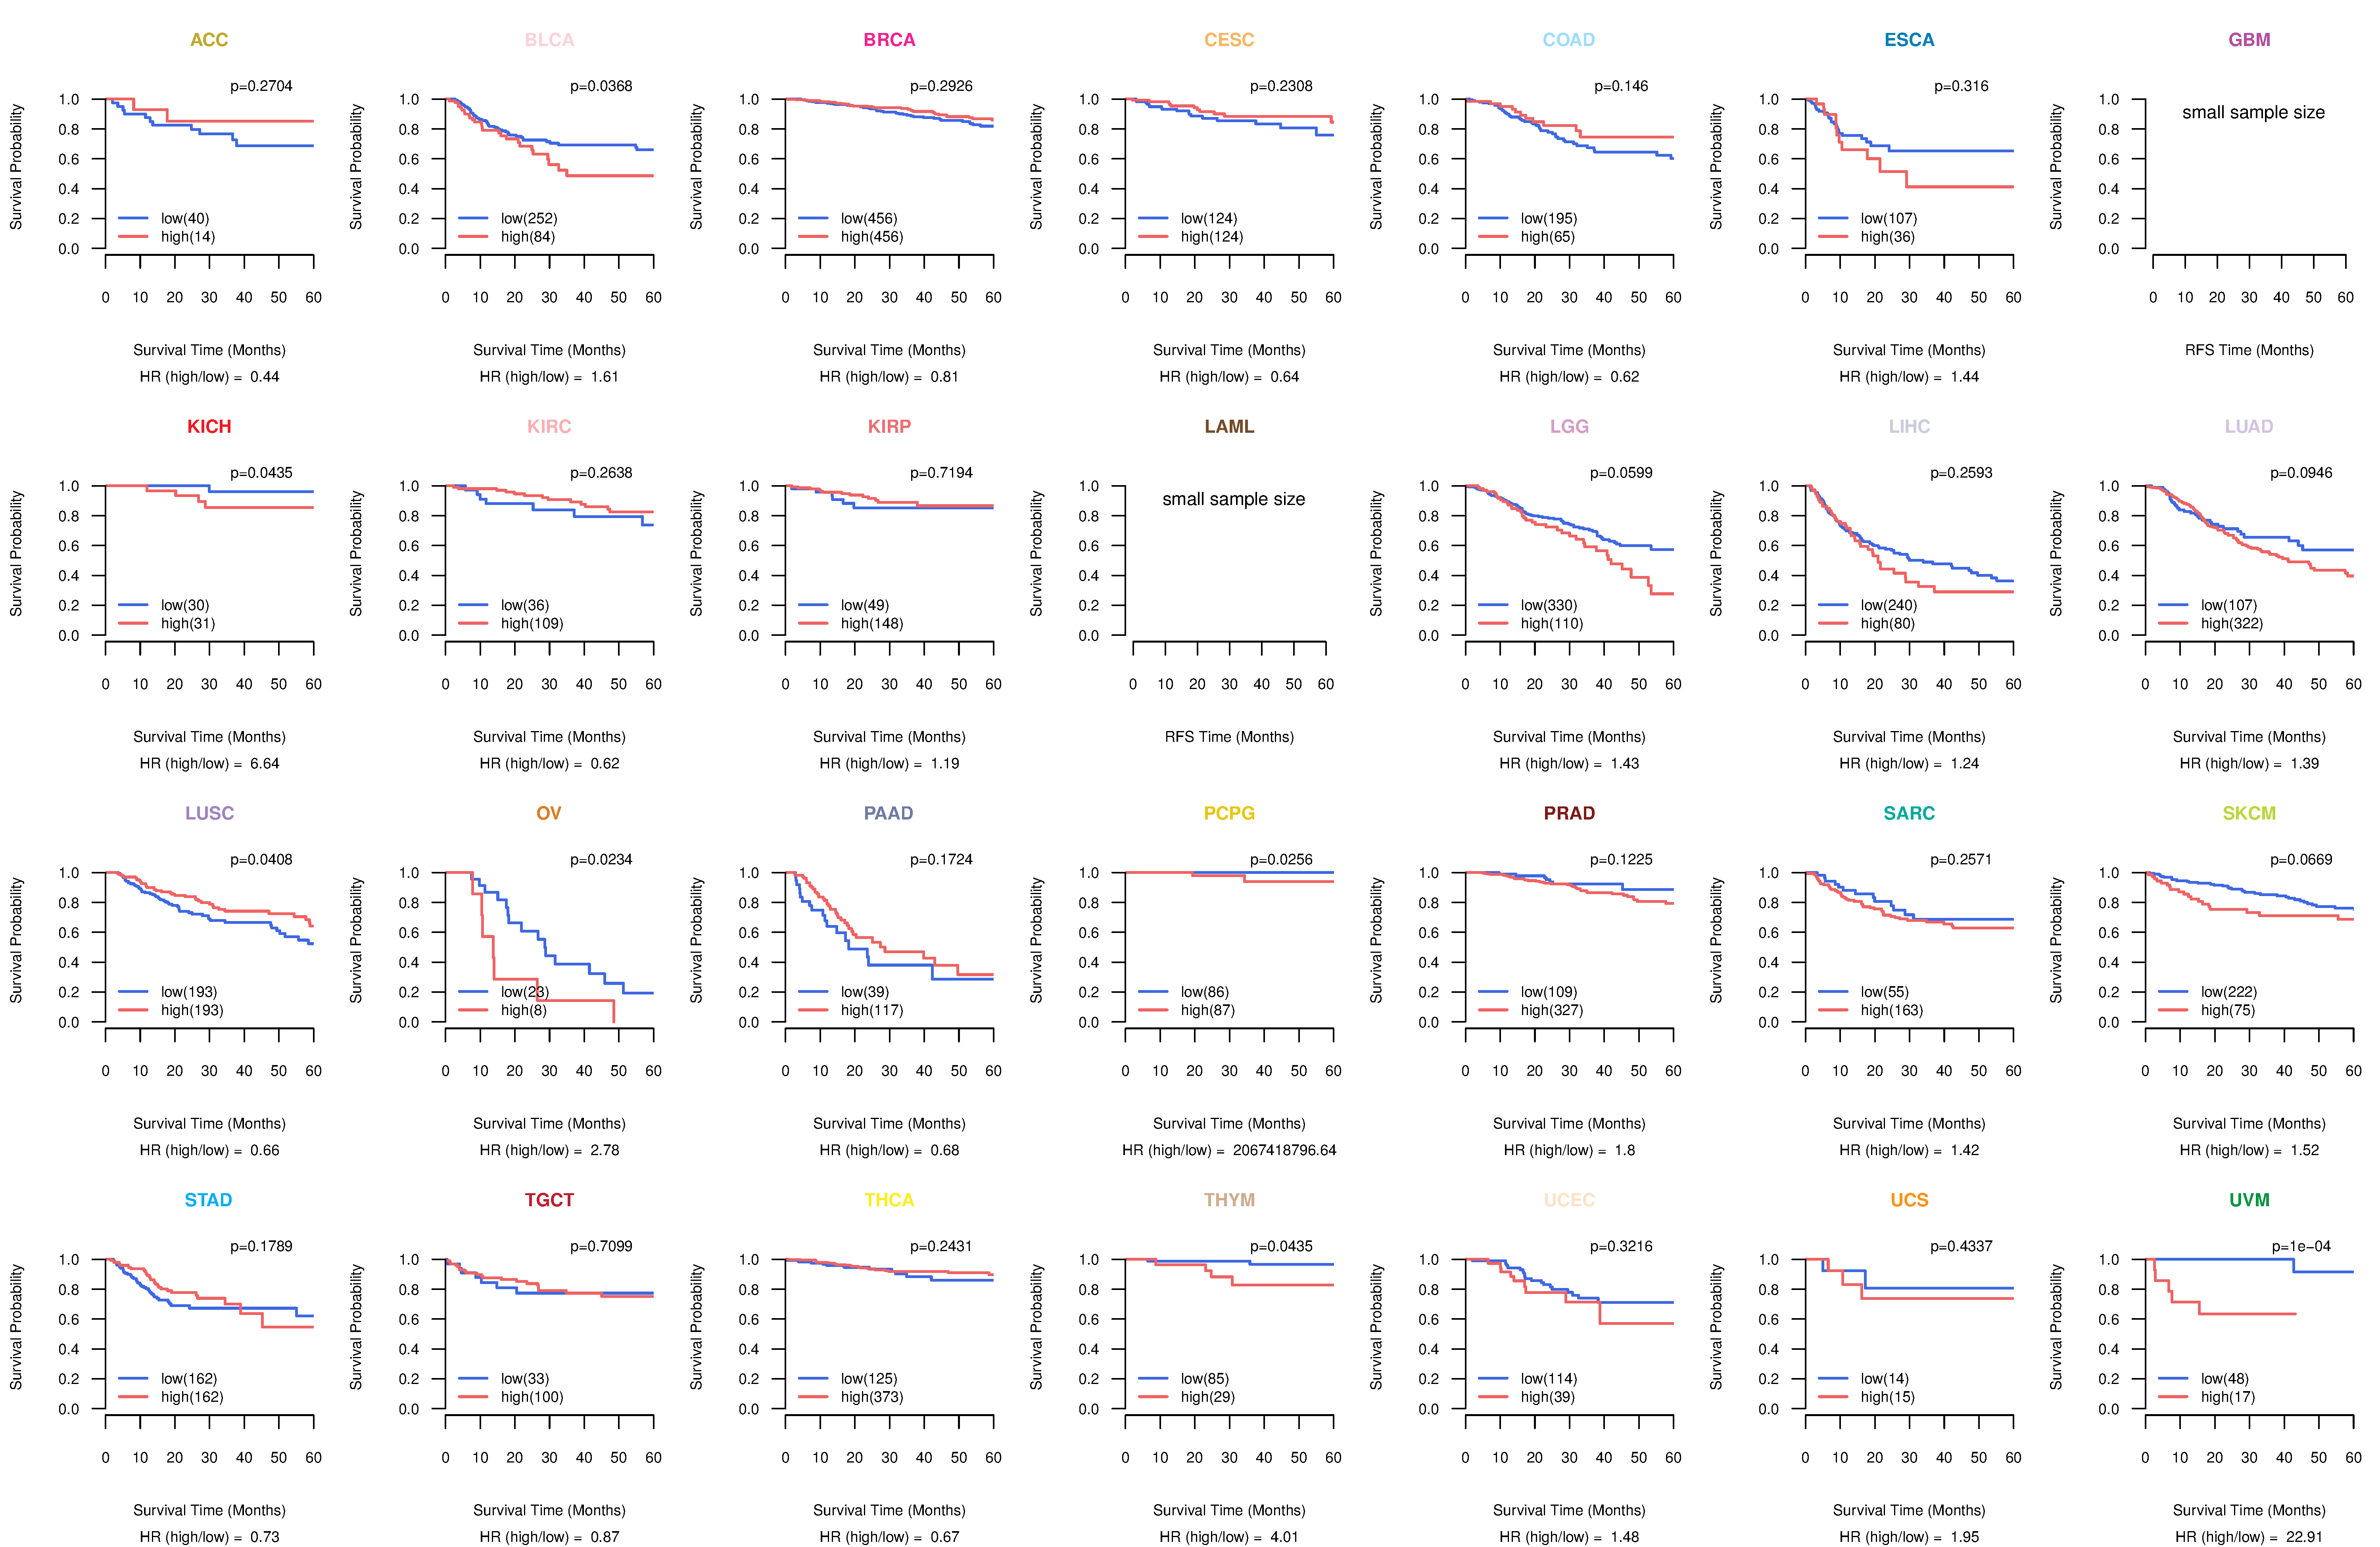
| Kaplan-Meier plots with logrank test of relapse free survival (RFS) using 28 cancer types (TCGA IlluminaHiSeq_RNASeqV2, pan-cancer normalized log2(norm_counts+1) data, version 2016-08-16) (TCGA clinicalMatrix, phenotype data, version 2016-04-27) * Click on the image enlarge it in a new window. |
 |
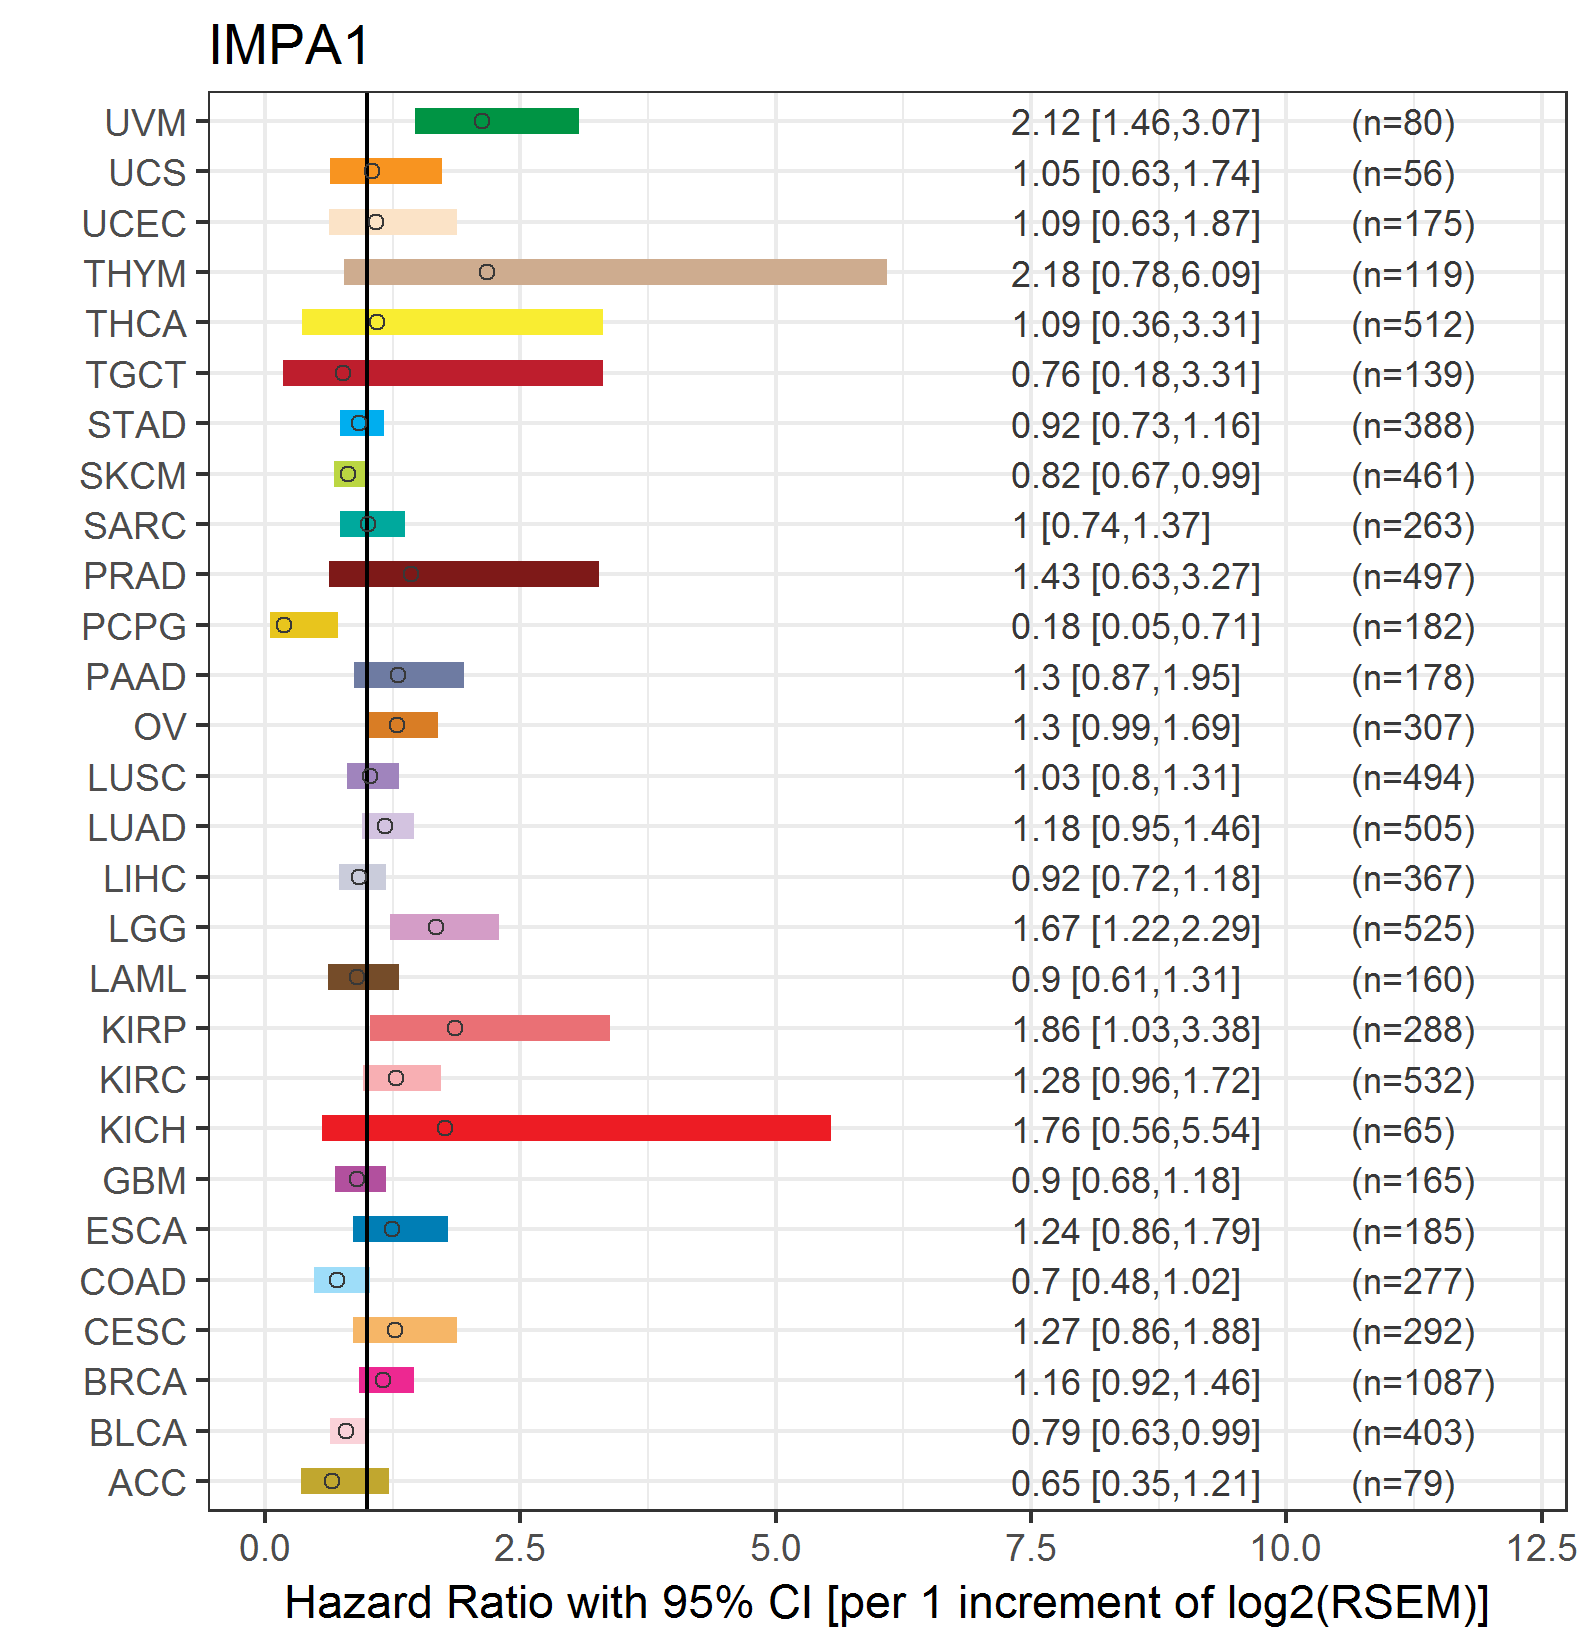
| Forest plot of Cox proportional hazard ratio (HR) and 95% CI of overall survival (OS) using 28 cancer types (TCGA IlluminaHiSeq_RNASeqV2, pan-cancer normalized log2(norm_counts+1) data, version 2016-08-16) (TCGA clinicalMatrix, phenotype data, version 2016-04-27) * Click on the image enlarge it in a new window. |
 |
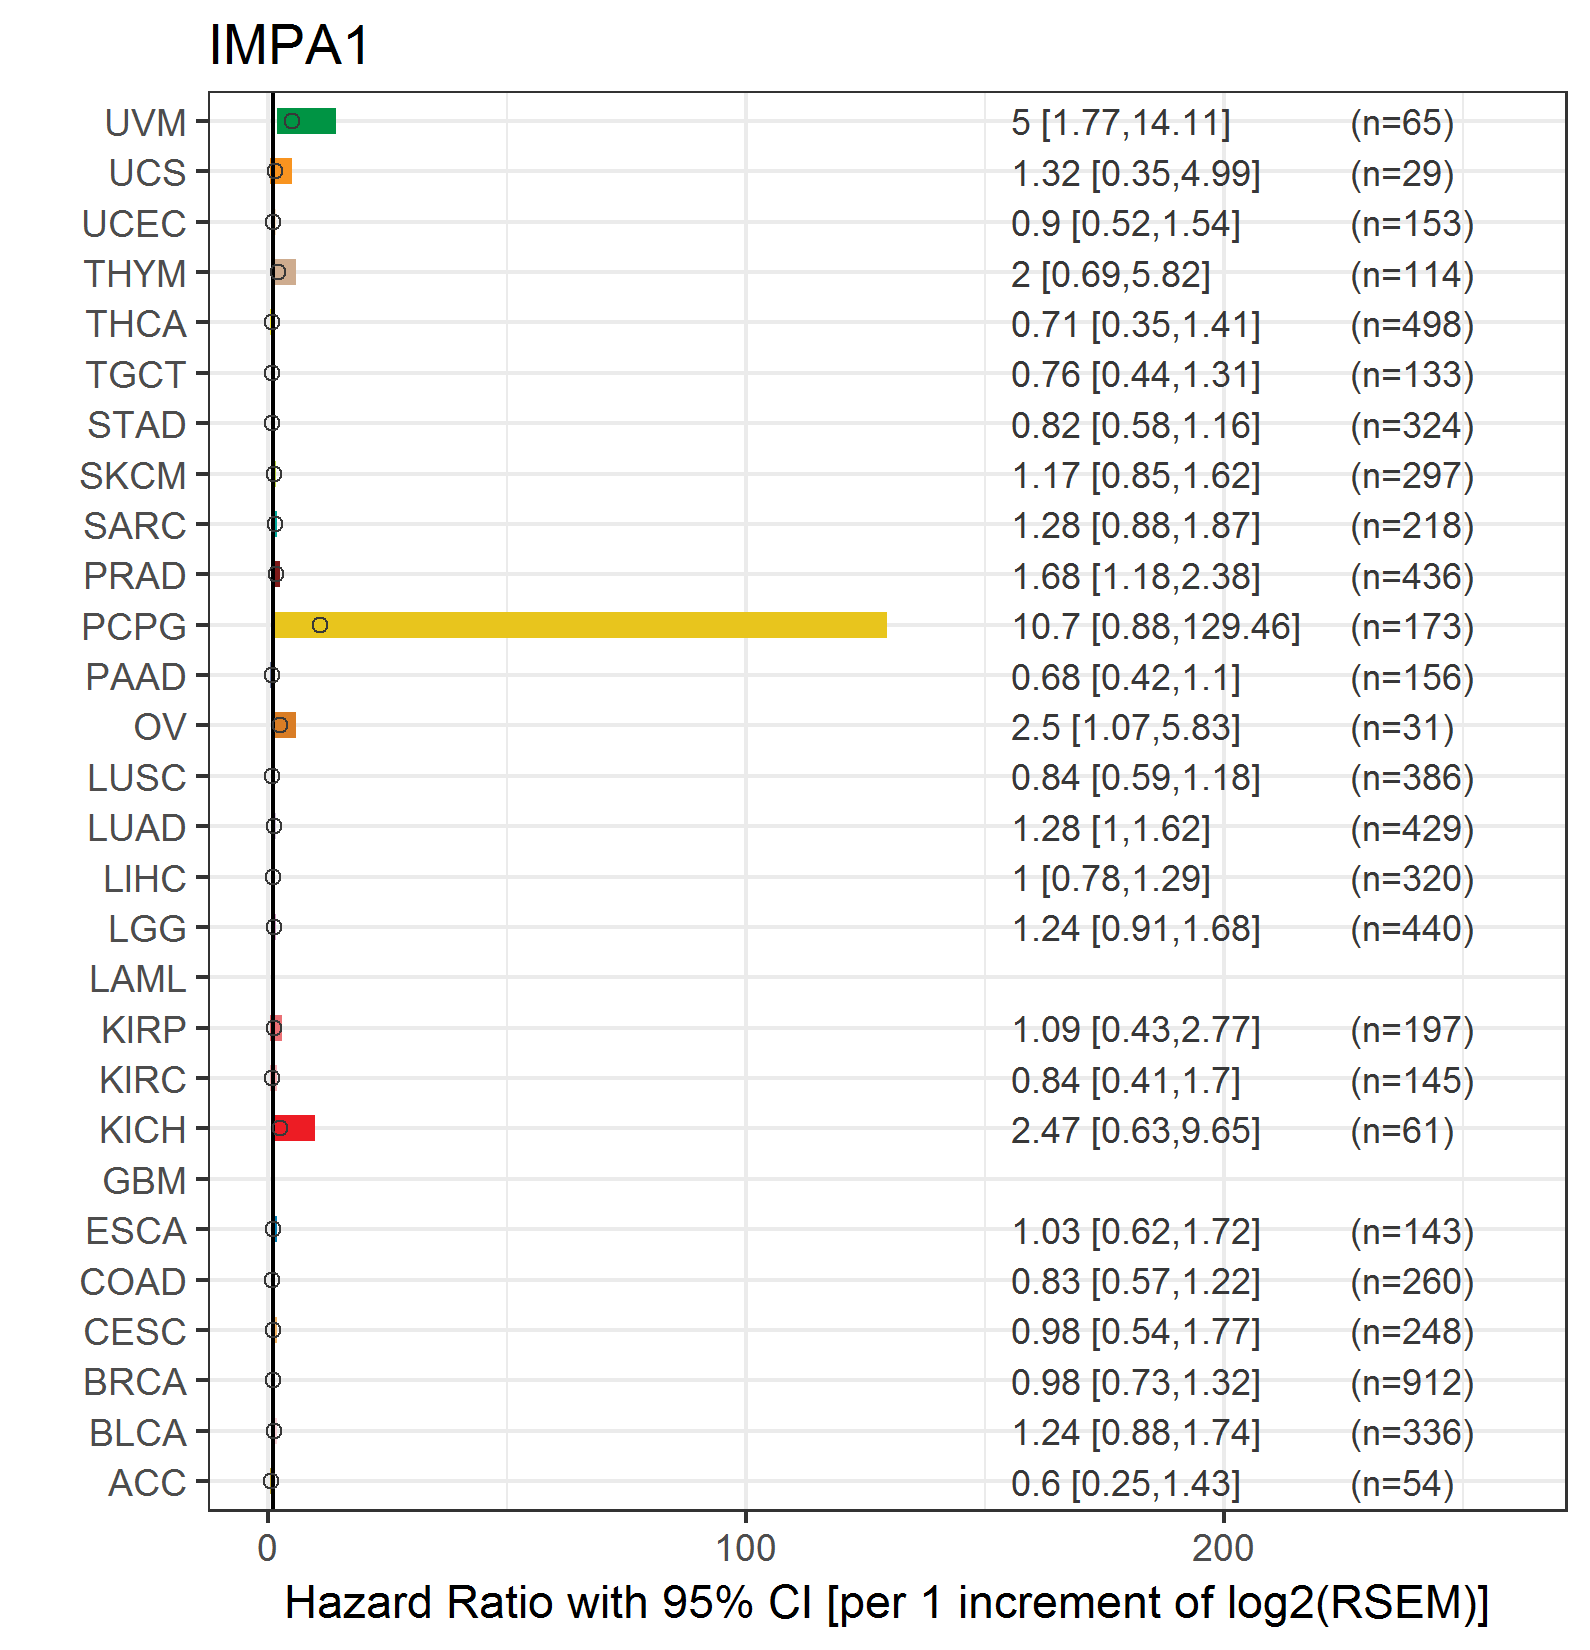
| Forest plot of Cox proportional hazard ratio (HR) and 95% CI of relapse free survival (RFS) using 28 cancer types (TCGA IlluminaHiSeq_RNASeqV2, pan-cancer normalized log2(norm_counts+1) data, version 2016-08-16) (TCGA clinicalMatrix, phenotype data, version 2016-04-27) * Click on the image enlarge it in a new window. |
 |
| Top |
| TissGeneClin for IMPA1 |
| TissGeneDrug for IMPA1 |
| Drug information targeting TissGene (DrugBank Version 5.0.6, 2017-04-01) |
| DrugBank ID | Drug name | Drug activity | Drug type | Drug status |
| DB01356 | Lithium | Inhibitor | Small molecule | Approved |
| Top |
| TissGeneDisease for IMPA1 |
| Disease information associated with TissGene (DisGeNet, 2016-06-01) |
| Disease ID | Disease name | # pubmeds | Source |
| umls:C0023418 | leukemia | 2 | BeFree |
| umls:C0205721 | Infections, Hospital | 2 | BeFree |
| umls:C0001973 | Alcoholic Intoxication, Chronic | 1 | BeFree |
| umls:C0005586 | Bipolar Disorder | 1 | BeFree |
| umls:C0007102 | Malignant tumor of colon | 1 | BeFree |
| umls:C0010418 | Cryptosporidiosis | 1 | BeFree |
| umls:C0011860 | Diabetes Mellitus, Non-Insulin-Dependent | 1 | BeFree |
| umls:C0017661 | IGA Glomerulonephritis | 1 | CTD_human |
| umls:C0017926 | Glycogen Storage Disease Type VII | 1 | BeFree |
| umls:C0033817 | Pseudomonas Infections | 1 | BeFree |
| umls:C0036572 | Seizures | 1 | CTD_human |
| umls:C0549393 | Alcohol problem | 1 | BeFree |
| umls:C0677886 | Epithelial ovarian cancer | 1 | BeFree |
| umls:C0699790 | Colon Carcinoma | 1 | BeFree |
|
Copyright 2016-Present - The University of Texas Health Science Center at Houston (UTHealth) Web File Viewing | How to Report, Fraud, Waste and Abuse | State of Texas | Statewide Search | Texas Homeland Security | Site Policies |