 |
| |
| |
| |
| |
| |
| |
|

| TissGeneSummary for KCNC2 |
 Gene summary Gene summary |
| Basic gene information | Gene symbol | KCNC2 |
| Gene name | potassium voltage-gated channel, Shaw-related subfamily, member 2 | |
| Synonyms | KV3.2 | |
| Cytomap | UCSC genome browser: 12q14.1 | |
| Type of gene | protein-coding | |
| RefGenes | NM_001260497.1, NM_001260498.1,NM_001260499.1,NM_139136.3,NM_139137.3, NM_153748.2, | |
| Description | potassium voltage-gated channel subfamily C member 2voltage-gated potassium channel Kv3.2 | |
| Modification date | 20141207 | |
| dbXrefs | MIM : 176256 | |
| HGNC : HGNC | ||
| Ensembl : ENSG00000166006 | ||
| HPRD : 08883 | ||
| Vega : OTTHUMG00000169717 | ||
| Protein | UniProt: go to UniProt's Cross Reference DB Table | |
| Expression | CleanEX: HS_KCNC2 | |
| BioGPS: 3747 | ||
| Pathway | NCI Pathway Interaction Database: KCNC2 | |
| KEGG: KCNC2 | ||
| REACTOME: KCNC2 | ||
| Pathway Commons: KCNC2 | ||
| Context | iHOP: KCNC2 | |
| ligand binding site mutation search in PubMed: KCNC2 | ||
| UCL Cancer Institute: KCNC2 | ||
| Assigned class in TissGDB* | C | |
| Included tissue-specific gene expression resources | HPA,TiGER | |
| Specific-tissues in normal samples (assigned by TissGDB using HPA, TiGER, and GTEx) | BrainProstate | |
| Cancer types related to the specific-tissues in cancer samples (assigned by TissGDB using TCGA) | GBM,LGGPRAD | |
| Reference showing the relevant tissue of KCNC2 | ||
| Description by TissGene annotations | Cancer gene Have significant anti-correlated miRNA Fused withTSGene | |
| * Class A consists of genes with literature evidence and is part of the cTissGenes. Class B consists of only cTissGenes without additional evidence. The remaining genes belong to Class C. |
| Gene ontology having evidence of Inferred from Direct Assay (IDA) from Entrez |
| GO ID | GO term | PubMed ID |
| Top |
| TissGeneExp for KCNC2 |
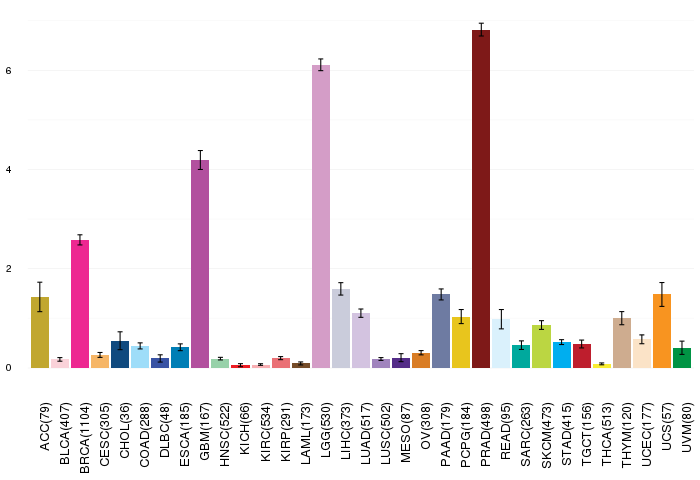
| Gene expressions across 28 cancer types (X-axis: cancer type and Y-axis: log2(norm_counts+1)) (TCGA IlluminaHiSeq_RNASeqV2, pan-cancer normalized log2(norm_counts+1) data, version 2016-08-16) |
 |
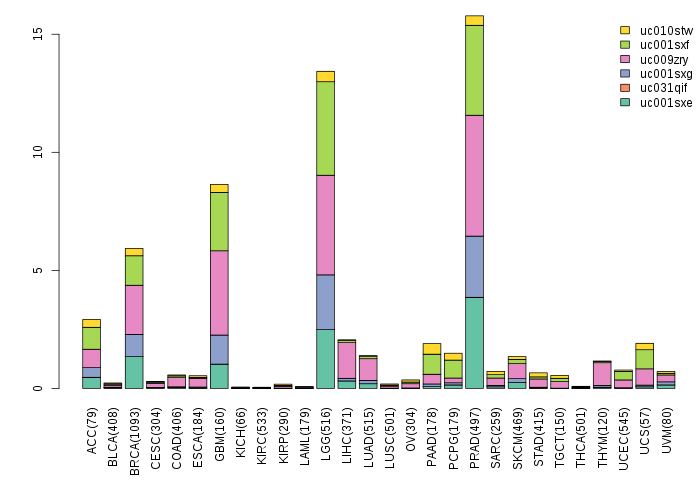
| Gene isoform expressions across 28 cancer types (X-axis: cancer type and Y-axis: log2(norm_counts+1)) (TCGA pan-cancer tcga_rsem_isoform_tpm, version 2016-09-01) |
 |
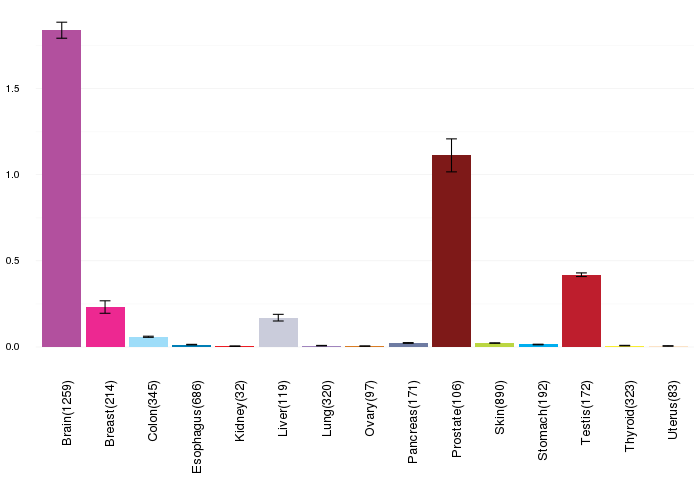
| Gene expressions across normal tissues of GTEx data (GTEx GTEx_Analysis_v6_RNA-seq_RNA-SeQCv1.1.8_gene_rpkm.gct) - Here, we shows the matched tissue types only among our 28 cancer types. |
 |
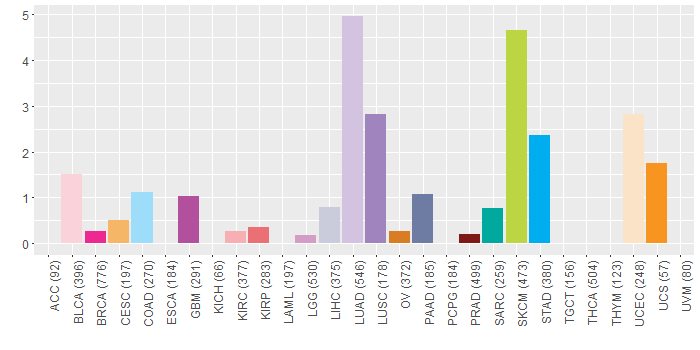
| Different expressions across 14 cancer types with more than 10 samples between matched tumors and normals (X-axis: cancer type and Y-axis: log2(norm_counts+1)) (TCGA IlluminaHiSeq_RNASeqV2, pan-cancer normalized log2(norm_counts+1) data, version 2016-08-16) |
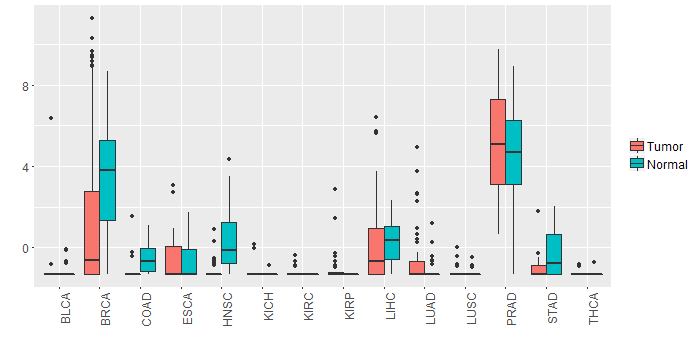 |
| - Significantly differentially expressed cancer types and information. (|Fold change|>1 and FDR<0.05) |
| Cancer type | Mean(exp) in tumor | Mean(exp) in matched normal | Log2FC | P-val. | FDR |
| HNSC | -1.105718173 | 0.233888804 | -1.339606977 | 2.57E-07 | 2.25E-06 |
| BRCA | 1.312457918 | 3.291422831 | -1.978964912 | 4.45E-06 | 1.14E-05 |
| Top |
| TissGene-miRNA for KCNC2 |
| Significantly anti-correlated miRNAs of TissGene across 28 cancer types (Gene-miRNA relations from TargetScanHuman Relsease 7.1, Conserved_Site_Context_Scores.txt.zip, 06.01.2016) (TCGA IlluminaHiSeq_miRNASeq, log2(RPM+1) data, version 2016-11-21) (TCGA IlluminaHiSeq_RNASeqV2, log2(normalized_count+1) data, version 2016-08-16) (Spearman’s Rank Correlation (p-value<0.05 and coefficient<-0.25)) |
| Cancer type | miRNA id | miRNA accession | P-val. | Coeff. | # samples |
| LUAD | hsa-let-7e-5p | MIMAT0000066 | 0.044 | -0.26 | 60 |
| THYM | hsa-miR-204-5p | MIMAT0000265 | 0.00084 | -0.3 | 122 |
| Top |
| TissGeneMut for KCNC2 |
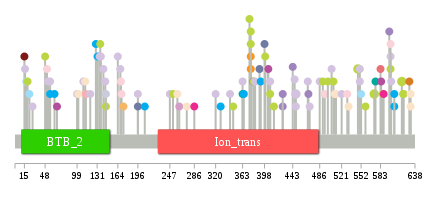
| TissGeneSNV for KCNC2 |
| nsSNV counts per each loci. Different colors of circles represent different cancer types. Circle size denotes number of samples. (TCGA somatic mutation (SNPs and small INDELs) data, version 2016-04-25) * Click on the image to enlarge it in a new window. |
 |
 |
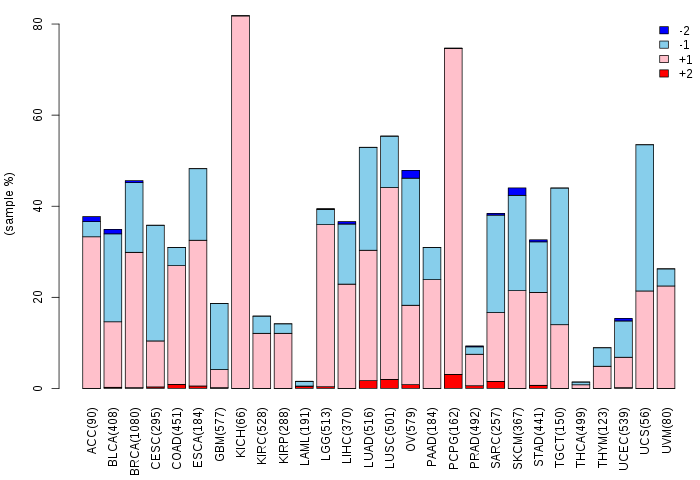
| Somatic nucleotide variants of TissGene across 28 cancer types (X-axis: cancer type and Y-axis: % of mutated samples) The numbers in parentheses are numbers of samples with mutation (nsSNVs). (TCGA somatic mutation (SNPs and small INDELs) data, version 2016-04-25) |
 |
| - nsSNVs sorted by frequency. |
| AAchange | Cancer type | # samples |
| p.G547E | SKCM | 2 |
| p.R376X | READ | 2 |
| p.E573K | SKCM | 2 |
| p.W448L | LUAD | 2 |
| p.D617N | SKCM | 2 |
| p.P499T | SKCM | 1 |
| p.S587F | SKCM | 1 |
| p.P132S | STAD | 1 |
| p.E136K | SKCM | 1 |
| p.A403V | UCEC | 1 |
| p.P550T | LUAD | 1 |
| p.F169L | BLCA | 1 |
| p.E145K | SKCM | 1 |
| p.G16V | LUAD | 1 |
| p.L328V | STAD | 1 |
| p.P470A | LUAD | 1 |
| p.D588N | BRCA | 1 |
| p.P468L | LUSC | 1 |
| p.W141L | HNSC | 1 |
| p.T374I | SKCM | 1 |
| p.R599* | LUAD | 1 |
| p.R376* | SKCM | 1 |
| p.I168F | LUAD | 1 |
| p.G51S | BLCA | 1 |
| p.L383F | LUAD | 1 |
| p.G407* | LUAD | 1 |
| p.H600N | LUAD | 1 |
| p.E20K | SKCM | 1 |
| p.M443I | LUSC | 1 |
| p.Y599H | SKCM | 1 |
| p.L532I | UCEC | 1 |
| p.V343L | LUAD | 1 |
| p.Y583D | KIRP | 1 |
| p.R629C | OV | 1 |
| p.Y113H | KIRC | 1 |
| p.P550L | LUAD | 1 |
| p.E164* | LUAD | 1 |
| p.E145K | LIHC | 1 |
| p.G15W | PRAD | 1 |
| p.A390D | PAAD | 1 |
| p.A196E | LUAD | 1 |
| p.P63L | STAD | 1 |
| p.G407E | SKCM | 1 |
| p.K494E | BLCA | 1 |
| p.L552P | COAD | 1 |
| p.R18W | COAD | 1 |
| p.R119H | READ | 1 |
| p.K53* | LUAD | 1 |
| p.W141R | LUAD | 1 |
| p.C575Y | SARC | 1 |
| p.R631Q | UCEC | 1 |
| p.E286V | BRCA | 1 |
| p.T120N | LUAD | 1 |
| p.E193Q | HNSC | 1 |
| p.A605V | STAD | 1 |
| p.R23C | COAD | 1 |
| p.G392* | STAD | 1 |
| p.T48I | SKCM | 1 |
| p.T605P | STAD | 1 |
| p.Q446K | LUAD | 1 |
| p.R599Q | BLCA | 1 |
| p.R376* | UCS | 1 |
| p.E404K | GBM | 1 |
| p.R491M | SKCM | 1 |
| p.S505T | LUAD | 1 |
| p.E170D | BLCA | 1 |
| p.A196T | PAAD | 1 |
| p.N259H | UCEC | 1 |
| p.R363S | LUAD | 1 |
| p.E135K | LUAD | 1 |
| p.P56S | STAD | 1 |
| p.N380Y | LUSC | 1 |
| p.D173N | CESC | 1 |
| p.Y274H | UCEC | 1 |
| p.R363H | SARC | 1 |
| p.A112T | UCEC | 1 |
| p.E252K | SKCM | 1 |
| p.P56A | LUAD | 1 |
| p.L314I | READ | 1 |
| p.K510N | UCEC | 1 |
| p.R376Q | SKCM | 1 |
| p.G427W | LUSC | 1 |
| p.V129M | STAD | 1 |
| p.G131R | LIHC | 1 |
| p.K597T | LUSC | 1 |
| p.D144E | LUAD | 1 |
| p.G109C | LUAD | 1 |
| p.T584M | GBM | 1 |
| p.P413T | SKCM | 1 |
| p.S598F | HNSC | 1 |
| p.W448R | LUAD | 1 |
| p.F508I | SKCM | 1 |
| p.T28N | LUAD | 1 |
| p.T398I | PAAD | 1 |
| p.R631* | UCEC | 1 |
| p.C247F | LUAD | 1 |
| p.K486R | LUAD | 1 |
| p.A67V | GBM | 1 |
| p.M467I | LUAD | 1 |
| p.E101K | UCEC | 1 |
| p.G620E | SKCM | 1 |
| p.R348K | SKCM | 1 |
| p.E262K | LGG | 1 |
| p.E381K | SKCM | 1 |
| p.E137D | LUAD | 1 |
| p.F365L | STAD | 1 |
| p.E512K | UCEC | 1 |
| p.Q521H | LUAD | 1 |
| p.N530S | BLCA | 1 |
| p.P559L | SKCM | 1 |
| p.F320L | LUAD | 1 |
| p.R207H | STAD | 1 |
| p.W141C | HNSC | 1 |
| p.R376X | UCS | 1 |
| p.G99C | LIHC | 1 |
| p.S619L | SKCM | 1 |
| p.M399I | SKCM | 1 |
| p.G427R | LUSC | 1 |
| Top |
| TissGeneCNV for KCNC2 |
| Copy number variations of TissGene across 28 cancer types (X-axis: cancer type and Y-axis: % of CNV samples) (TCGA Gistic2_CopyNumber_Gistic2_all_data_by_genes, Gistic2 copy number data, version 2016-08-16) |
 |
| Top |
| TissGeneFusions for KCNC2 |
| Fusion genes including TissGene (ChimerDB 3.0, 2016-12-01 and TCGA fusion Portal 2015-12-01) |
| Database | Src | Cancer type | Sample | Fusion gene | ORF | 5'-gene BP | 3'-gene BP |
| Chimerdb3.0 | FusionScan | SARC | TCGA-DX-A1KZ-01A | TM7SF3-KCNC2 | Out-of-Frame | chr12:27143382 | chr12:75445097 |
| TCGAfusionPortal | PRADA | BLCA | TCGA-BT-A20X-01A | MARCH9-KCNC2 | In-frame | Chr12:58150867 | Chr12:75445097 |
| TCGAfusionPortal | PRADA | BRCA | TCGA-AQ-A04L-01B | ROR2-KCNC2 | 5UTR-CDS | Chr9:94710889 | Chr12:75445097 |
| TCGAfusionPortal | PRADA | BRCA | TCGA-E9-A5UO-01A | ATP2B1-KCNC2 | Out-of-frame | Chr12:90004970 | Chr12:75442097 |
| Top |
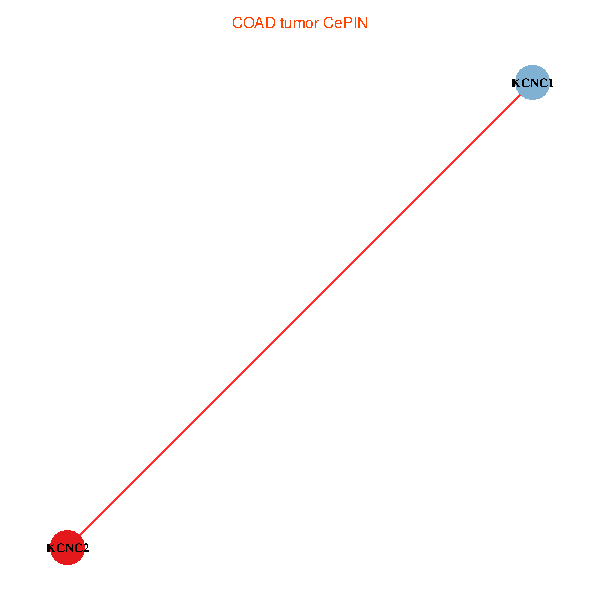
| TissGeneNet for KCNC2 |
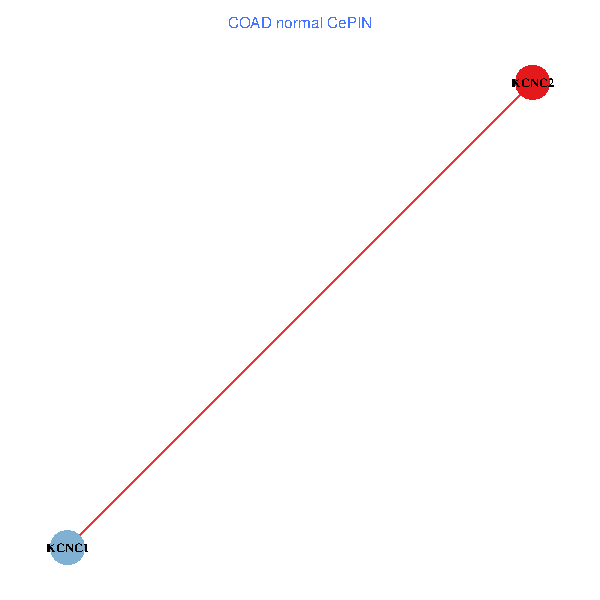
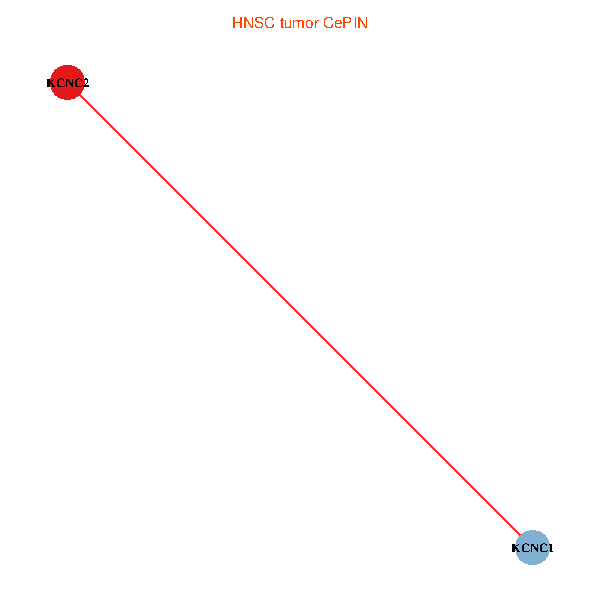
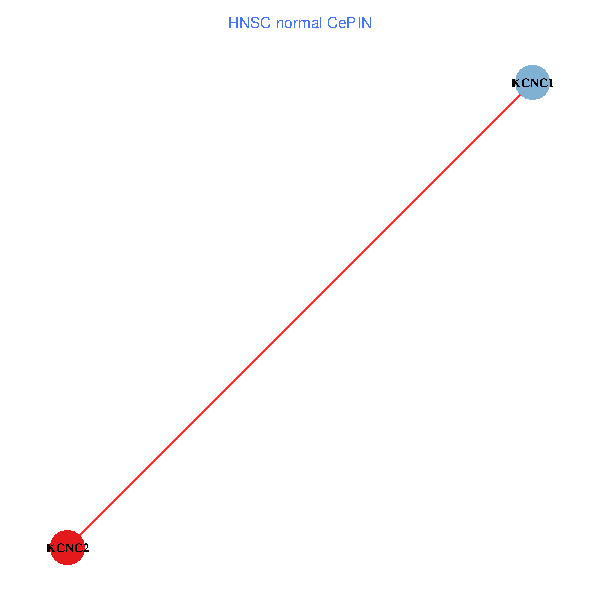
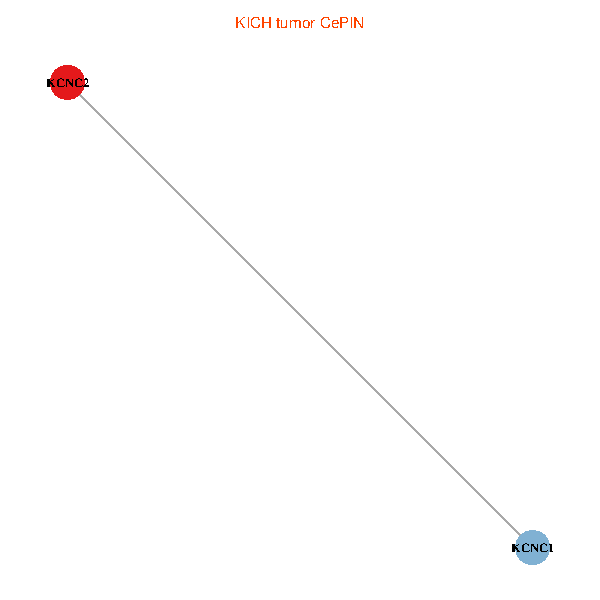
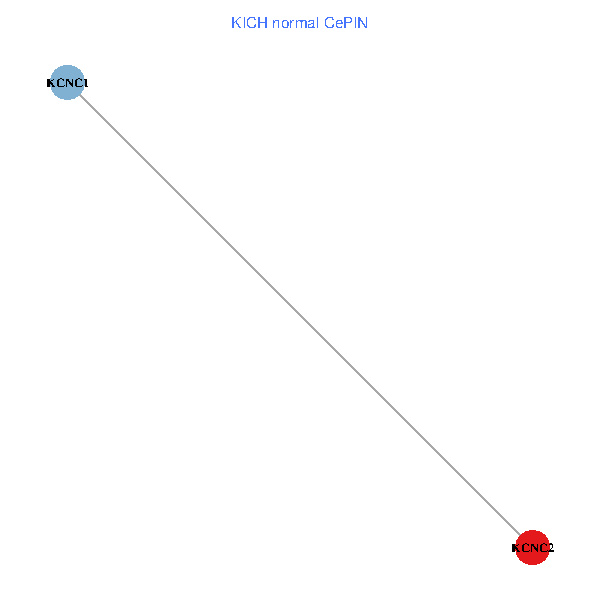
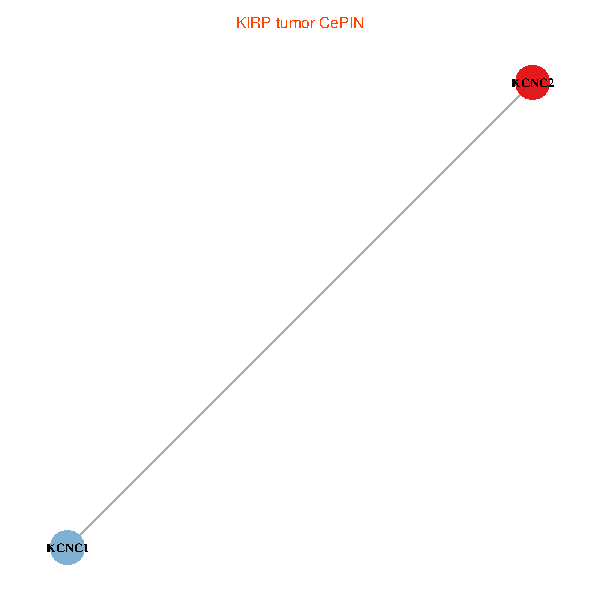
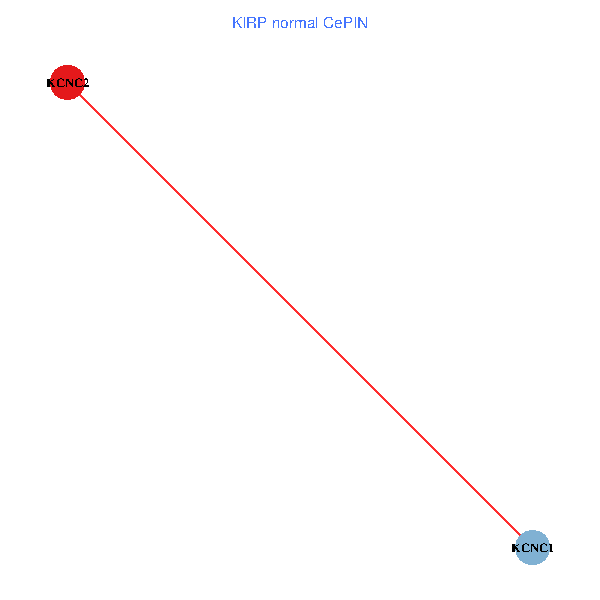
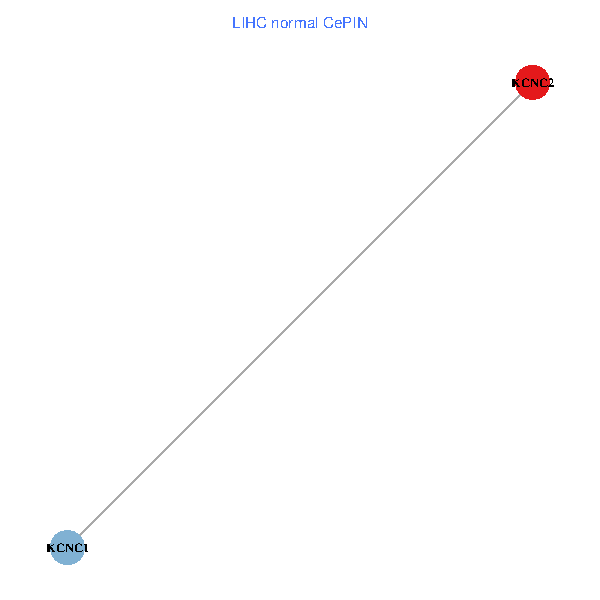
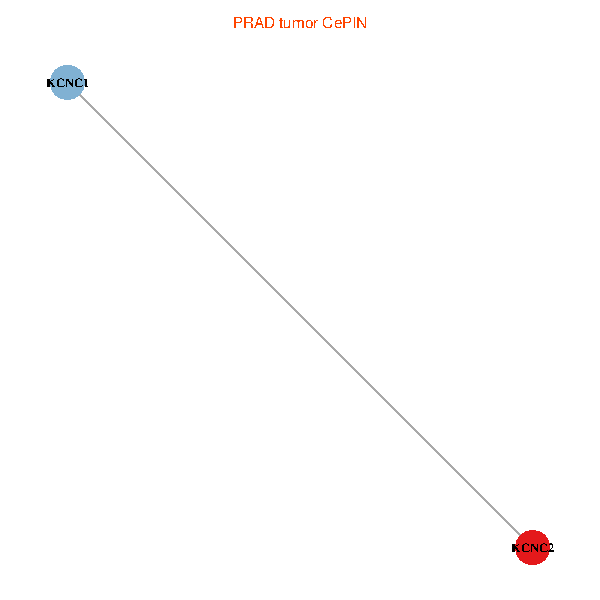
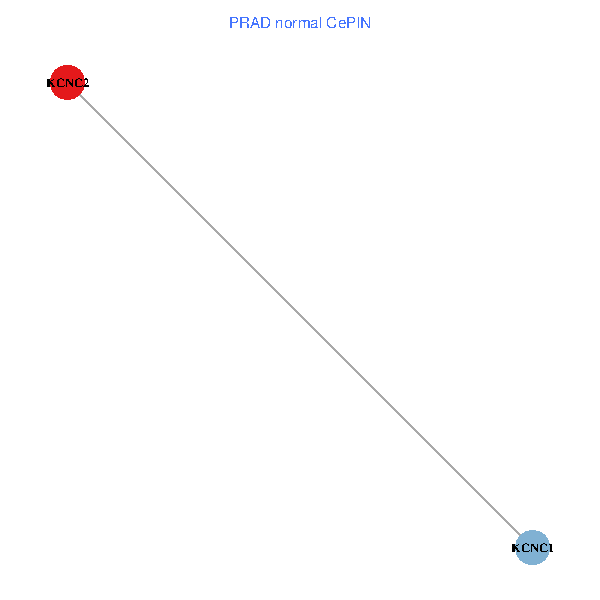
| Co-expressed gene networks based on protein-protein interaction data (CePIN) (TCGA IlluminaHiSeq_RNASeqV2, pan-cancer normalized log2(norm_counts+1) data, version 2016-08-16) (PINA2 ppi data) |
| BRCA (tumor) | BRCA (normal) |
| KCNC2, KCNC1 (tumor) | KCNC2, KCNC1 (normal) |
 |  |
| COAD (tumor) | COAD (normal) |
| KCNC2, KCNC1 (tumor) | KCNC2, KCNC1 (normal) |
 |  |
| HNSC (tumor) | HNSC (normal) |
| KCNC2, KCNC1 (tumor) | KCNC2, KCNC1 (normal) |
 |  |
| KICH (tumor) | KICH (normal) |
| KCNC2, KCNC1 (tumor) | KCNC2, KCNC1 (normal) |
 |  |
| KIRC (tumor) | KIRC (normal) |
| KCNC2, KCNC1 (tumor) | KCNC2, KCNC1 (normal) |
 |  |
| KIRP (tumor) | KIRP (normal) |
| KCNC2, KCNC1 (tumor) | KCNC2, KCNC1 (normal) |
 |  |
| LIHC (tumor) | LIHC (normal) |
| KCNC2, KCNC1 (tumor) | KCNC2, KCNC1 (normal) |
 |  |
| LUAD (tumor) | LUAD (normal) |
| KCNC2, KCNC1 (tumor) | KCNC2, KCNC1 (normal) |
 |  |
| LUSC (tumor) | LUSC (normal) |
| KCNC2, KCNC1 (tumor) | KCNC2, KCNC1 (normal) |
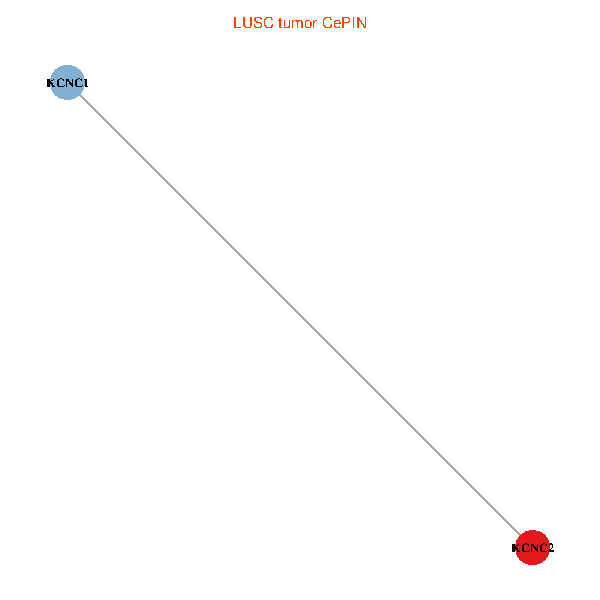 |  |
| PRAD (tumor) | PRAD (normal) |
| KCNC2, KCNC1 (tumor) | KCNC2, KCNC1 (normal) |
 |  |
| STAD (tumor) | STAD (normal) |
| KCNC2, KCNC1 (tumor) | KCNC2, KCNC1 (normal) |
 |  |
| THCA (tumor) | THCA (normal) |
| KCNC2, KCNC1 (tumor) | KCNC2, KCNC1 (normal) |
 |  |
| Top |
| TissGeneProg for KCNC2 |
| Kaplan-Meier plots with logrank tests of overall survival (OS) using 28 cancer types (TCGA IlluminaHiSeq_RNASeqV2, pan-cancer normalized log2(norm_counts+1) data, version 2016-08-16) (TCGA clinicalMatrix, phenotype data, version 2016-04-27) * Click on the image to enlarge it in a new window. |
 |
| Kaplan-Meier plots with logrank test of relapse free survival (RFS) using 28 cancer types (TCGA IlluminaHiSeq_RNASeqV2, pan-cancer normalized log2(norm_counts+1) data, version 2016-08-16) (TCGA clinicalMatrix, phenotype data, version 2016-04-27) * Click on the image enlarge it in a new window. |
 |
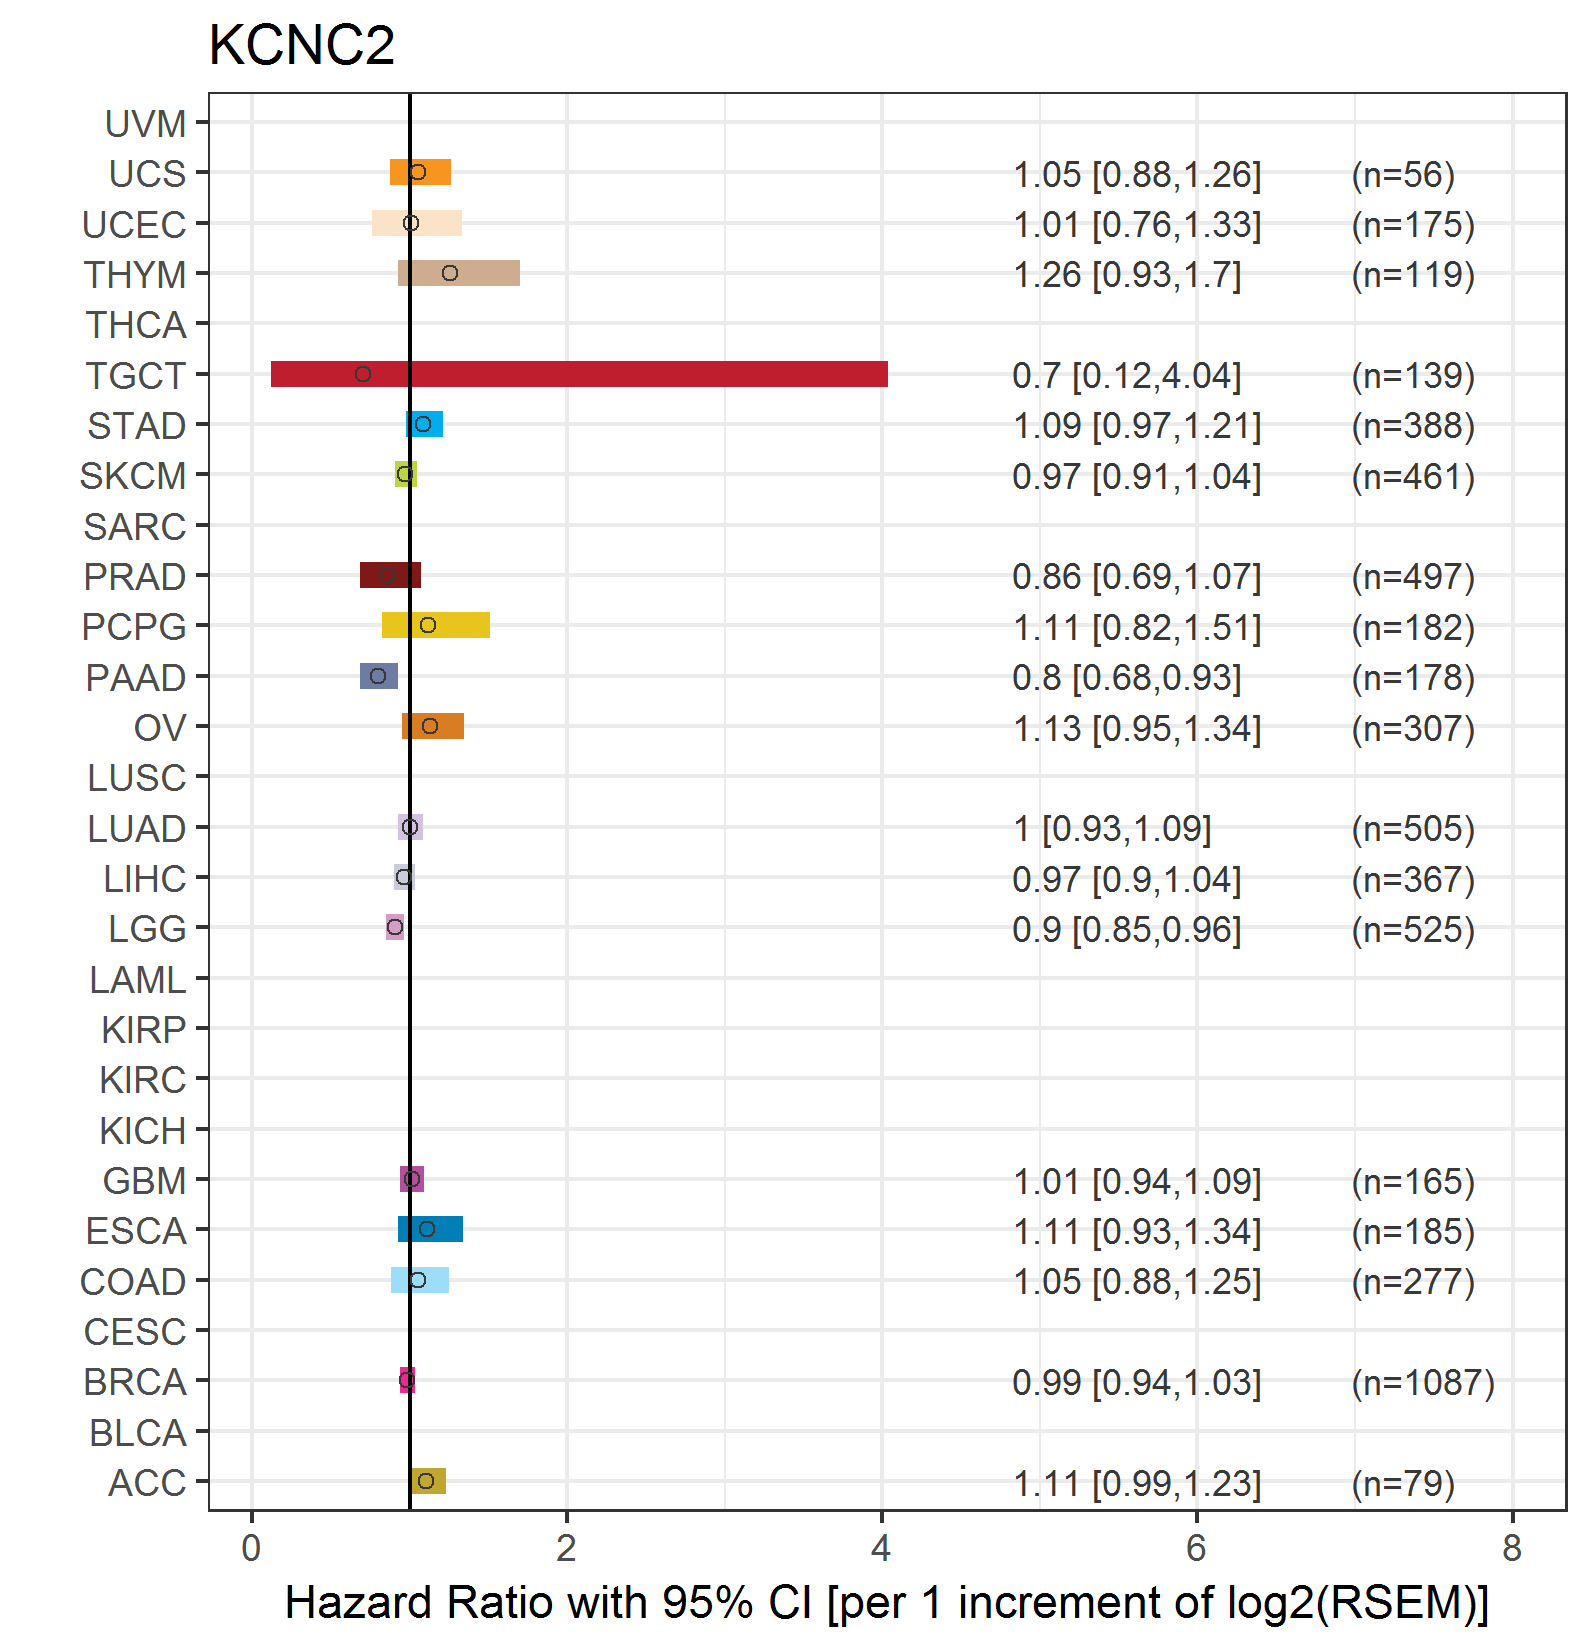
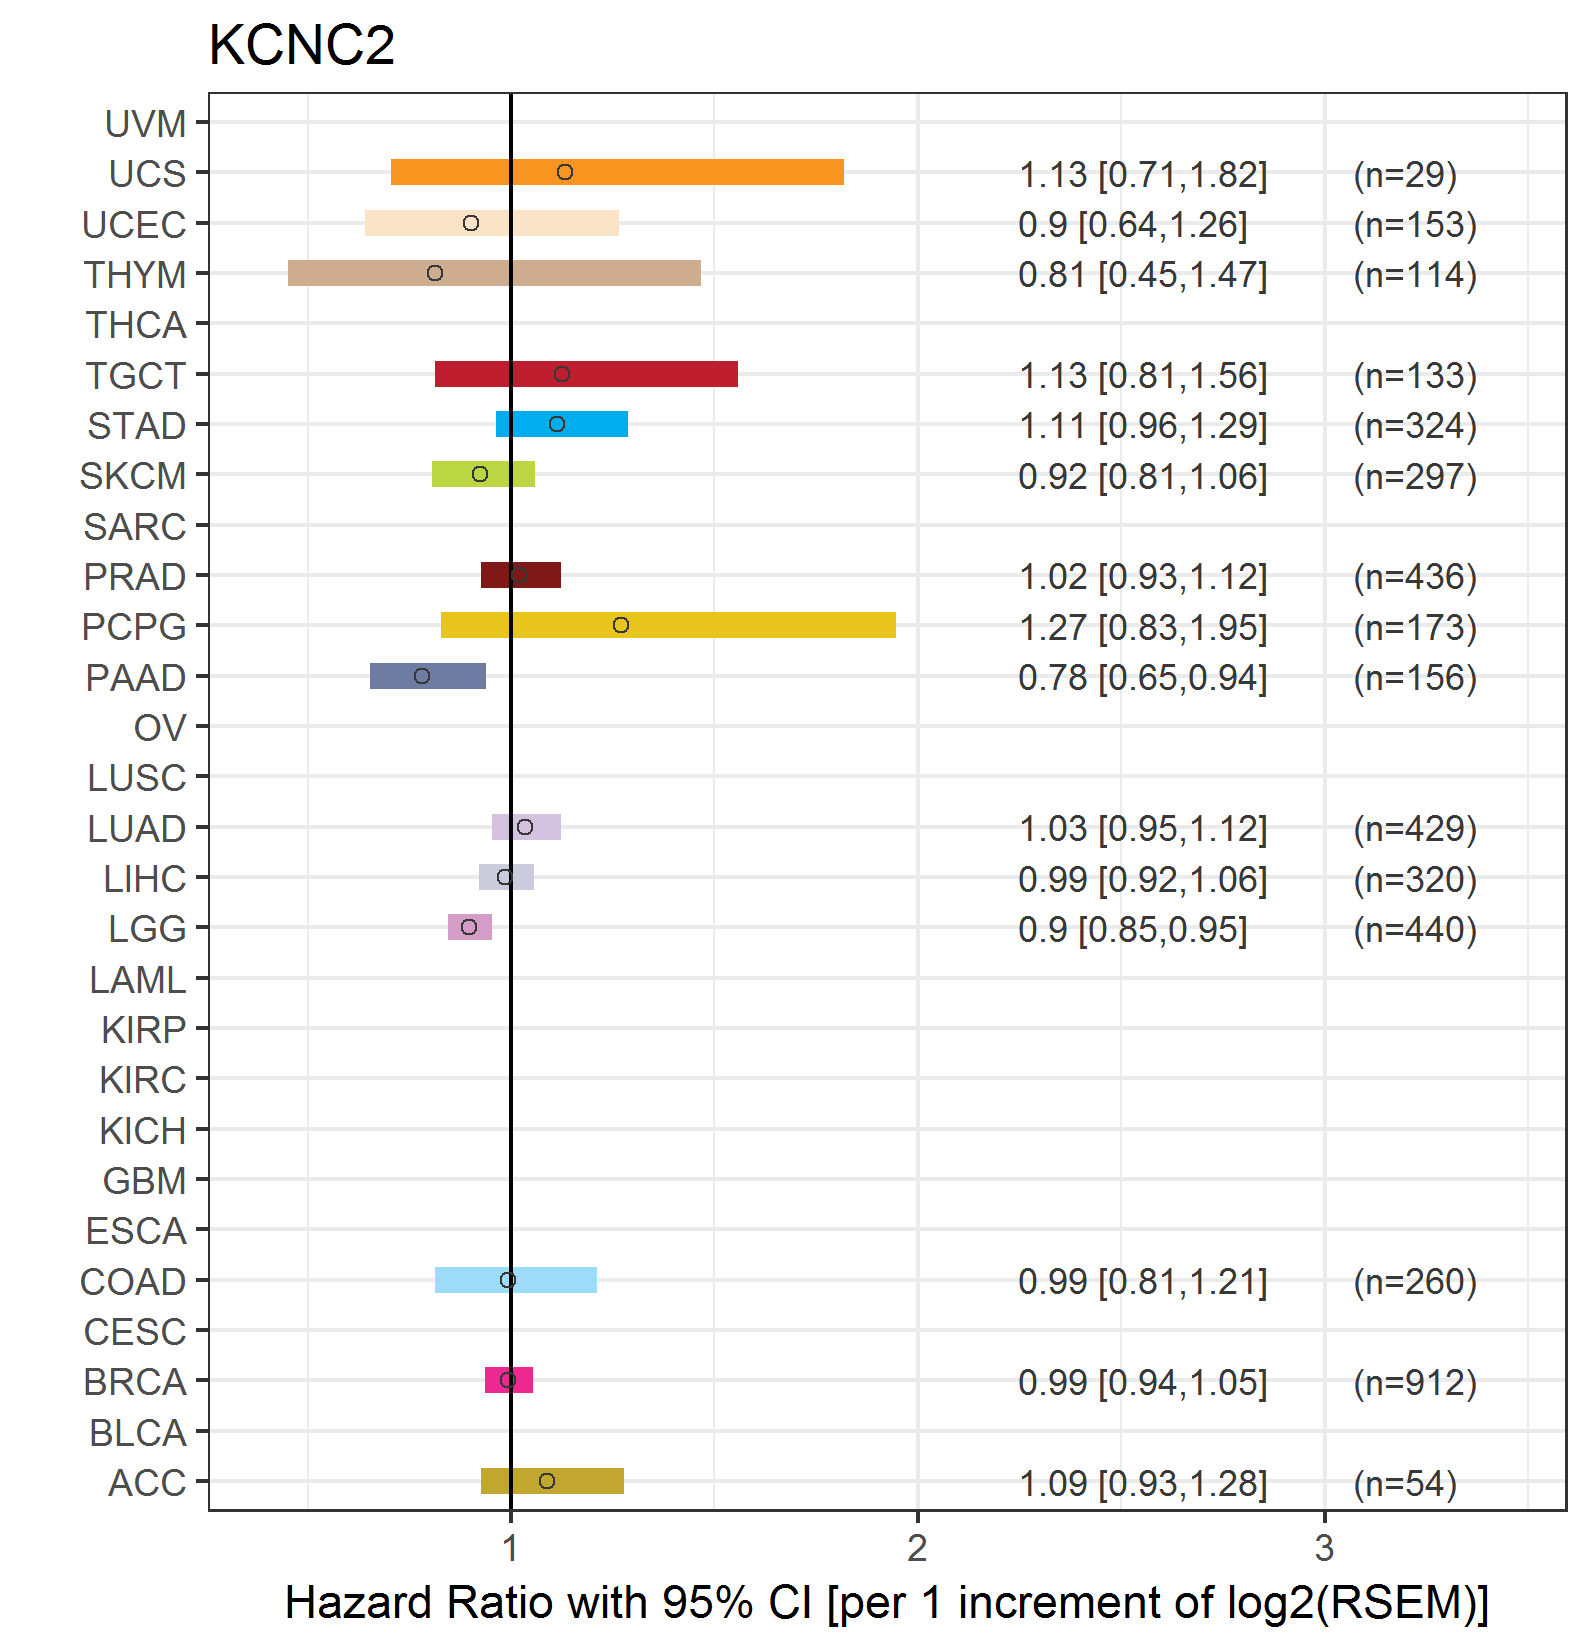
| Forest plot of Cox proportional hazard ratio (HR) and 95% CI of overall survival (OS) using 28 cancer types (TCGA IlluminaHiSeq_RNASeqV2, pan-cancer normalized log2(norm_counts+1) data, version 2016-08-16) (TCGA clinicalMatrix, phenotype data, version 2016-04-27) * Click on the image enlarge it in a new window. |
 |
| Forest plot of Cox proportional hazard ratio (HR) and 95% CI of relapse free survival (RFS) using 28 cancer types (TCGA IlluminaHiSeq_RNASeqV2, pan-cancer normalized log2(norm_counts+1) data, version 2016-08-16) (TCGA clinicalMatrix, phenotype data, version 2016-04-27) * Click on the image enlarge it in a new window. |
 |
| Top |
| TissGeneClin for KCNC2 |
| TissGeneDrug for KCNC2 |
| Drug information targeting TissGene (DrugBank Version 5.0.6, 2017-04-01) |
| DrugBank ID | Drug name | Drug activity | Drug type | Drug status |
| DB06637 | Dalfampridine | Antagonist | Small molecule | Approved |
| Top |
| TissGeneDisease for KCNC2 |
| Disease information associated with TissGene (DisGeNet, 2016-06-01) |
| Disease ID | Disease name | # pubmeds | Source |
|
Copyright 2016-Present - The University of Texas Health Science Center at Houston (UTHealth) Web File Viewing | How to Report, Fraud, Waste and Abuse | State of Texas | Statewide Search | Texas Homeland Security | Site Policies |