 |
| |
| |
| |
| |
| |
| |
|

| TissGeneSummary for KPNA5 |
 Gene summary Gene summary |
| Basic gene information | Gene symbol | KPNA5 |
| Gene name | karyopherin alpha 5 (importin alpha 6) | |
| Synonyms | IPOA6|SRP6 | |
| Cytomap | UCSC genome browser: 6q22.1 | |
| Type of gene | protein-coding | |
| RefGenes | NM_002269.2, | |
| Description | importin alpha 6importin subunit alpha-6karyopherin subunit alpha-5 | |
| Modification date | 20141207 | |
| dbXrefs | MIM : 604545 | |
| HGNC : HGNC | ||
| Ensembl : ENSG00000196911 | ||
| HPRD : 05179 | ||
| Vega : OTTHUMG00000015448 | ||
| Protein | UniProt: go to UniProt's Cross Reference DB Table | |
| Expression | CleanEX: HS_KPNA5 | |
| BioGPS: 3841 | ||
| Pathway | NCI Pathway Interaction Database: KPNA5 | |
| KEGG: KPNA5 | ||
| REACTOME: KPNA5 | ||
| Pathway Commons: KPNA5 | ||
| Context | iHOP: KPNA5 | |
| ligand binding site mutation search in PubMed: KPNA5 | ||
| UCL Cancer Institute: KPNA5 | ||
| Assigned class in TissGDB* | C | |
| Included tissue-specific gene expression resources | TiGER,GTEx | |
| Specific-tissues in normal samples (assigned by TissGDB using HPA, TiGER, and GTEx) | Testis | |
| Cancer types related to the specific-tissues in cancer samples (assigned by TissGDB using TCGA) | TGCT | |
| Reference showing the relevant tissue of KPNA5 | ||
| Description by TissGene annotations | Cancer gene Have significant anti-correlated miRNA | |
| * Class A consists of genes with literature evidence and is part of the cTissGenes. Class B consists of only cTissGenes without additional evidence. The remaining genes belong to Class C. |
| Gene ontology having evidence of Inferred from Direct Assay (IDA) from Entrez |
| GO ID | GO term | PubMed ID |
| Top |
| TissGeneExp for KPNA5 |
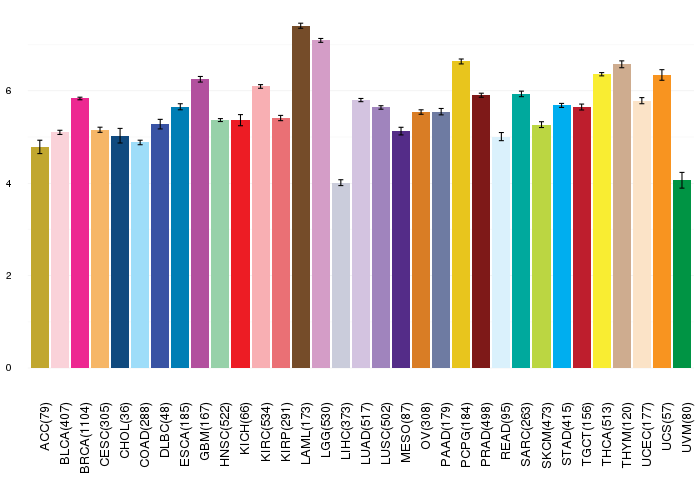
| Gene expressions across 28 cancer types (X-axis: cancer type and Y-axis: log2(norm_counts+1)) (TCGA IlluminaHiSeq_RNASeqV2, pan-cancer normalized log2(norm_counts+1) data, version 2016-08-16) |
 |
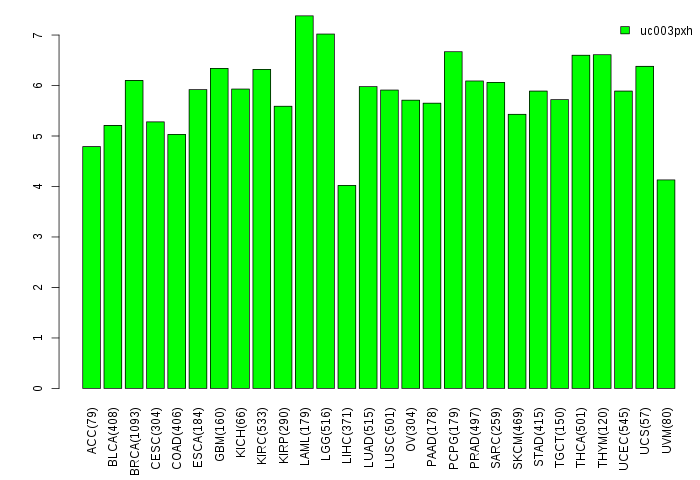
| Gene isoform expressions across 28 cancer types (X-axis: cancer type and Y-axis: log2(norm_counts+1)) (TCGA pan-cancer tcga_rsem_isoform_tpm, version 2016-09-01) |
 |
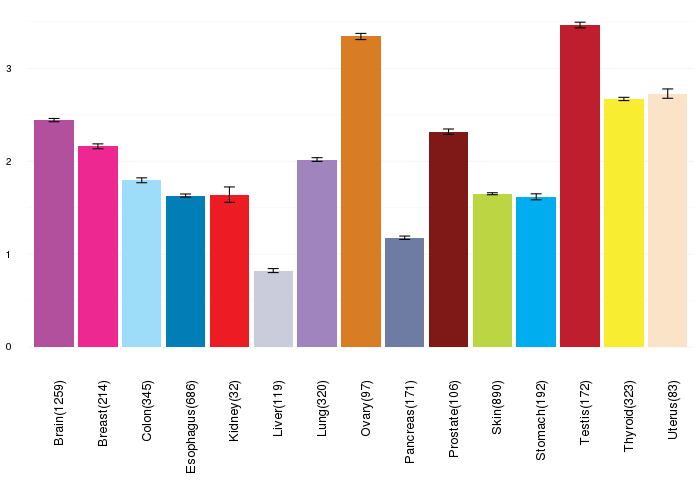
| Gene expressions across normal tissues of GTEx data (GTEx GTEx_Analysis_v6_RNA-seq_RNA-SeQCv1.1.8_gene_rpkm.gct) - Here, we shows the matched tissue types only among our 28 cancer types. |
 |
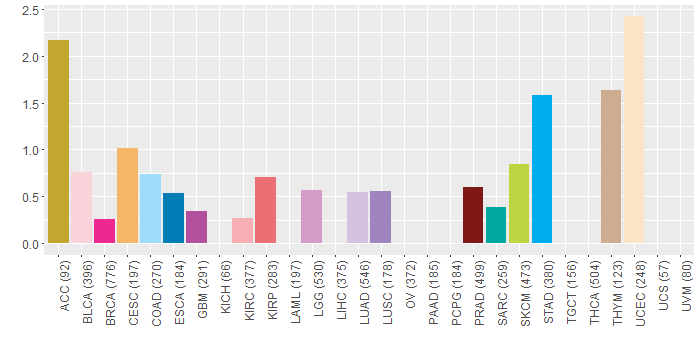
| Different expressions across 14 cancer types with more than 10 samples between matched tumors and normals (X-axis: cancer type and Y-axis: log2(norm_counts+1)) (TCGA IlluminaHiSeq_RNASeqV2, pan-cancer normalized log2(norm_counts+1) data, version 2016-08-16) |
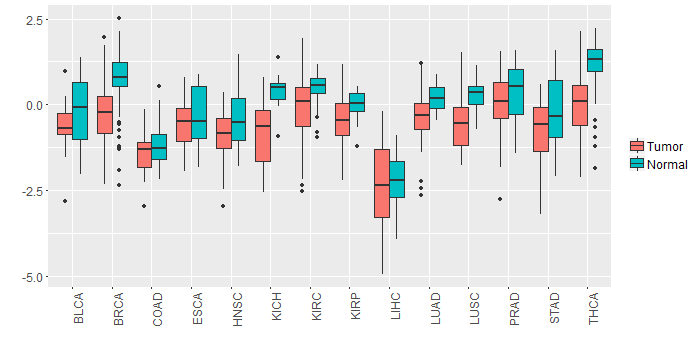 |
| - Significantly differentially expressed cancer types and information. (|Fold change|>1 and FDR<0.05) |
| Cancer type | Mean(exp) in tumor | Mean(exp) in matched normal | Log2FC | P-val. | FDR |
| BRCA | -0.269192677 | 0.750193287 | -1.019385965 | 1.12E-18 | 7.25E-18 |
| KICH | -0.849552818 | 0.405095182 | -1.254648 | 8.26E-07 | 3.13E-06 |
| THCA | -0.058621699 | 1.133396945 | -1.192018644 | 2.41E-12 | 2.00E-11 |
| Top |
| TissGene-miRNA for KPNA5 |
| Significantly anti-correlated miRNAs of TissGene across 28 cancer types (Gene-miRNA relations from TargetScanHuman Relsease 7.1, Conserved_Site_Context_Scores.txt.zip, 06.01.2016) (TCGA IlluminaHiSeq_miRNASeq, log2(RPM+1) data, version 2016-11-21) (TCGA IlluminaHiSeq_RNASeqV2, log2(normalized_count+1) data, version 2016-08-16) (Spearman’s Rank Correlation (p-value<0.05 and coefficient<-0.25)) |
| Cancer type | miRNA id | miRNA accession | P-val. | Coeff. | # samples |
| LUAD | hsa-miR-106b-5p | MIMAT0000680 | 0.0096 | -0.33 | 60 |
| Top |
| TissGeneMut for KPNA5 |
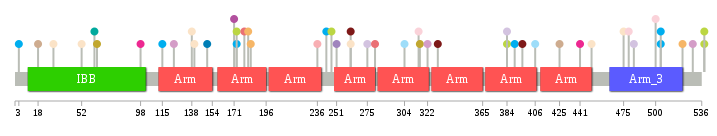
| TissGeneSNV for KPNA5 |
| nsSNV counts per each loci. Different colors of circles represent different cancer types. Circle size denotes number of samples. (TCGA somatic mutation (SNPs and small INDELs) data, version 2016-04-25) * Click on the image to enlarge it in a new window. |
 |
 |
| Somatic nucleotide variants of TissGene across 28 cancer types (X-axis: cancer type and Y-axis: % of mutated samples) The numbers in parentheses are numbers of samples with mutation (nsSNVs). (TCGA somatic mutation (SNPs and small INDELs) data, version 2016-04-25) |
 |
| - nsSNVs sorted by frequency. |
| AAchange | Cancer type | # samples |
| p.V275L | LUAD | 1 |
| p.A236T | KIRC | 1 |
| p.P316S | ACC | 1 |
| p.Y504X | STAD | 1 |
| p.L179P | KIRP | 1 |
| p.R30Q | UCEC | 1 |
| p.E483* | LUAD | 1 |
| p.E475K | UCEC | 1 |
| p.R262* | PRAD | 1 |
| p.R319G | CHOL | 1 |
| p.R396H | PRAD | 1 |
| p.K18E | THYM | 1 |
| p.G322S | LGG | 1 |
| p.N521I | CESC | 1 |
| p.S315L | BLCA | 1 |
| p.E140D | UCEC | 1 |
| p.P384L | SKCM | 1 |
| p.Q529K | LGG | 1 |
| p.L500V | BLCA | 1 |
| p.N450H | UCEC | 1 |
| p.E388D | HNSC | 1 |
| p.Q538* | SKCM | 1 |
| p.E182K | CESC | 1 |
| p.Q291E | HNSC | 1 |
| p.N52D | UCEC | 1 |
| p.E64Q | ACC | 1 |
| p.Y281D | KIRP | 1 |
| p.L479V | BLCA | 1 |
| p.M62I | SARC | 1 |
| p.L390F | STAD | 1 |
| p.D98N | BRCA | 1 |
| p.P247S | SKCM | 1 |
| p.Q124H | LGG | 1 |
| p.C425X | THYM | 1 |
| p.G243D | STAD | 1 |
| p.R138I | UCEC | 1 |
| p.P173L | SKCM | 1 |
| p.R138I | READ | 1 |
| p.R262Q | UCEC | 1 |
| p.P384R | LUAD | 1 |
| p.E304K | COAD | 1 |
| p.P173L | STAD | 1 |
| p.W150C | ESCA | 1 |
| p.T406S | COAD | 1 |
| p.Y504* | STAD | 1 |
| p.V441A | BRCA | 1 |
| p.A3D | STAD | 1 |
| p.P115H | STAD | 1 |
| p.A171G | GBM | 1 |
| p.Q538X | SKCM | 1 |
| p.I330V | PRAD | 1 |
| p.E184K | CESC | 1 |
| p.S251I | LUSC | 1 |
| Top |
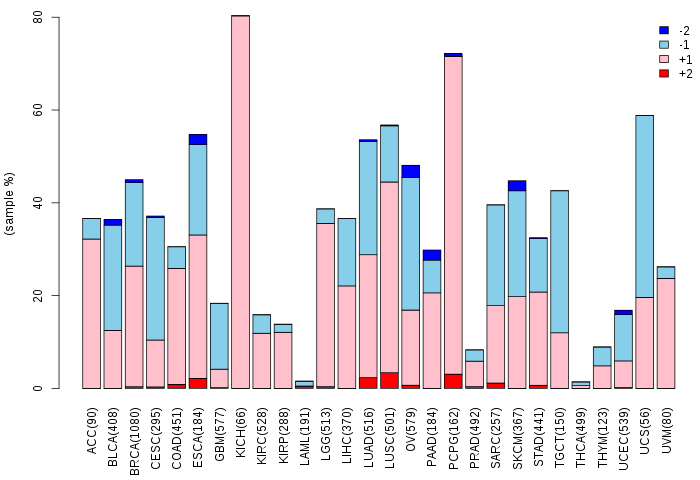
| TissGeneCNV for KPNA5 |
| Copy number variations of TissGene across 28 cancer types (X-axis: cancer type and Y-axis: % of CNV samples) (TCGA Gistic2_CopyNumber_Gistic2_all_data_by_genes, Gistic2 copy number data, version 2016-08-16) |
 |
| Top |
| TissGeneFusions for KPNA5 |
| Fusion genes including TissGene (ChimerDB 3.0, 2016-12-01 and TCGA fusion Portal 2015-12-01) |
| Database | Src | Cancer type | Sample | Fusion gene | ORF | 5'-gene BP | 3'-gene BP |
| Chimerdb3.0 | ChiTaRs | NA | AA207010 | KPNA5-LOC152217 | chr6:117055887 | chr3:196670119 |
| Top |
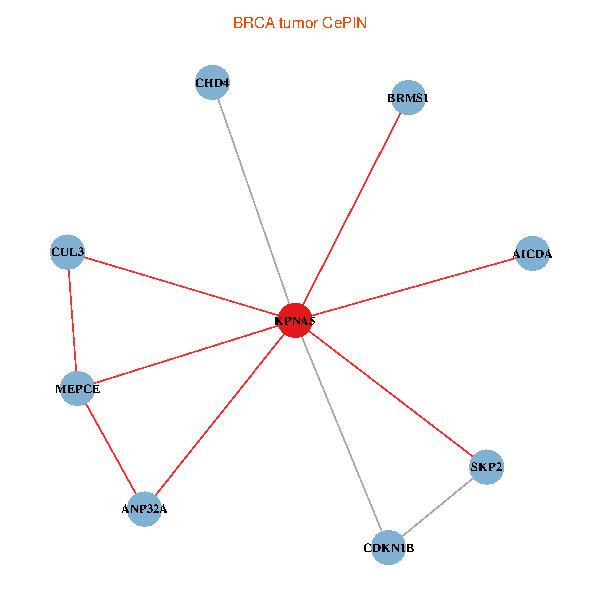
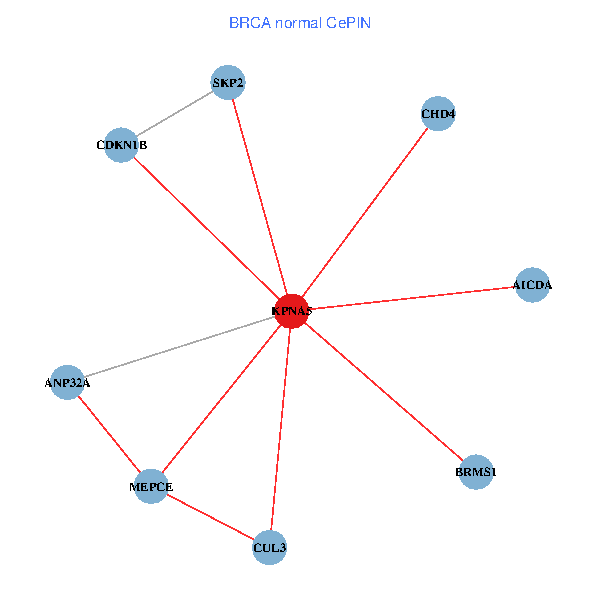
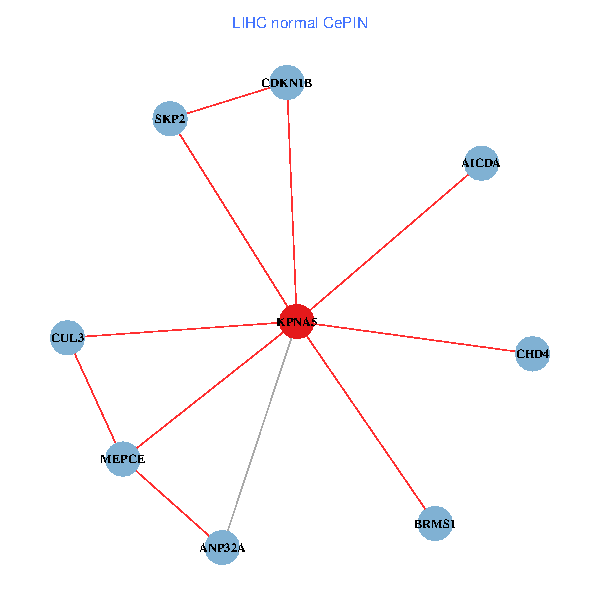
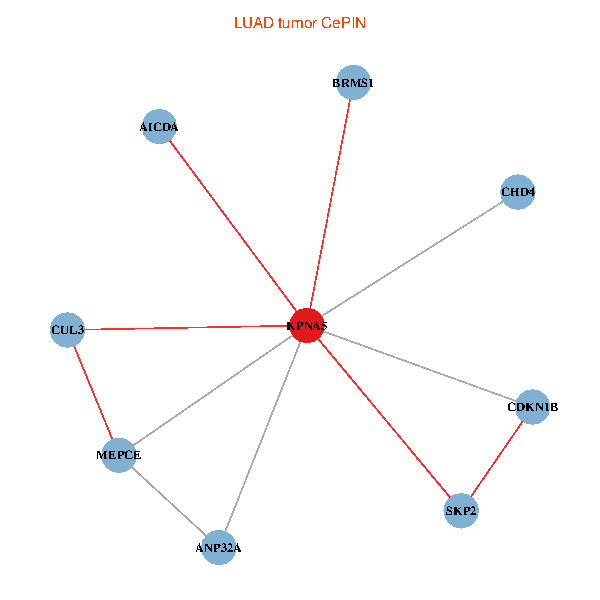
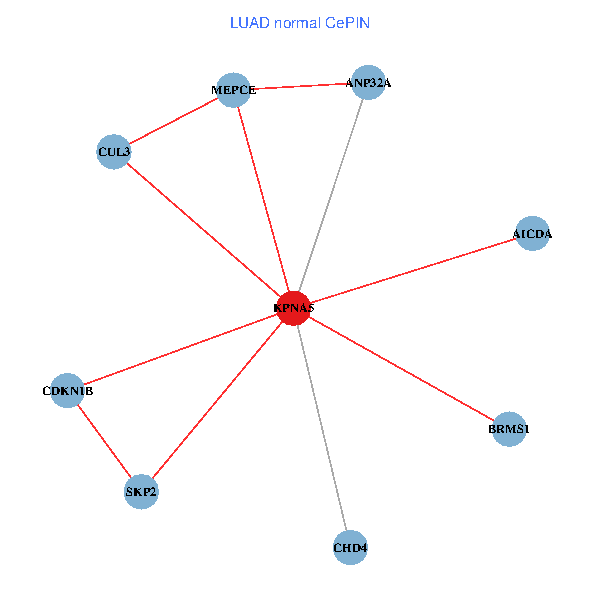
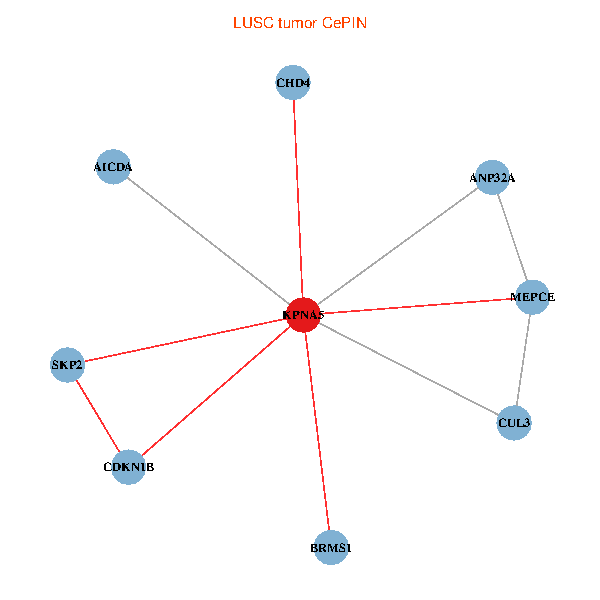
| TissGeneNet for KPNA5 |
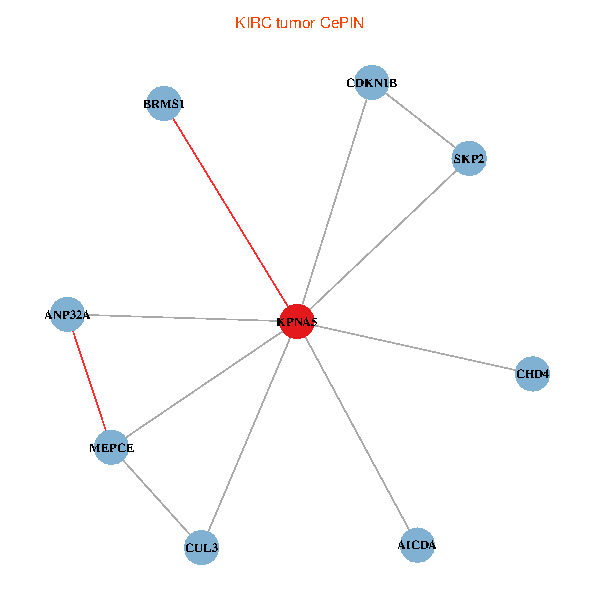
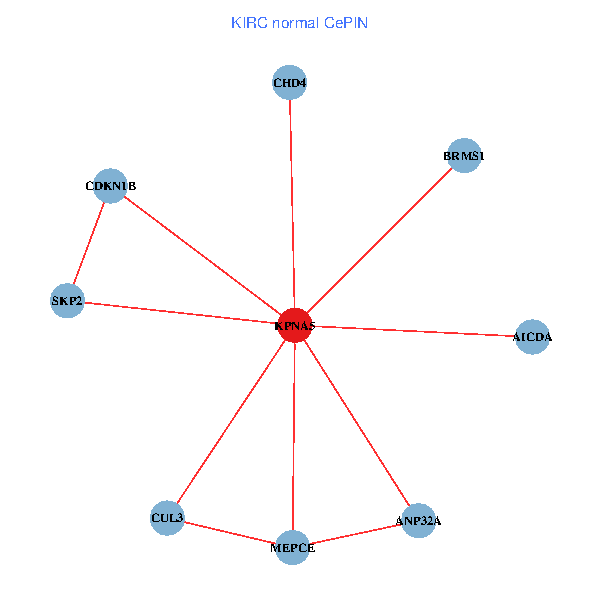
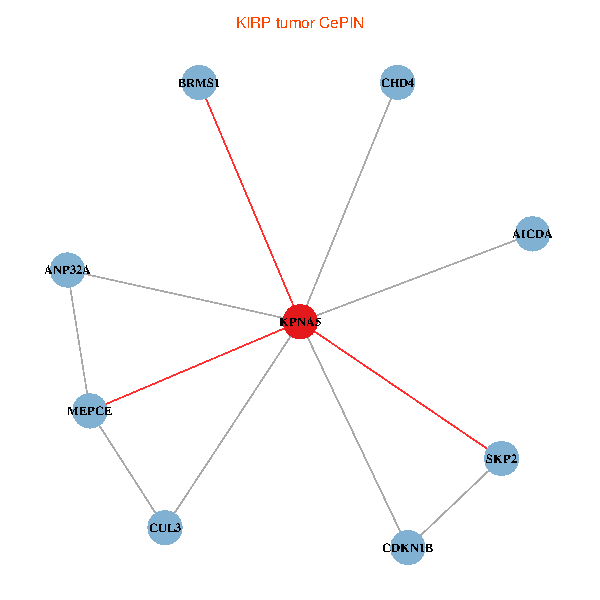
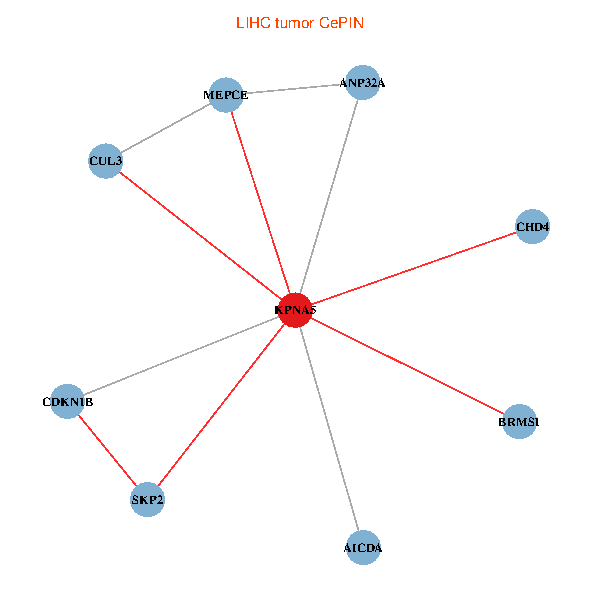
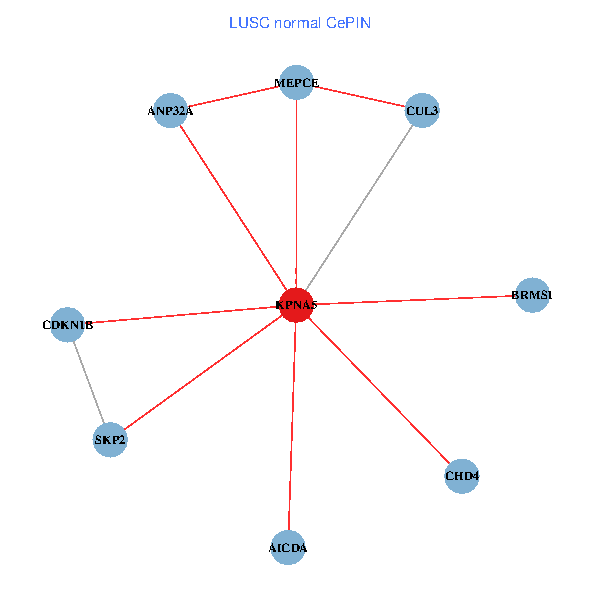
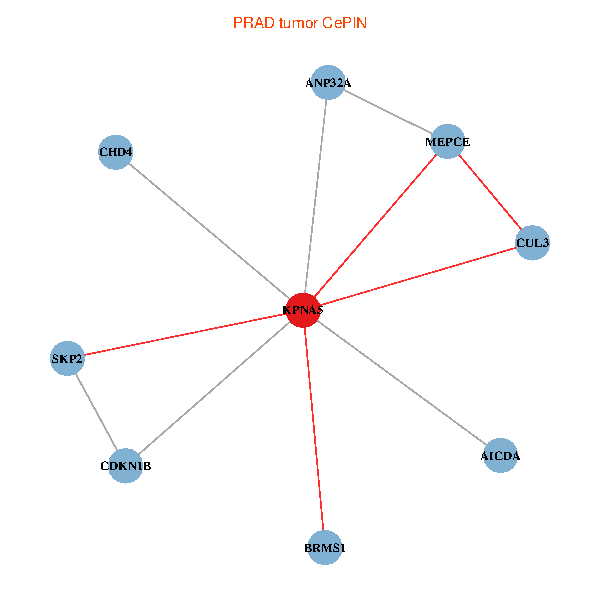
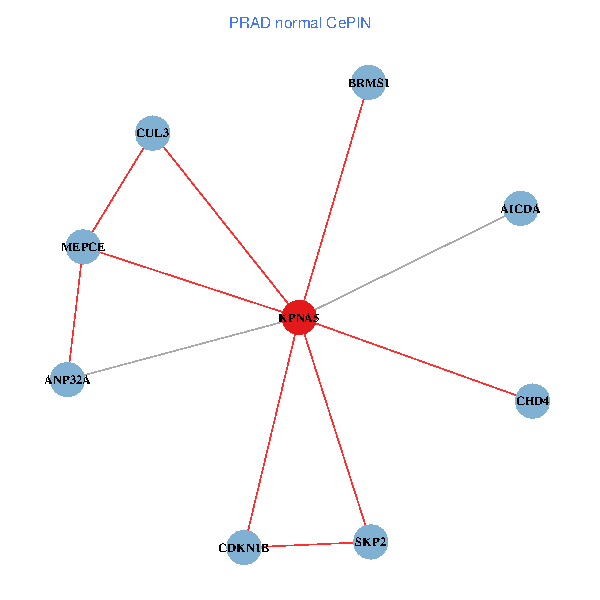
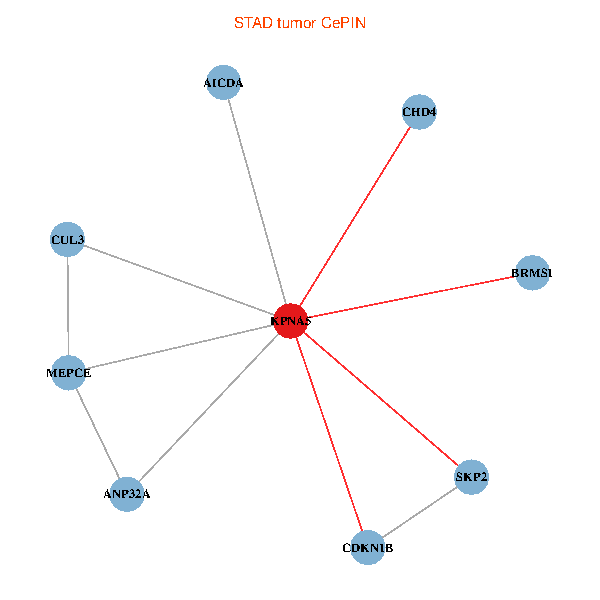
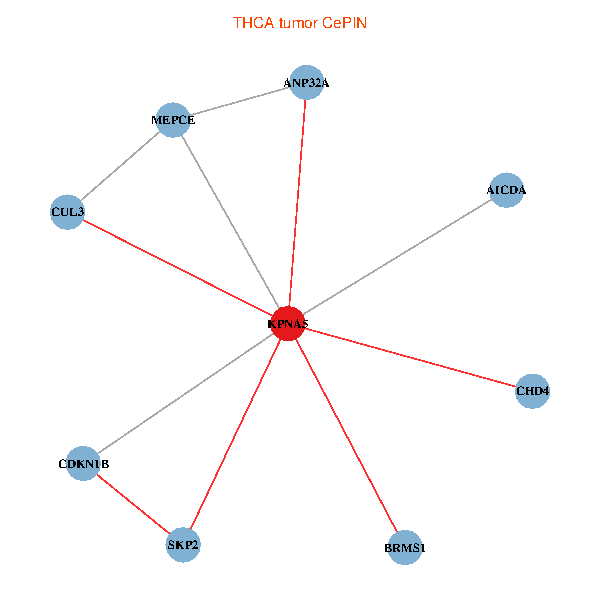
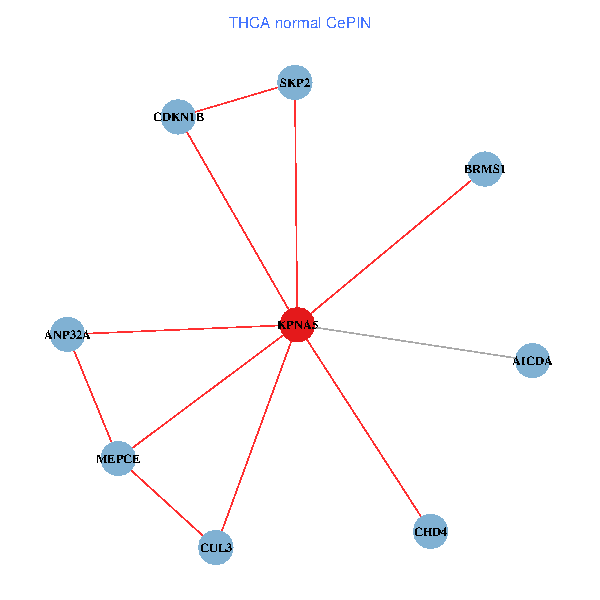
| Co-expressed gene networks based on protein-protein interaction data (CePIN) (TCGA IlluminaHiSeq_RNASeqV2, pan-cancer normalized log2(norm_counts+1) data, version 2016-08-16) (PINA2 ppi data) |
| BRCA (tumor) | BRCA (normal) |
| KPNA5, CUL3, CHD4, MEPCE, SKP2, ANP32A, CDKN1B, AICDA, BRMS1 (tumor) | KPNA5, CUL3, CHD4, MEPCE, SKP2, ANP32A, CDKN1B, AICDA, BRMS1 (normal) |
 |  |
| COAD (tumor) | COAD (normal) |
| KPNA5, CUL3, CHD4, MEPCE, SKP2, ANP32A, CDKN1B, AICDA, BRMS1 (tumor) | KPNA5, CUL3, CHD4, MEPCE, SKP2, ANP32A, CDKN1B, AICDA, BRMS1 (normal) |
 |  |
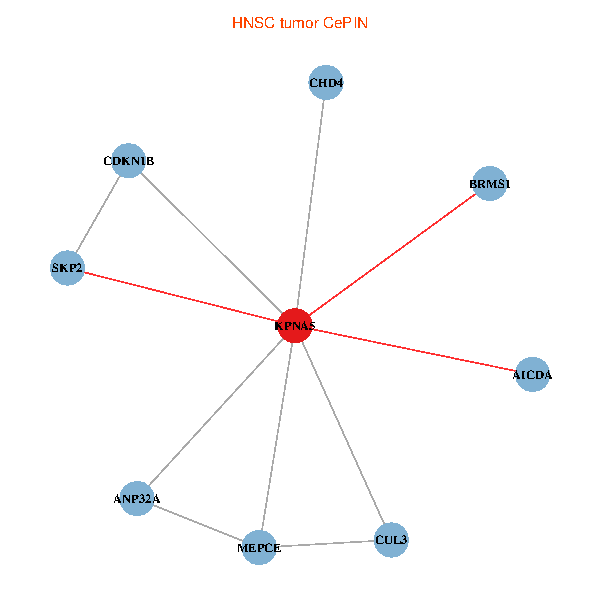
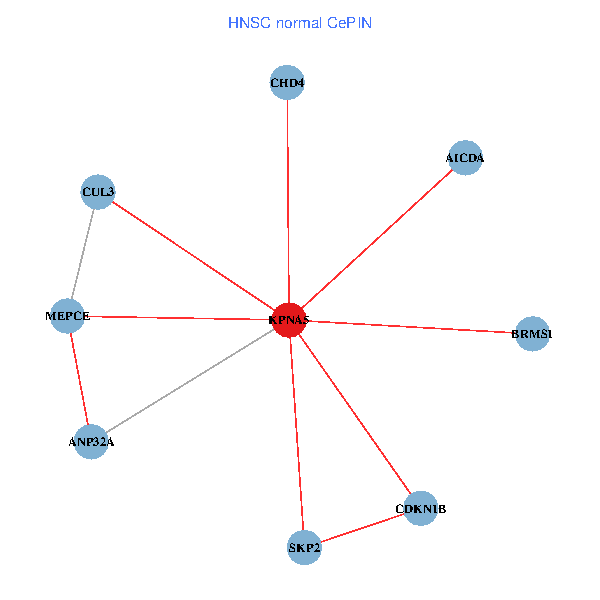
| HNSC (tumor) | HNSC (normal) |
| KPNA5, CUL3, CHD4, MEPCE, SKP2, ANP32A, CDKN1B, AICDA, BRMS1 (tumor) | KPNA5, CUL3, CHD4, MEPCE, SKP2, ANP32A, CDKN1B, AICDA, BRMS1 (normal) |
 |  |
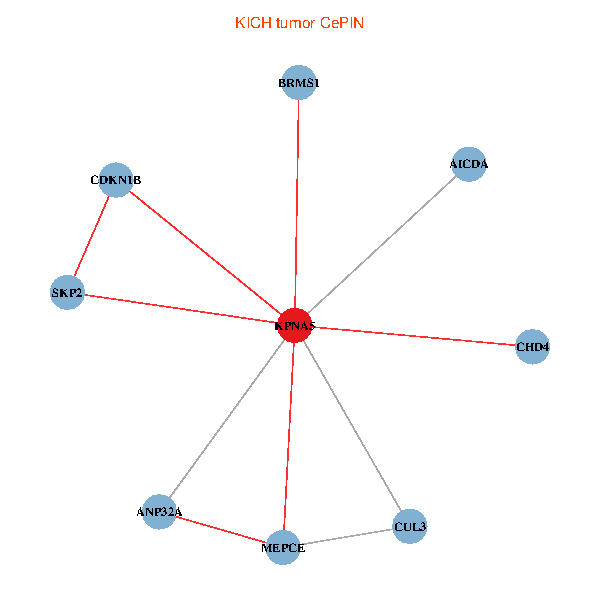
| KICH (tumor) | KICH (normal) |
| KPNA5, CUL3, CHD4, MEPCE, SKP2, ANP32A, CDKN1B, AICDA, BRMS1 (tumor) | KPNA5, CUL3, CHD4, MEPCE, SKP2, ANP32A, CDKN1B, AICDA, BRMS1 (normal) |
 |  |
| KIRC (tumor) | KIRC (normal) |
| KPNA5, CUL3, CHD4, MEPCE, SKP2, ANP32A, CDKN1B, AICDA, BRMS1 (tumor) | KPNA5, CUL3, CHD4, MEPCE, SKP2, ANP32A, CDKN1B, AICDA, BRMS1 (normal) |
 |  |
| KIRP (tumor) | KIRP (normal) |
| KPNA5, CUL3, CHD4, MEPCE, SKP2, ANP32A, CDKN1B, AICDA, BRMS1 (tumor) | KPNA5, CUL3, CHD4, MEPCE, SKP2, ANP32A, CDKN1B, AICDA, BRMS1 (normal) |
 |  |
| LIHC (tumor) | LIHC (normal) |
| KPNA5, CUL3, CHD4, MEPCE, SKP2, ANP32A, CDKN1B, AICDA, BRMS1 (tumor) | KPNA5, CUL3, CHD4, MEPCE, SKP2, ANP32A, CDKN1B, AICDA, BRMS1 (normal) |
 |  |
| LUAD (tumor) | LUAD (normal) |
| KPNA5, CUL3, CHD4, MEPCE, SKP2, ANP32A, CDKN1B, AICDA, BRMS1 (tumor) | KPNA5, CUL3, CHD4, MEPCE, SKP2, ANP32A, CDKN1B, AICDA, BRMS1 (normal) |
 |  |
| LUSC (tumor) | LUSC (normal) |
| KPNA5, CUL3, CHD4, MEPCE, SKP2, ANP32A, CDKN1B, AICDA, BRMS1 (tumor) | KPNA5, CUL3, CHD4, MEPCE, SKP2, ANP32A, CDKN1B, AICDA, BRMS1 (normal) |
 |  |
| PRAD (tumor) | PRAD (normal) |
| KPNA5, CUL3, CHD4, MEPCE, SKP2, ANP32A, CDKN1B, AICDA, BRMS1 (tumor) | KPNA5, CUL3, CHD4, MEPCE, SKP2, ANP32A, CDKN1B, AICDA, BRMS1 (normal) |
 |  |
| STAD (tumor) | STAD (normal) |
| KPNA5, CUL3, CHD4, MEPCE, SKP2, ANP32A, CDKN1B, AICDA, BRMS1 (tumor) | KPNA5, CUL3, CHD4, MEPCE, SKP2, ANP32A, CDKN1B, AICDA, BRMS1 (normal) |
 |  |
| THCA (tumor) | THCA (normal) |
| KPNA5, CUL3, CHD4, MEPCE, SKP2, ANP32A, CDKN1B, AICDA, BRMS1 (tumor) | KPNA5, CUL3, CHD4, MEPCE, SKP2, ANP32A, CDKN1B, AICDA, BRMS1 (normal) |
 |  |
| Top |
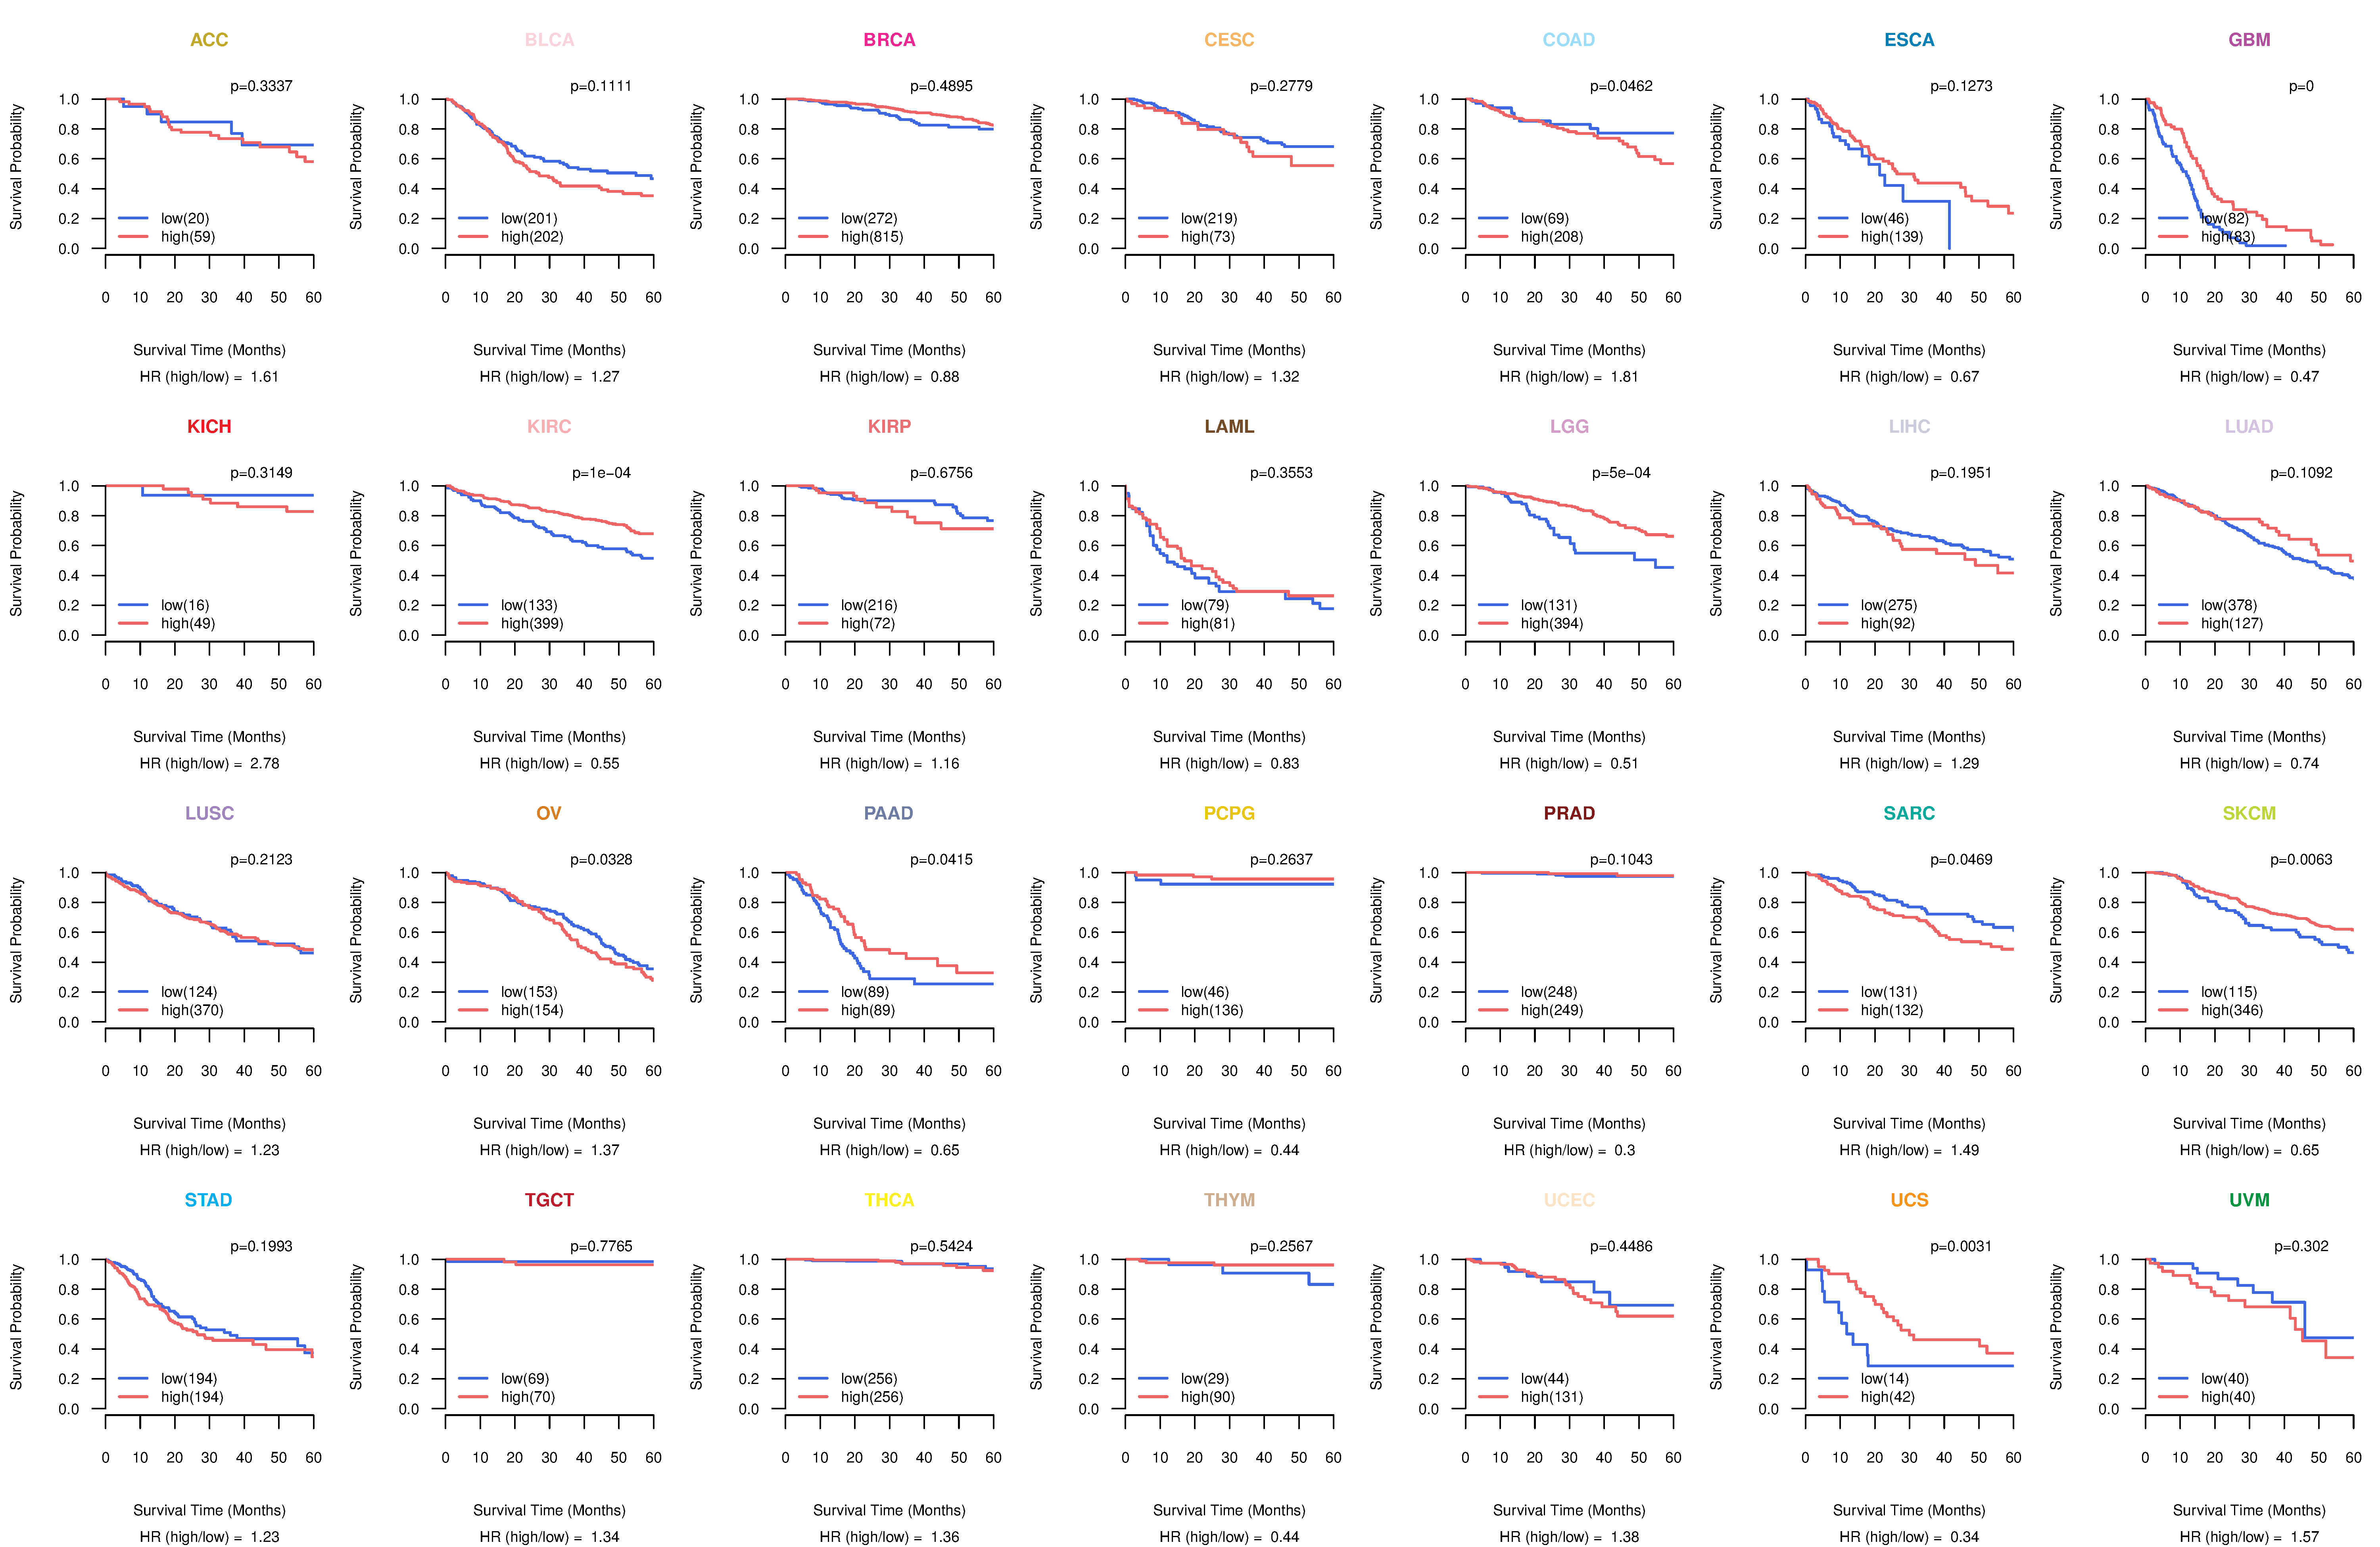
| TissGeneProg for KPNA5 |
| Kaplan-Meier plots with logrank tests of overall survival (OS) using 28 cancer types (TCGA IlluminaHiSeq_RNASeqV2, pan-cancer normalized log2(norm_counts+1) data, version 2016-08-16) (TCGA clinicalMatrix, phenotype data, version 2016-04-27) * Click on the image to enlarge it in a new window. |
 |
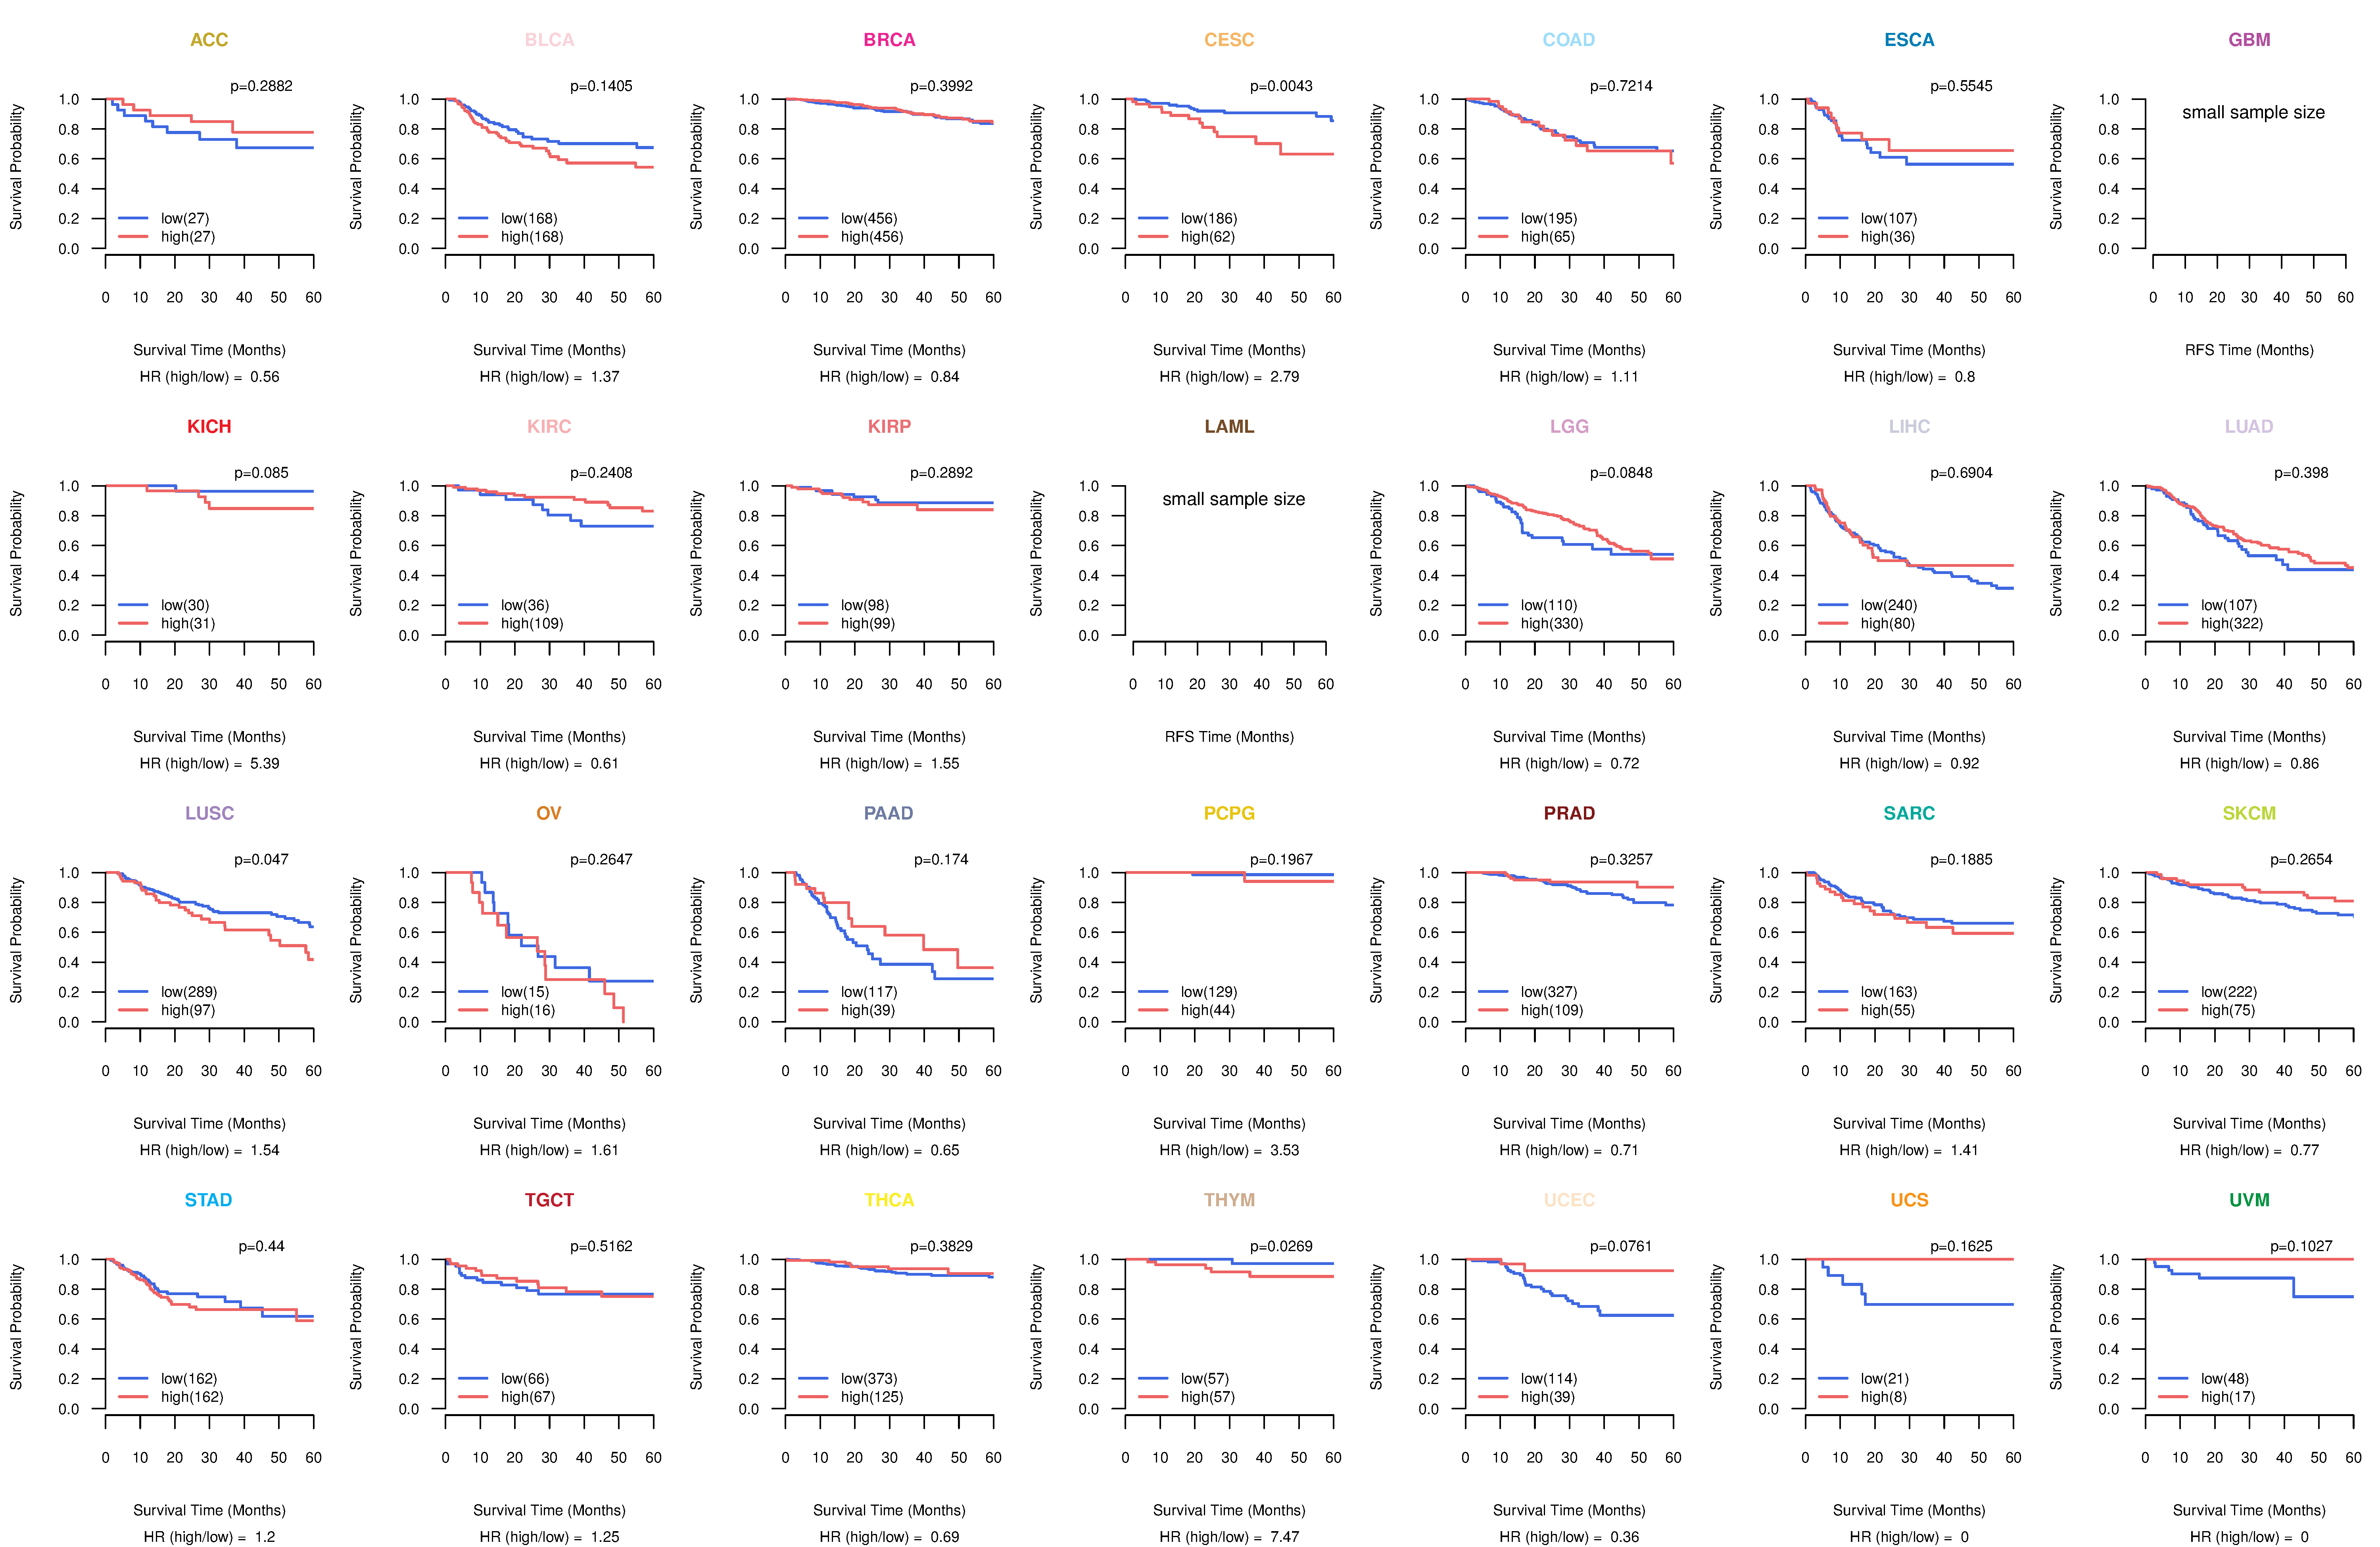
| Kaplan-Meier plots with logrank test of relapse free survival (RFS) using 28 cancer types (TCGA IlluminaHiSeq_RNASeqV2, pan-cancer normalized log2(norm_counts+1) data, version 2016-08-16) (TCGA clinicalMatrix, phenotype data, version 2016-04-27) * Click on the image enlarge it in a new window. |
 |
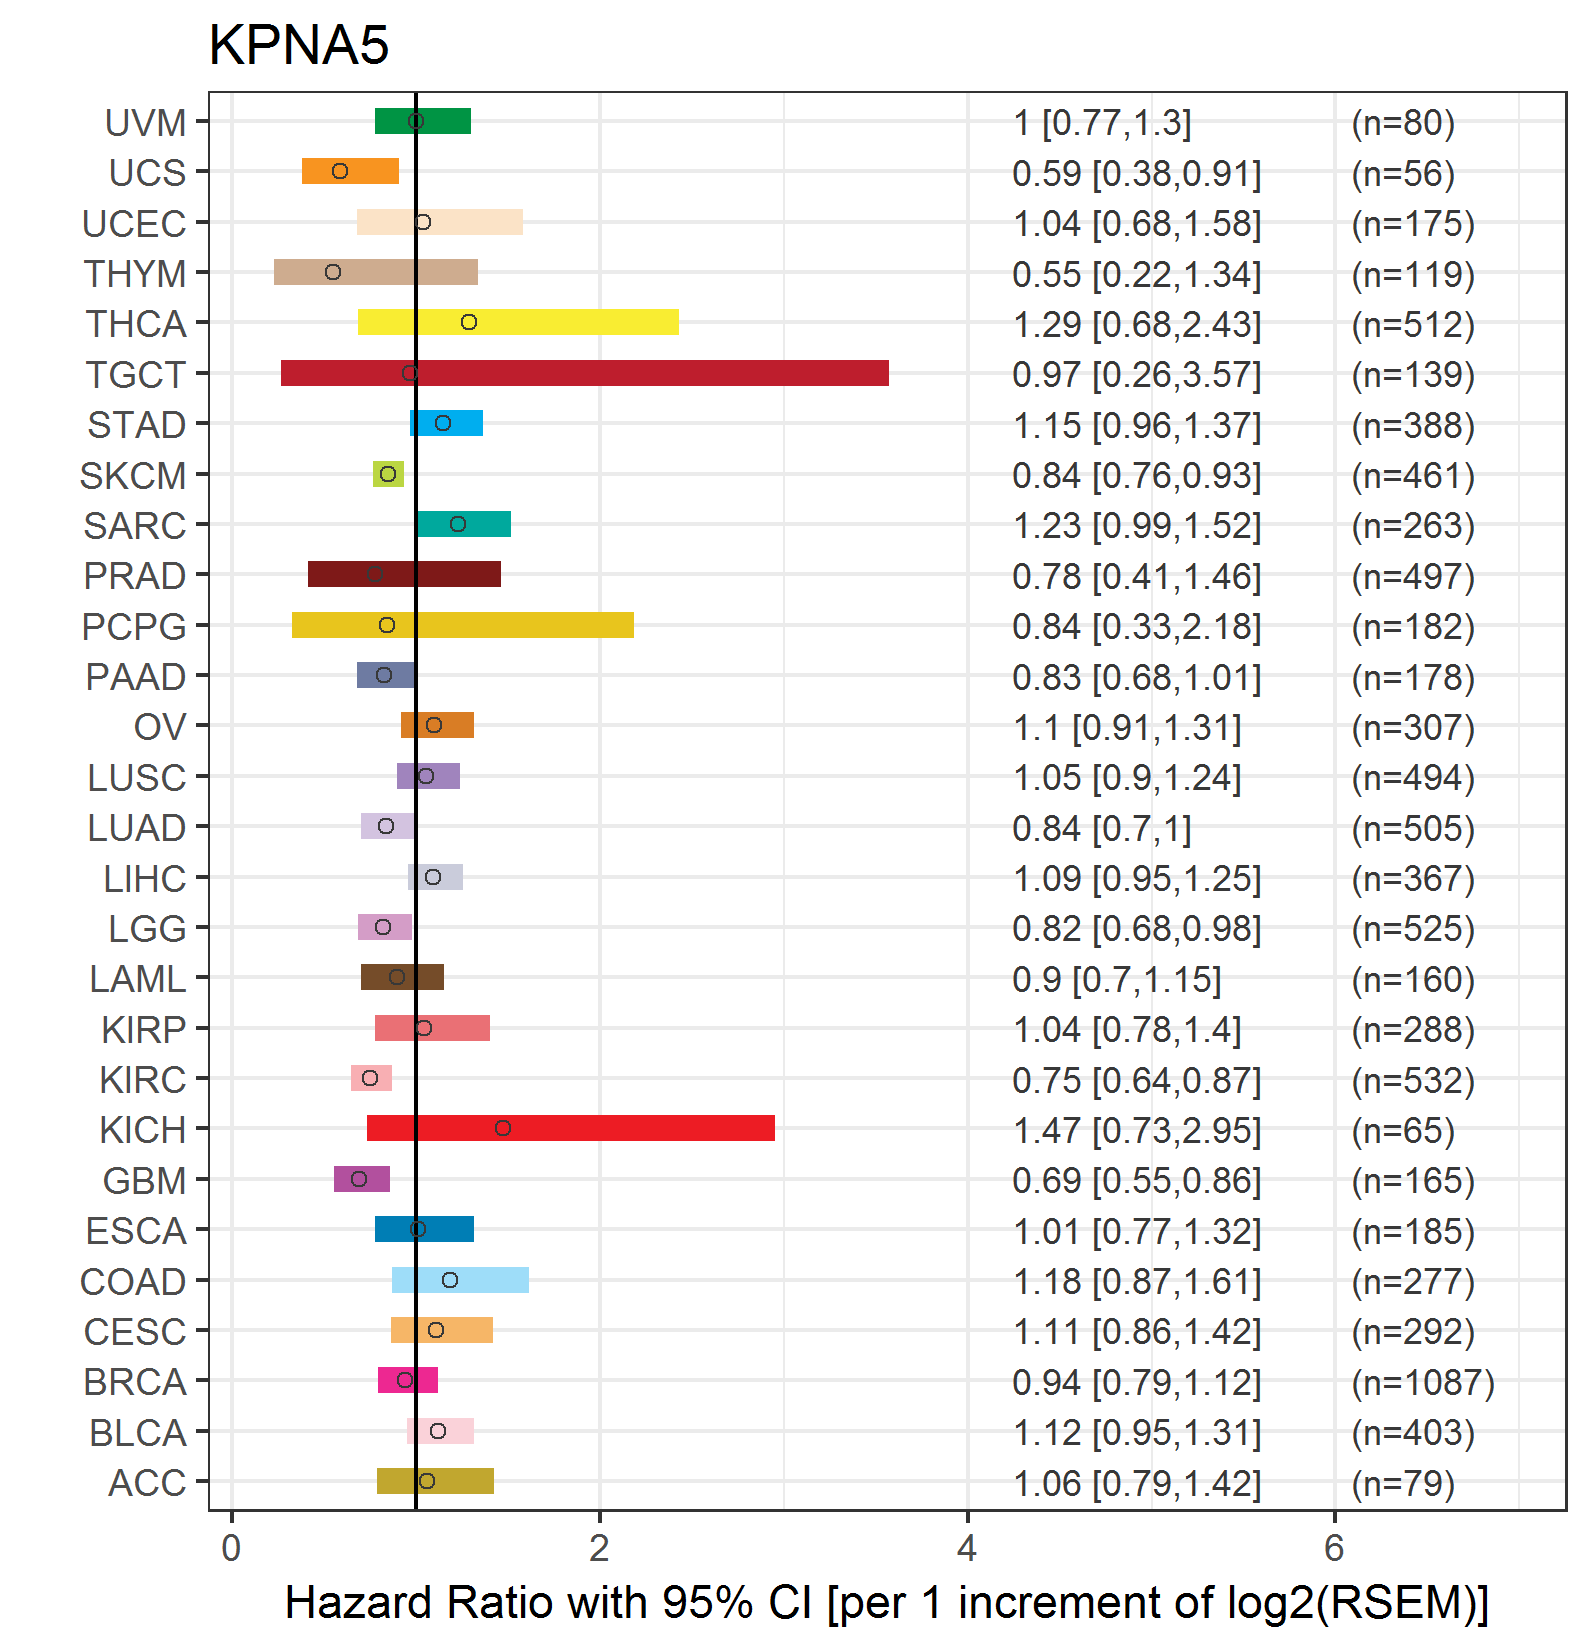
| Forest plot of Cox proportional hazard ratio (HR) and 95% CI of overall survival (OS) using 28 cancer types (TCGA IlluminaHiSeq_RNASeqV2, pan-cancer normalized log2(norm_counts+1) data, version 2016-08-16) (TCGA clinicalMatrix, phenotype data, version 2016-04-27) * Click on the image enlarge it in a new window. |
 |
| Forest plot of Cox proportional hazard ratio (HR) and 95% CI of relapse free survival (RFS) using 28 cancer types (TCGA IlluminaHiSeq_RNASeqV2, pan-cancer normalized log2(norm_counts+1) data, version 2016-08-16) (TCGA clinicalMatrix, phenotype data, version 2016-04-27) * Click on the image enlarge it in a new window. |
 |
| Top |
| TissGeneClin for KPNA5 |
| TissGeneDrug for KPNA5 |
| Drug information targeting TissGene (DrugBank Version 5.0.6, 2017-04-01) |
| DrugBank ID | Drug name | Drug activity | Drug type | Drug status |
| Top |
| TissGeneDisease for KPNA5 |
| Disease information associated with TissGene (DisGeNet, 2016-06-01) |
| Disease ID | Disease name | # pubmeds | Source |
|
Copyright 2016-Present - The University of Texas Health Science Center at Houston (UTHealth) Web File Viewing | How to Report, Fraud, Waste and Abuse | State of Texas | Statewide Search | Texas Homeland Security | Site Policies |