 |
| |
| |
| |
| |
| |
| |
|

| TissGeneSummary for SLC22A25 |
 Gene summary Gene summary |
| Basic gene information | Gene symbol | SLC22A25 |
| Gene name | solute carrier family 22, member 25 | |
| Synonyms | HIMTP|UST6 | |
| Cytomap | UCSC genome browser: 11q12.3 | |
| Type of gene | protein-coding | |
| RefGenes | NM_199352.3, | |
| Description | MGI:2442751, MGI:2385316, MGI:3042283, MGI:3645714, MGI:3605624, MGI:2442750organic anion transporter UST6putative UST1-like organic anion transportersolute carrier family 22 member 25 | |
| Modification date | 20141207 | |
| dbXrefs | MIM : 610792 | |
| HGNC : HGNC | ||
| Ensembl : ENSG00000196600 | ||
| HPRD : 14198 | ||
| Vega : OTTHUMG00000165340 | ||
| Protein | UniProt: go to UniProt's Cross Reference DB Table | |
| Expression | CleanEX: HS_SLC22A25 | |
| BioGPS: 387601 | ||
| Pathway | NCI Pathway Interaction Database: SLC22A25 | |
| KEGG: SLC22A25 | ||
| REACTOME: SLC22A25 | ||
| Pathway Commons: SLC22A25 | ||
| Context | iHOP: SLC22A25 | |
| ligand binding site mutation search in PubMed: SLC22A25 | ||
| UCL Cancer Institute: SLC22A25 | ||
| Assigned class in TissGDB* | C | |
| Included tissue-specific gene expression resources | HPA,GTEx | |
| Specific-tissues in normal samples (assigned by TissGDB using HPA, TiGER, and GTEx) | Liver | |
| Cancer types related to the specific-tissues in cancer samples (assigned by TissGDB using TCGA) | LIHC | |
| Reference showing the relevant tissue of SLC22A25 | ||
| Description by TissGene annotations | Significant down-regulated DEG TissgsKTS CNV lost TissGeneKTS | |
| * Class A consists of genes with literature evidence and is part of the cTissGenes. Class B consists of only cTissGenes without additional evidence. The remaining genes belong to Class C. |
| Gene ontology having evidence of Inferred from Direct Assay (IDA) from Entrez |
| GO ID | GO term | PubMed ID |
| Top |
| TissGeneExp for SLC22A25 |
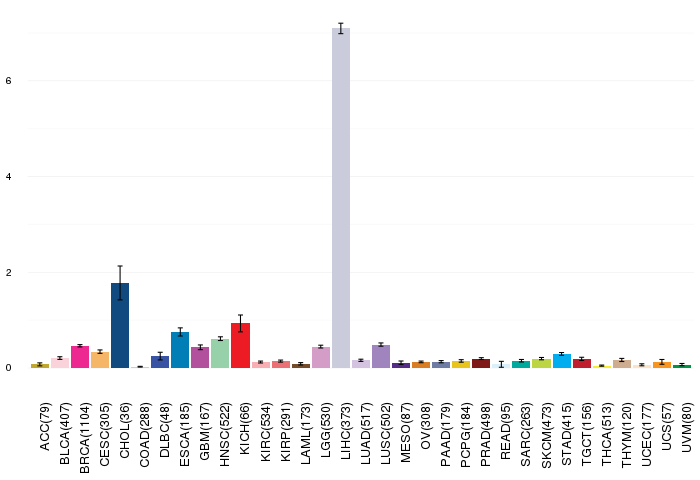
| Gene expressions across 28 cancer types (X-axis: cancer type and Y-axis: log2(norm_counts+1)) (TCGA IlluminaHiSeq_RNASeqV2, pan-cancer normalized log2(norm_counts+1) data, version 2016-08-16) |
 |
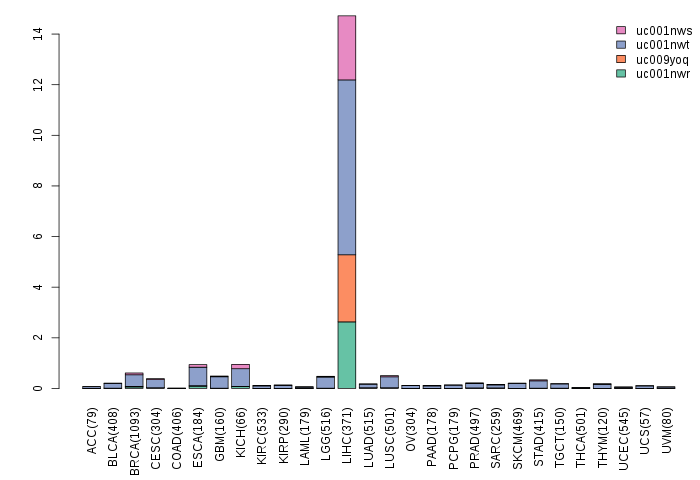
| Gene isoform expressions across 28 cancer types (X-axis: cancer type and Y-axis: log2(norm_counts+1)) (TCGA pan-cancer tcga_rsem_isoform_tpm, version 2016-09-01) |
 |
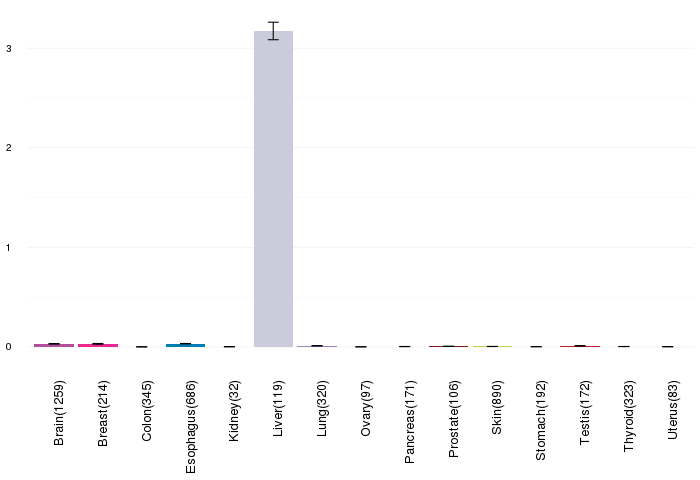
| Gene expressions across normal tissues of GTEx data (GTEx GTEx_Analysis_v6_RNA-seq_RNA-SeQCv1.1.8_gene_rpkm.gct) - Here, we shows the matched tissue types only among our 28 cancer types. |
 |
| Different expressions across 14 cancer types with more than 10 samples between matched tumors and normals (X-axis: cancer type and Y-axis: log2(norm_counts+1)) (TCGA IlluminaHiSeq_RNASeqV2, pan-cancer normalized log2(norm_counts+1) data, version 2016-08-16) |
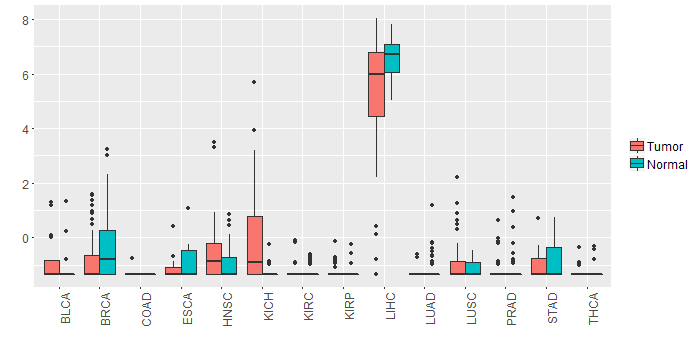 |
| - Significantly differentially expressed cancer types and information. (|Fold change|>1 and FDR<0.05) |
| Cancer type | Mean(exp) in tumor | Mean(exp) in matched normal | Log2FC | P-val. | FDR |
| KICH | 0.071073756 | -1.241226244 | 1.3123 | 0.00238 | 0.004816823 |
| LIHC | 5.351051756 | 6.588589756 | -1.237538 | 0.000432 | 0.001275894 |
| Top |
| TissGene-miRNA for SLC22A25 |
| Significantly anti-correlated miRNAs of TissGene across 28 cancer types (Gene-miRNA relations from TargetScanHuman Relsease 7.1, Conserved_Site_Context_Scores.txt.zip, 06.01.2016) (TCGA IlluminaHiSeq_miRNASeq, log2(RPM+1) data, version 2016-11-21) (TCGA IlluminaHiSeq_RNASeqV2, log2(normalized_count+1) data, version 2016-08-16) (Spearman’s Rank Correlation (p-value<0.05 and coefficient<-0.25)) |
| Cancer type | miRNA id | miRNA accession | P-val. | Coeff. | # samples |
| Top |
| TissGeneMut for SLC22A25 |
| TissGeneSNV for SLC22A25 |
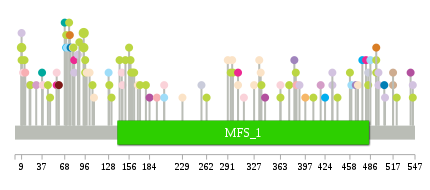
| nsSNV counts per each loci. Different colors of circles represent different cancer types. Circle size denotes number of samples. (TCGA somatic mutation (SNPs and small INDELs) data, version 2016-04-25) * Click on the image to enlarge it in a new window. |
 |
 |
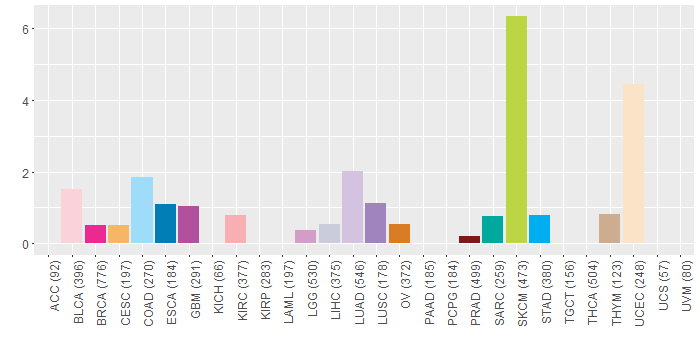
| Somatic nucleotide variants of TissGene across 28 cancer types (X-axis: cancer type and Y-axis: % of mutated samples) The numbers in parentheses are numbers of samples with mutation (nsSNVs). (TCGA somatic mutation (SNPs and small INDELs) data, version 2016-04-25) |
 |
| - nsSNVs sorted by frequency. |
| AAchange | Cancer type | # samples |
| p.P94L | SKCM | 3 |
| p.Q9* | SKCM | 2 |
| p.P94S | SKCM | 2 |
| p.Q382H | LUSC | 1 |
| p.P363L | SKCM | 1 |
| p.E163K | SKCM | 1 |
| p.S408N | SKCM | 1 |
| p.P497H | LUAD | 1 |
| p.P497T | LUAD | 1 |
| p.P60H | PRAD | 1 |
| p.E517* | THYM | 1 |
| p.L337F | SKCM | 1 |
| p.A505V | ESCA | 1 |
| p.P106S | SKCM | 1 |
| p.I460N | COAD | 1 |
| p.K334* | UCEC | 1 |
| p.S336Y | UCEC | 1 |
| p.C88Y | SKCM | 1 |
| p.F204L | BLCA | 1 |
| p.D168E | UCEC | 1 |
| p.I506M | LUAD | 1 |
| p.Q9H | DLBC | 1 |
| p.K348E | HNSC | 1 |
| p.A483S | LIHC | 1 |
| p.P128T | COAD | 1 |
| p.D70N | SKCM | 1 |
| p.F79L | UCEC | 1 |
| p.L171F | SKCM | 1 |
| p.N161H | SKCM | 1 |
| p.S81* | BRCA | 1 |
| p.K297T | UCEC | 1 |
| p.R494X | SKCM | 1 |
| p.S146A | BLCA | 1 |
| p.D313H | BLCA | 1 |
| p.F229L | UCEC | 1 |
| p.A483T | SKCM | 1 |
| p.D70N | STAD | 1 |
| p.E458K | SKCM | 1 |
| p.S81T | LUAD | 1 |
| p.G159E | SKCM | 1 |
| p.Q9X | SKCM | 1 |
| p.N102Y | UCEC | 1 |
| p.R305K | BRCA | 1 |
| p.P541A | GBM | 1 |
| p.E298K | SKCM | 1 |
| p.D147H | BLCA | 1 |
| p.F475S | STAD | 1 |
| p.R74K | SKCM | 1 |
| p.G441S | SKCM | 1 |
| p.D80G | SKCM | 1 |
| p.L384F | SKCM | 1 |
| p.L98F | UCEC | 1 |
| p.F385L | KIRC | 1 |
| p.F204L | COAD | 1 |
| p.R494Q | OV | 1 |
| p.T108M | UCEC | 1 |
| p.E57Q | BLCA | 1 |
| p.E132K | SKCM | 1 |
| p.Q9K | LUAD | 1 |
| p.P522L | SKCM | 1 |
| p.M21I | SKCM | 1 |
| p.S76Y | ESCA | 1 |
| p.R37C | SARC | 1 |
| p.I424T | STAD | 1 |
| p.S179F | SKCM | 1 |
| p.G14E | KIRC | 1 |
| p.D63Y | HNSC | 1 |
| p.R434H | LUAD | 1 |
| p.G375E | SKCM | 1 |
| p.M486V | COAD | 1 |
| p.G129S | SKCM | 1 |
| p.P397L | CESC | 1 |
| p.R48H | READ | 1 |
| p.F27L | HNSC | 1 |
| p.T418I | LGG | 1 |
| p.K182E | HNSC | 1 |
| p.F38L | BLCA | 1 |
| p.A184T | GBM | 1 |
| p.A154D | READ | 1 |
| p.G295S | SKCM | 1 |
| p.S544N | SKCM | 1 |
| p.C139F | READ | 1 |
| p.Q96* | SKCM | 1 |
| p.R11T | BLCA | 1 |
| p.L45F | SKCM | 1 |
| p.A71S | COAD | 1 |
| p.L151I | SKCM | 1 |
| p.E517X | THYM | 1 |
| p.R494* | SKCM | 1 |
| p.I75T | OV | 1 |
| p.A86G | LUAD | 1 |
| p.R305M | UCEC | 1 |
| p.Q262H | SKCM | 1 |
| p.Q96H | SKCM | 1 |
| p.R434P | LUAD | 1 |
| p.P363T | BLCA | 1 |
| p.R48C | SKCM | 1 |
| p.T389I | LUAD | 1 |
| p.P143S | SKCM | 1 |
| p.I255V | LIHC | 1 |
| p.L6I | READ | 1 |
| p.K291T | UCEC | 1 |
| p.M156I | SKCM | 1 |
| p.G466V | LUSC | 1 |
| p.R342H | GBM | 1 |
| p.G480E | BRCA | 1 |
| p.M158I | SKCM | 1 |
| p.T469I | UCEC | 1 |
| p.E327* | UCEC | 1 |
| p.G466E | HNSC | 1 |
| p.P194S | KIRC | 1 |
| p.V29I | LGG | 1 |
| p.S13F | SKCM | 1 |
| p.S68C | SARC | 1 |
| p.S544I | LUAD | 1 |
| p.D57Y | BRCA | 1 |
| p.Q20K | LUAD | 1 |
| Top |
| TissGeneCNV for SLC22A25 |
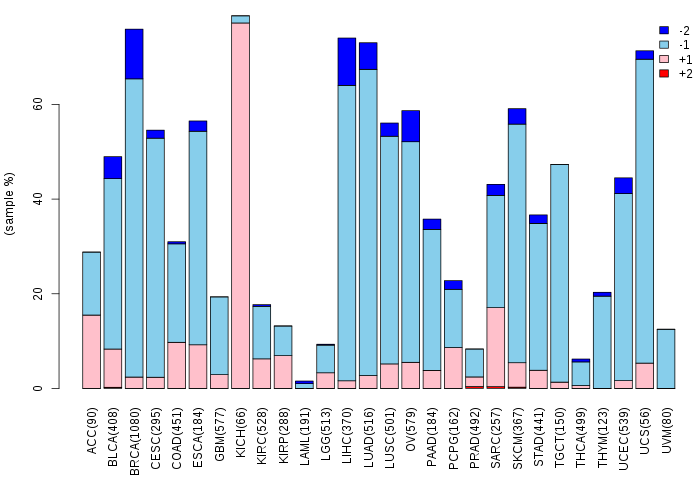
| Copy number variations of TissGene across 28 cancer types (X-axis: cancer type and Y-axis: % of CNV samples) (TCGA Gistic2_CopyNumber_Gistic2_all_data_by_genes, Gistic2 copy number data, version 2016-08-16) |
 |
| Top |
| TissGeneFusions for SLC22A25 |
| Fusion genes including TissGene (ChimerDB 3.0, 2016-12-01 and TCGA fusion Portal 2015-12-01) |
| Database | Src | Cancer type | Sample | Fusion gene | ORF | 5'-gene BP | 3'-gene BP |
| Chimerdb3.0 | FusionScan | LUAD | TCGA-97-8174-01A | SLC22A25-PACS1 | Out-of-Frame | chr11:62995932 | chr11:65998018 |
| TCGAfusionPortal | PRADA | LUAD | TCGA-97-8174-01A | SLC22A25-PACS1 | Out-of-frame | Chr11:62995933 | Chr11:65998019 |
| Top |
| TissGeneNet for SLC22A25 |
| Co-expressed gene networks based on protein-protein interaction data (CePIN) (TCGA IlluminaHiSeq_RNASeqV2, pan-cancer normalized log2(norm_counts+1) data, version 2016-08-16) (PINA2 ppi data) |
| Top |
| TissGeneProg for SLC22A25 |
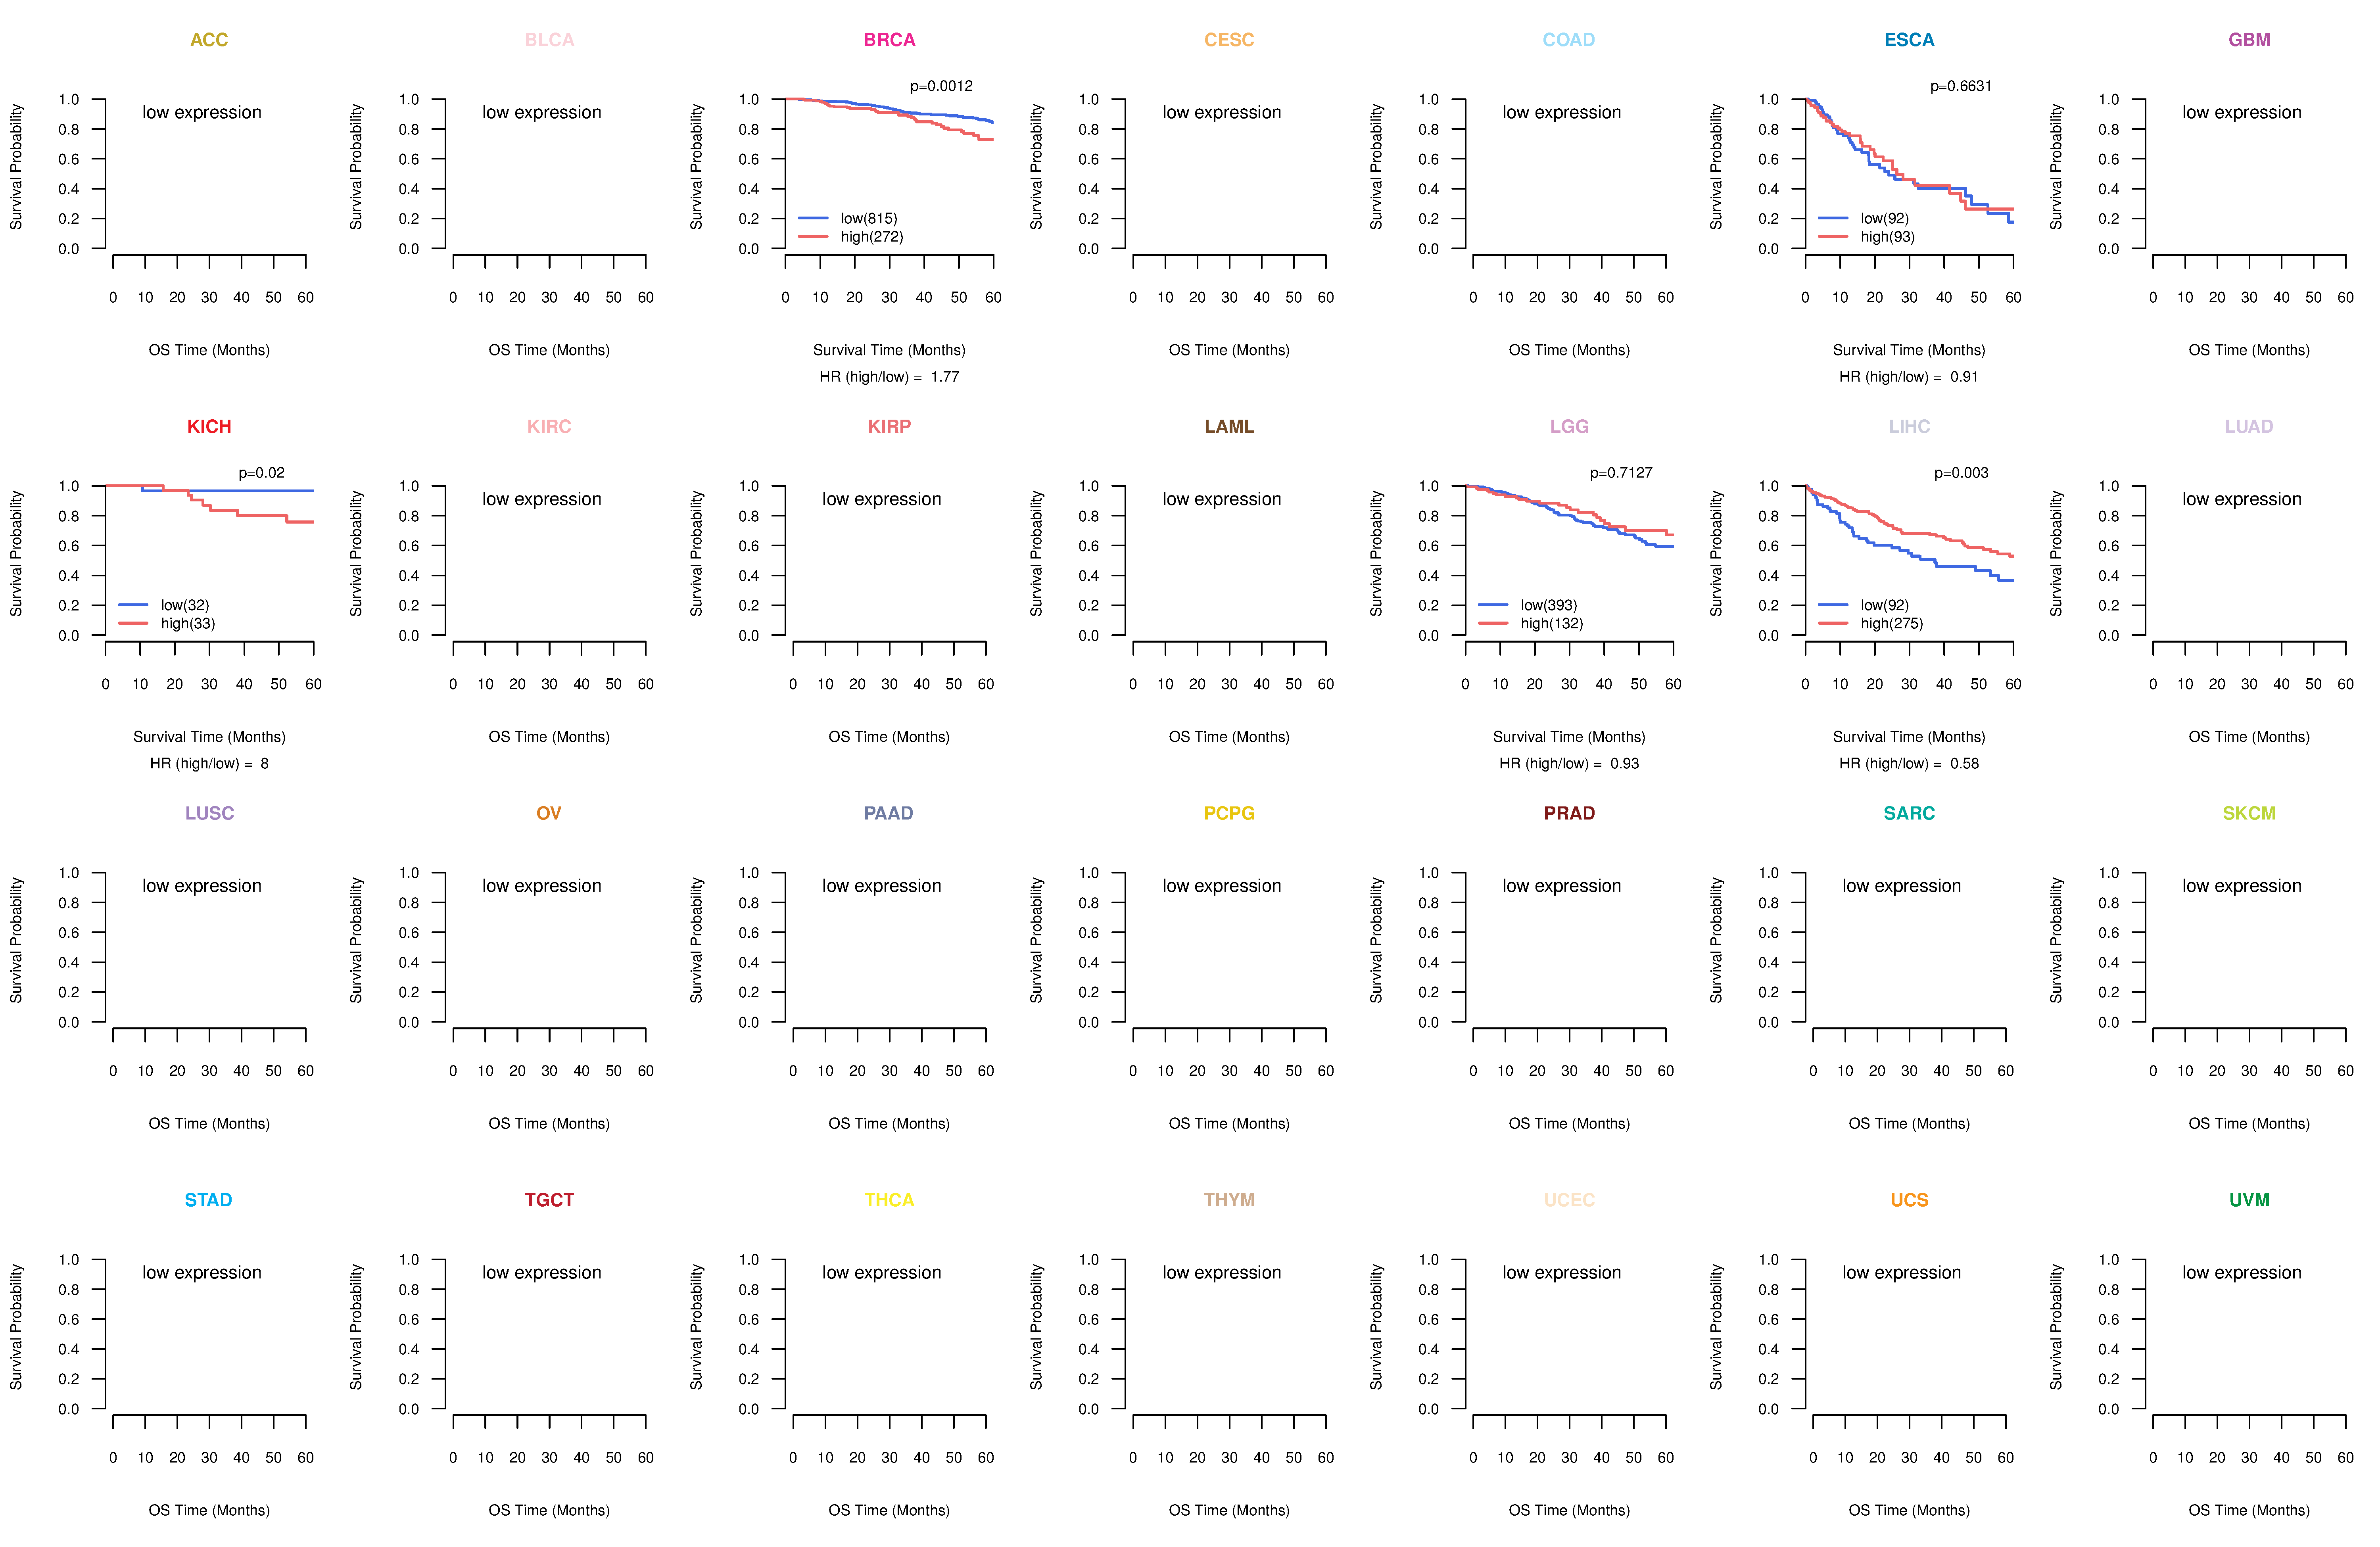
| Kaplan-Meier plots with logrank tests of overall survival (OS) using 28 cancer types (TCGA IlluminaHiSeq_RNASeqV2, pan-cancer normalized log2(norm_counts+1) data, version 2016-08-16) (TCGA clinicalMatrix, phenotype data, version 2016-04-27) * Click on the image to enlarge it in a new window. |
 |
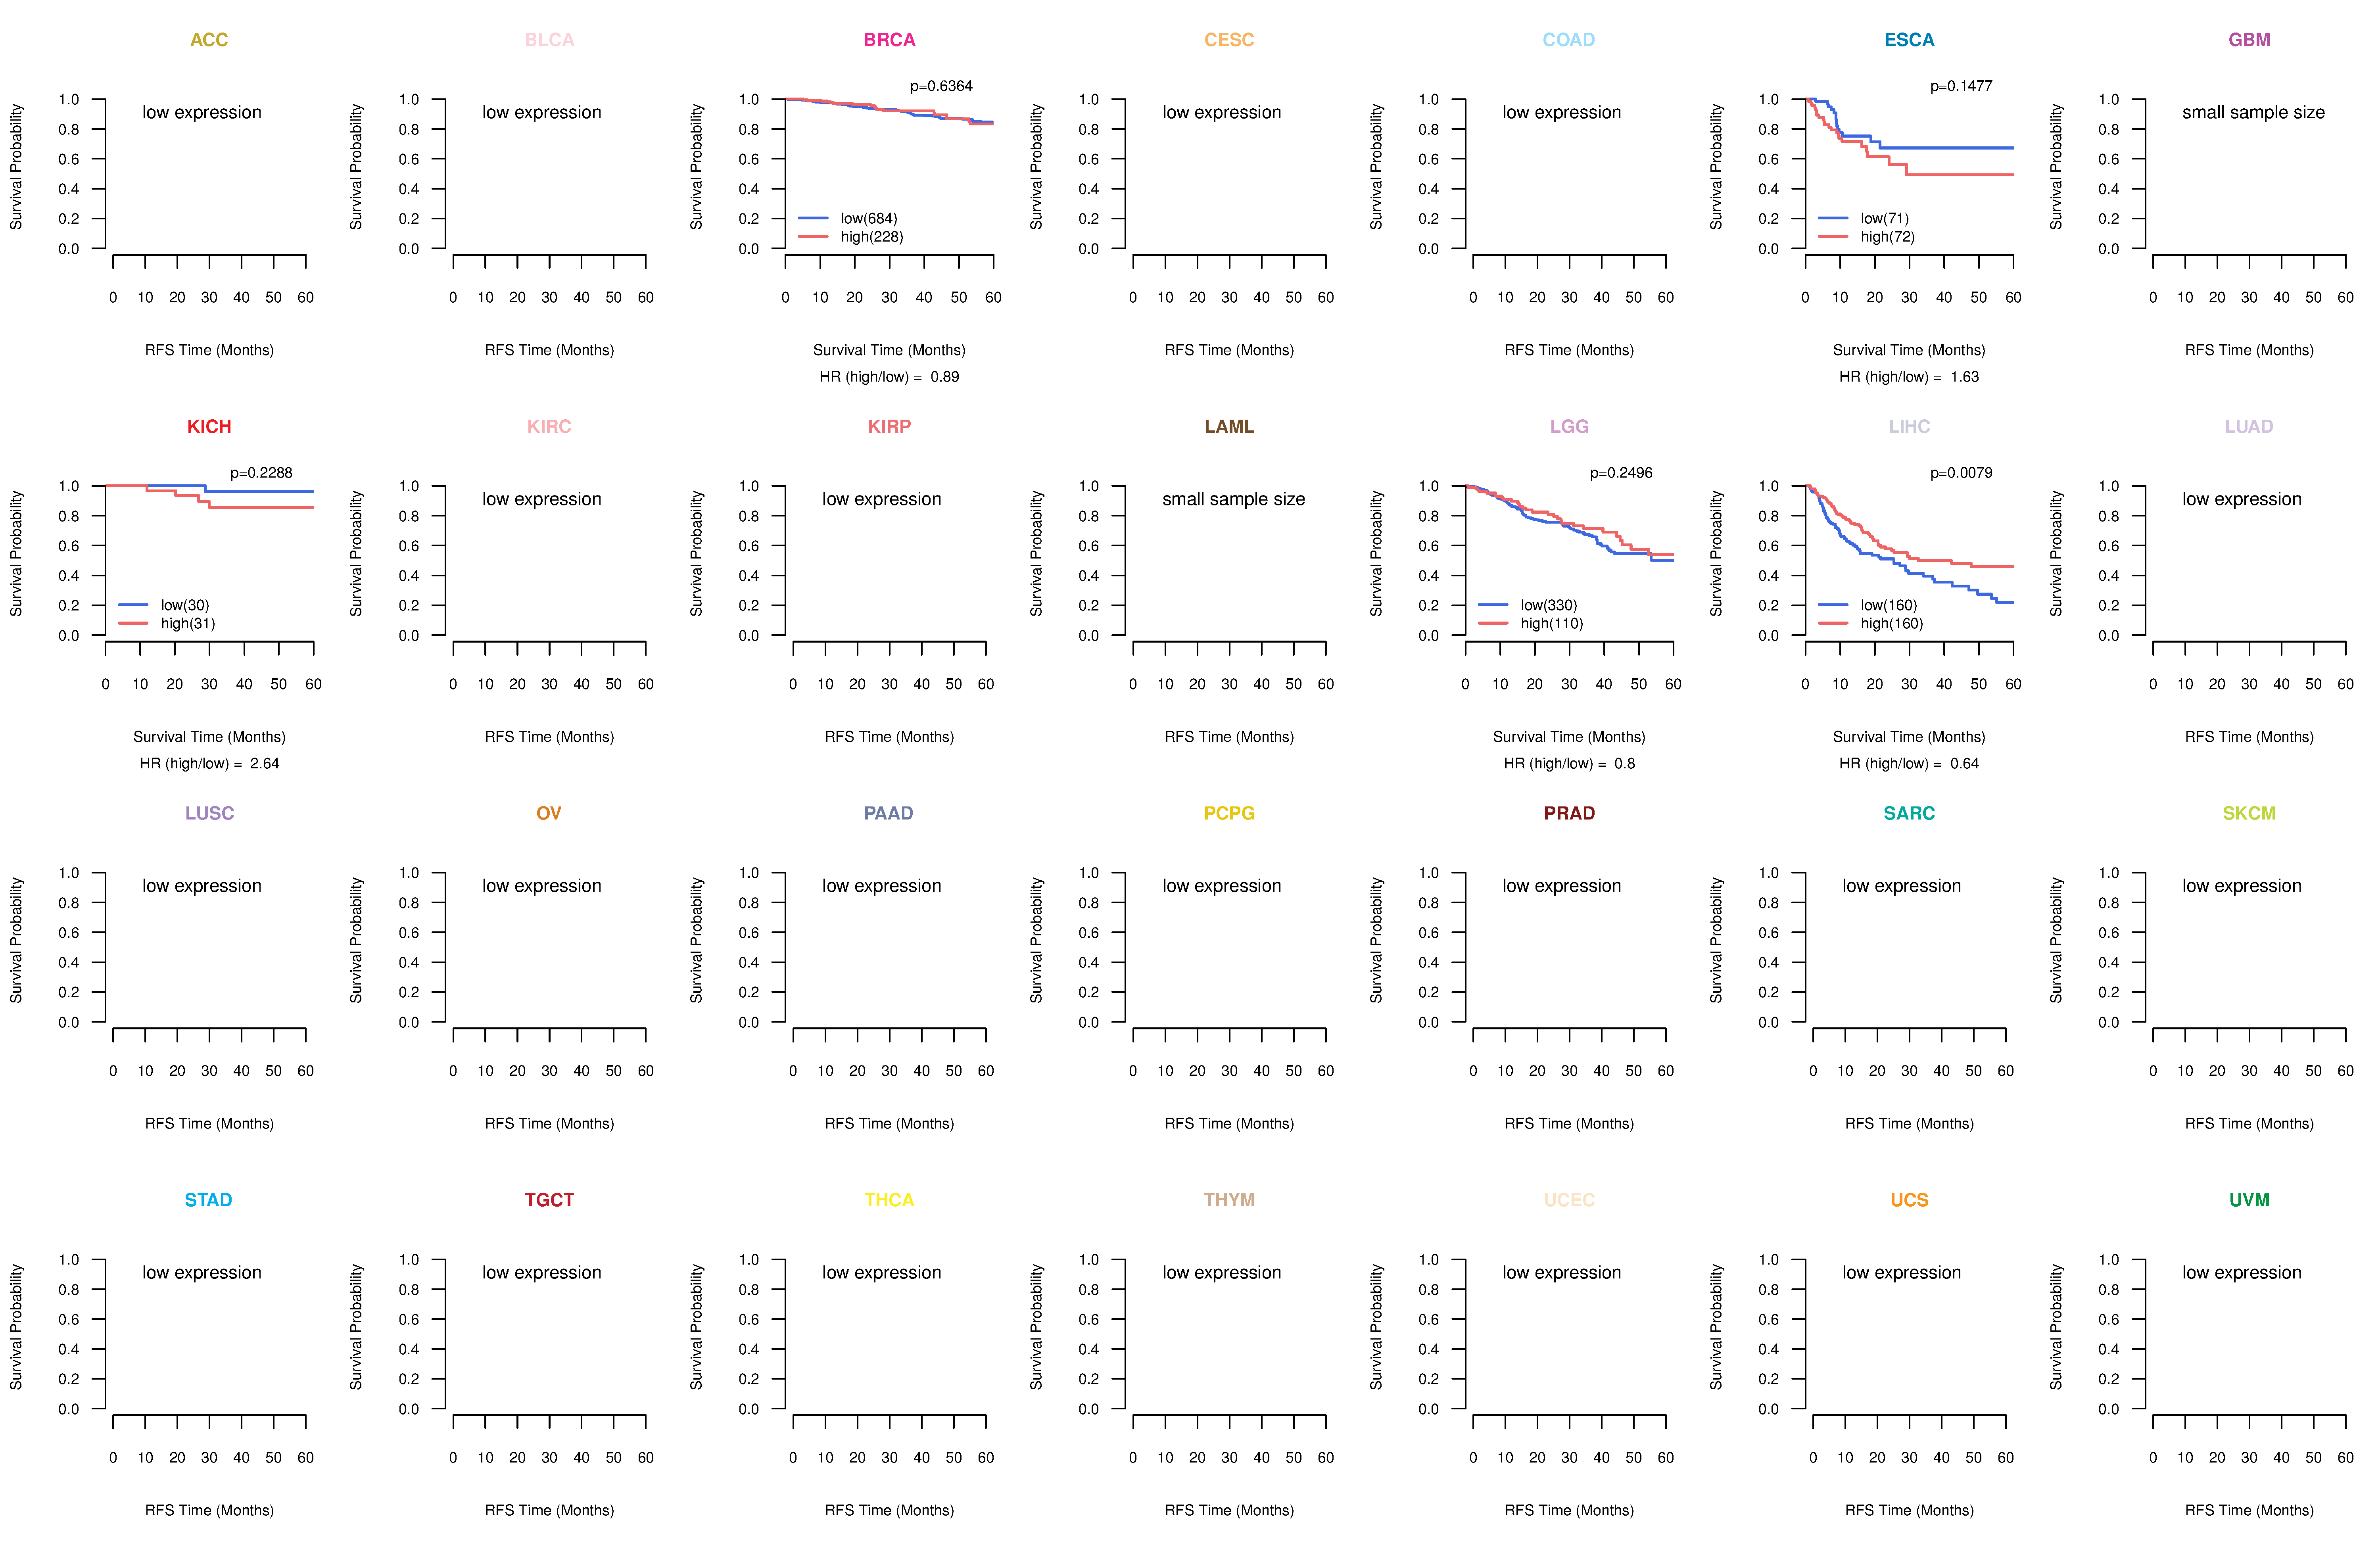
| Kaplan-Meier plots with logrank test of relapse free survival (RFS) using 28 cancer types (TCGA IlluminaHiSeq_RNASeqV2, pan-cancer normalized log2(norm_counts+1) data, version 2016-08-16) (TCGA clinicalMatrix, phenotype data, version 2016-04-27) * Click on the image enlarge it in a new window. |
 |
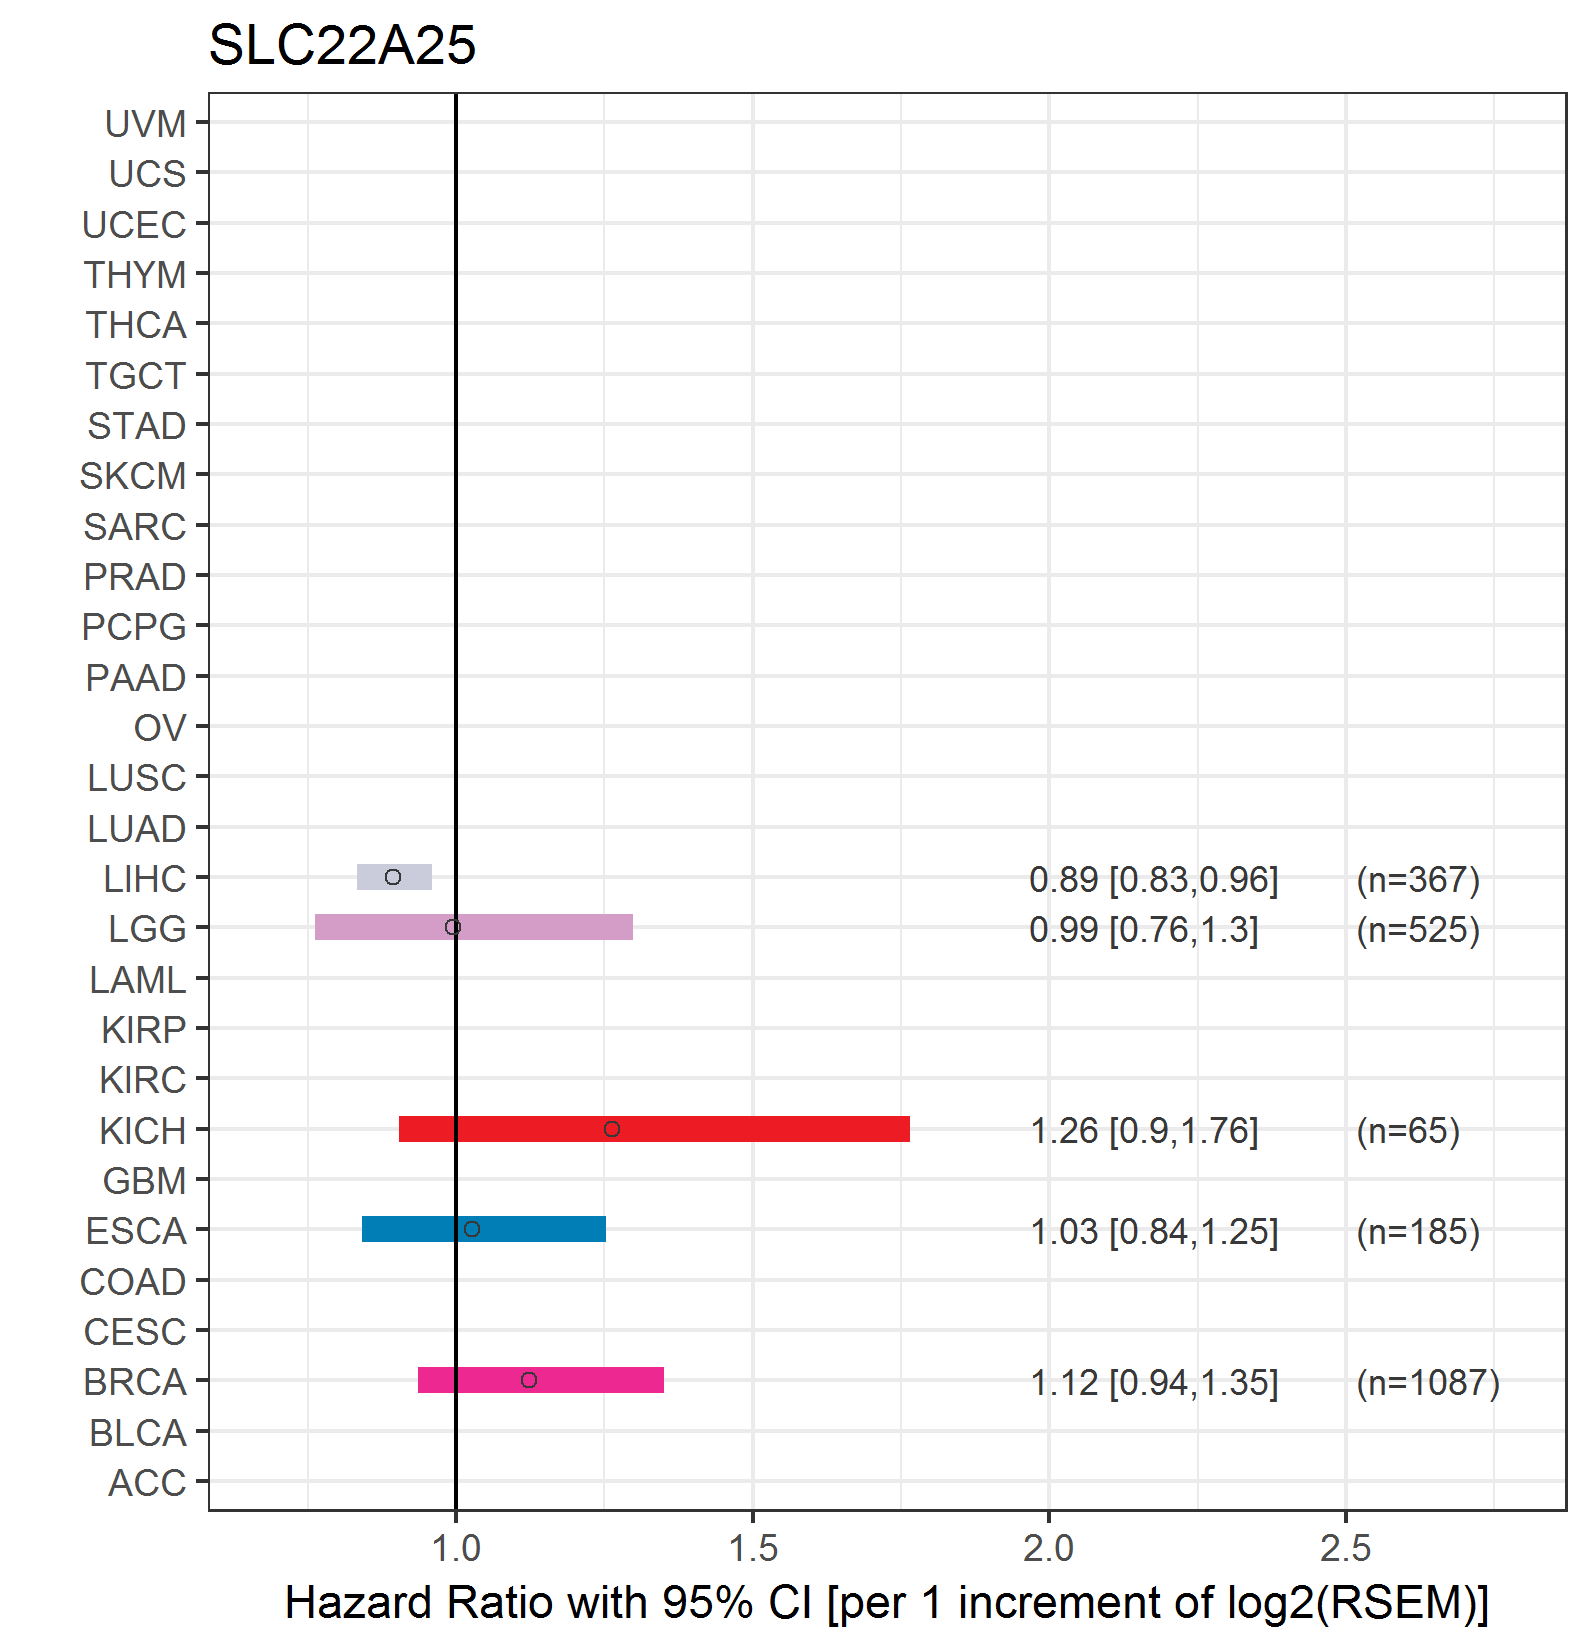
| Forest plot of Cox proportional hazard ratio (HR) and 95% CI of overall survival (OS) using 28 cancer types (TCGA IlluminaHiSeq_RNASeqV2, pan-cancer normalized log2(norm_counts+1) data, version 2016-08-16) (TCGA clinicalMatrix, phenotype data, version 2016-04-27) * Click on the image enlarge it in a new window. |
 |
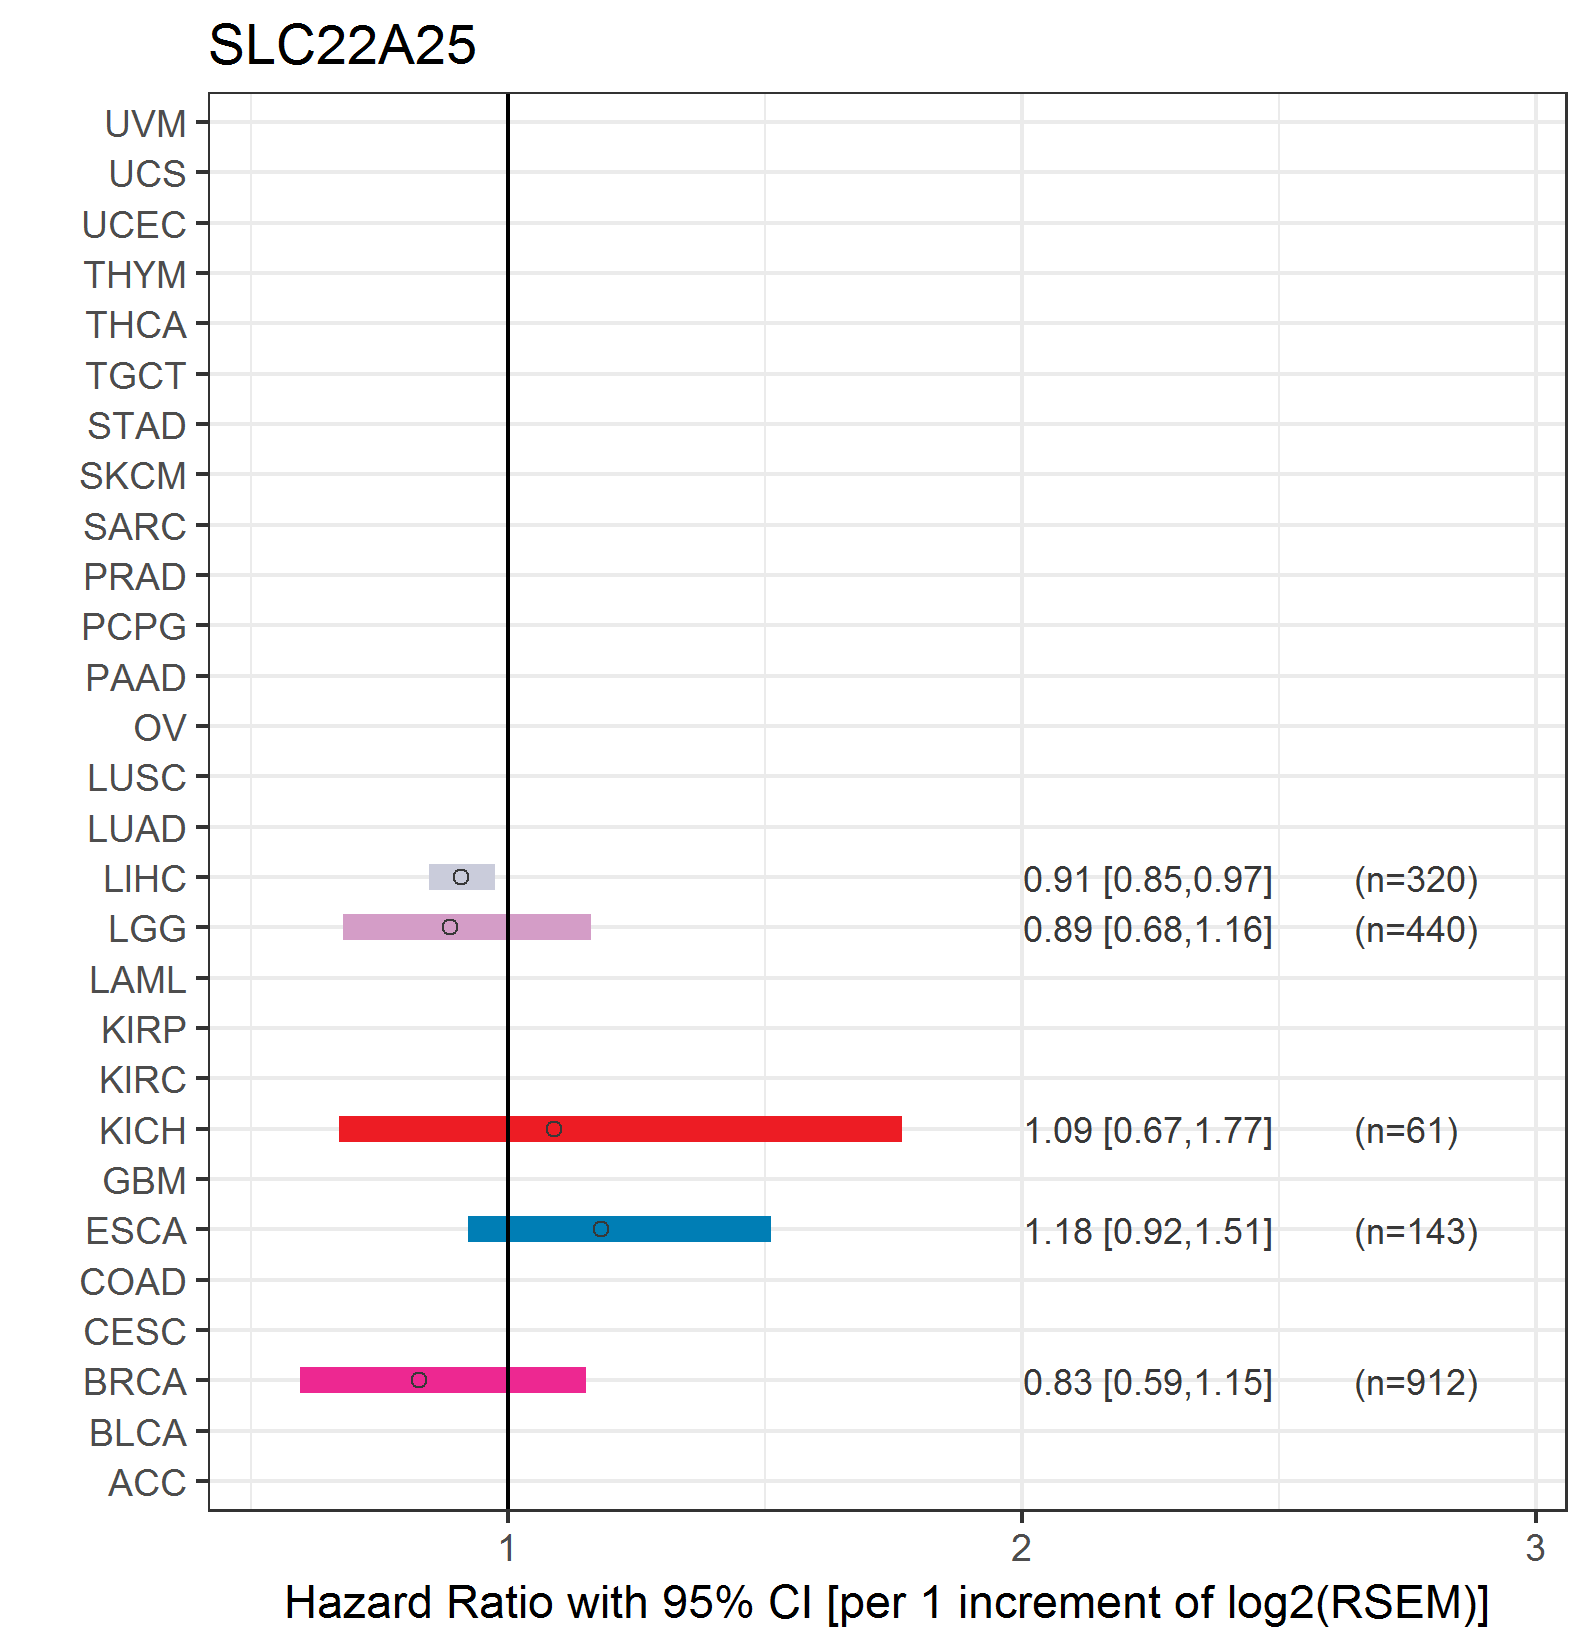
| Forest plot of Cox proportional hazard ratio (HR) and 95% CI of relapse free survival (RFS) using 28 cancer types (TCGA IlluminaHiSeq_RNASeqV2, pan-cancer normalized log2(norm_counts+1) data, version 2016-08-16) (TCGA clinicalMatrix, phenotype data, version 2016-04-27) * Click on the image enlarge it in a new window. |
 |
| Top |
| TissGeneClin for SLC22A25 |
| TissGeneDrug for SLC22A25 |
| Drug information targeting TissGene (DrugBank Version 5.0.6, 2017-04-01) |
| DrugBank ID | Drug name | Drug activity | Drug type | Drug status |
| Top |
| TissGeneDisease for SLC22A25 |
| Disease information associated with TissGene (DisGeNet, 2016-06-01) |
| Disease ID | Disease name | # pubmeds | Source |
|
Copyright 2016-Present - The University of Texas Health Science Center at Houston (UTHealth) Web File Viewing | How to Report, Fraud, Waste and Abuse | State of Texas | Statewide Search | Texas Homeland Security | Site Policies |