 |
| |
| |
| |
| |
| |
| |
|

| TissGeneSummary for SLC22A10 |
 Gene summary Gene summary |
| Basic gene information | Gene symbol | SLC22A10 |
| Gene name | solute carrier family 22, member 10 | |
| Synonyms | OAT5|hOAT5 | |
| Cytomap | UCSC genome browser: 11q12.3 | |
| Type of gene | protein-coding | |
| RefGenes | NM_001039752.3, | |
| Description | organic anion transporter 5solute carrier family 22 (organic anion/cation transporter), member 10solute carrier family 22 member 10 | |
| Modification date | 20141207 | |
| dbXrefs | MIM : 607580 | |
| HGNC : HGNC | ||
| Protein | UniProt: go to UniProt's Cross Reference DB Table | |
| Expression | CleanEX: HS_SLC22A10 | |
| BioGPS: 387775 | ||
| Pathway | NCI Pathway Interaction Database: SLC22A10 | |
| KEGG: SLC22A10 | ||
| REACTOME: SLC22A10 | ||
| Pathway Commons: SLC22A10 | ||
| Context | iHOP: SLC22A10 | |
| ligand binding site mutation search in PubMed: SLC22A10 | ||
| UCL Cancer Institute: SLC22A10 | ||
| Assigned class in TissGDB* | C | |
| Included tissue-specific gene expression resources | ||
| Specific-tissues in normal samples (assigned by TissGDB using HPA, TiGER, and GTEx) | Liver | |
| Cancer types related to the specific-tissues in cancer samples (assigned by TissGDB using TCGA) | LIHC | |
| Reference showing the relevant tissue of SLC22A10 | ||
| Description by TissGene annotations | Significant down-regulated DEG TissgsKTS CNV lost TissGeneKTS | |
| * Class A consists of genes with literature evidence and is part of the cTissGenes. Class B consists of only cTissGenes without additional evidence. The remaining genes belong to Class C. |
| Gene ontology having evidence of Inferred from Direct Assay (IDA) from Entrez |
| GO ID | GO term | PubMed ID |
| Top |
| TissGeneExp for SLC22A10 |
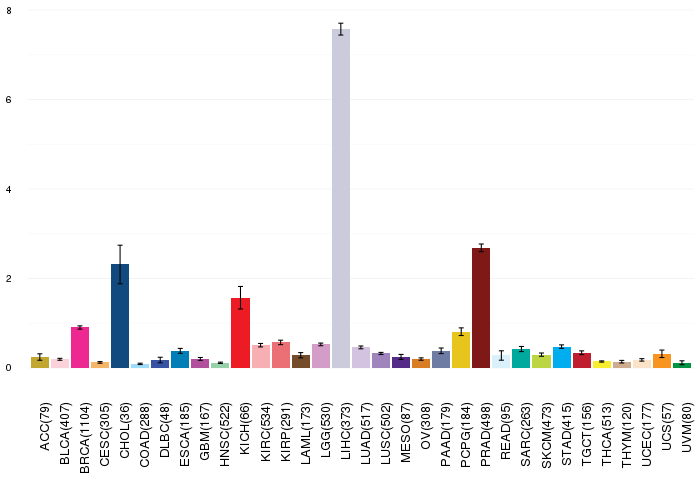
| Gene expressions across 28 cancer types (X-axis: cancer type and Y-axis: log2(norm_counts+1)) (TCGA IlluminaHiSeq_RNASeqV2, pan-cancer normalized log2(norm_counts+1) data, version 2016-08-16) |
 |
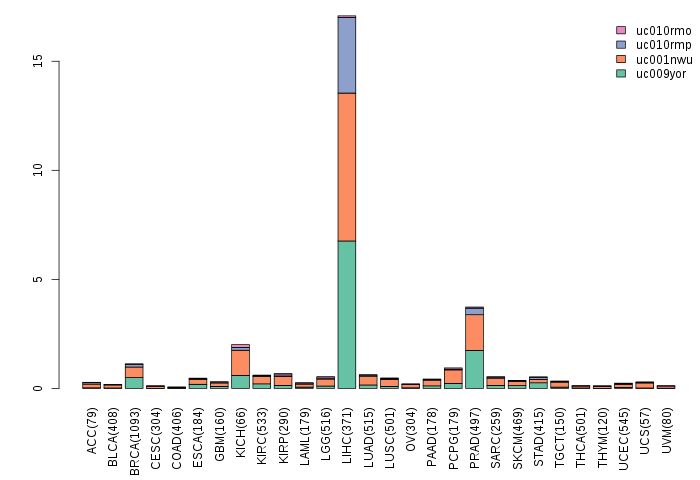
| Gene isoform expressions across 28 cancer types (X-axis: cancer type and Y-axis: log2(norm_counts+1)) (TCGA pan-cancer tcga_rsem_isoform_tpm, version 2016-09-01) |
 |
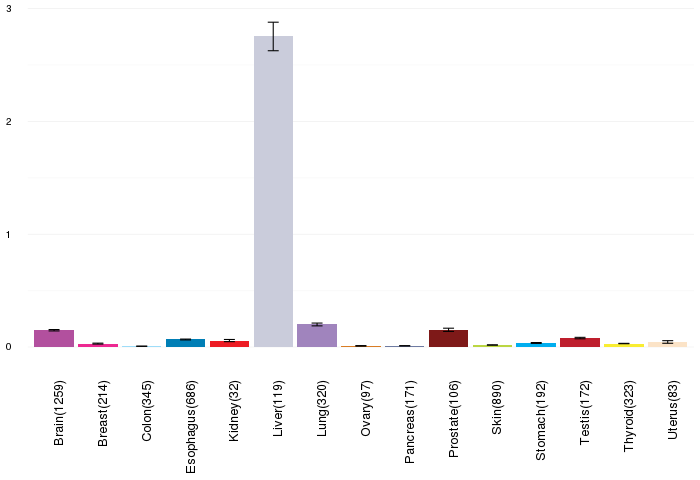
| Gene expressions across normal tissues of GTEx data (GTEx GTEx_Analysis_v6_RNA-seq_RNA-SeQCv1.1.8_gene_rpkm.gct) - Here, we shows the matched tissue types only among our 28 cancer types. |
 |
| Different expressions across 14 cancer types with more than 10 samples between matched tumors and normals (X-axis: cancer type and Y-axis: log2(norm_counts+1)) (TCGA IlluminaHiSeq_RNASeqV2, pan-cancer normalized log2(norm_counts+1) data, version 2016-08-16) |
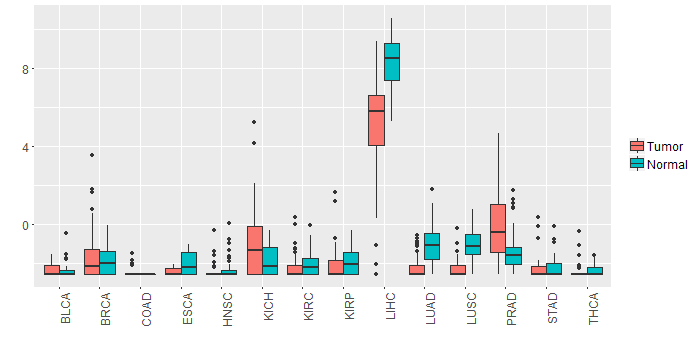 |
| - Significantly differentially expressed cancer types and information. (|Fold change|>1 and FDR<0.05) |
| Cancer type | Mean(exp) in tumor | Mean(exp) in matched normal | Log2FC | P-val. | FDR |
| LUAD | -2.238738112 | -1.036060526 | -1.202677586 | 1.22E-11 | 8.39E-11 |
| PRAD | 0.032787087 | -1.38113599 | 1.413923077 | 1.51E-05 | 7.94E-05 |
| LUSC | -2.304563366 | -1.076130032 | -1.228433333 | 7.06E-15 | 4.27E-14 |
| LIHC | 4.939048164 | 8.318594164 | -3.379546 | 2.33E-11 | 3.44E-10 |
| KICH | -0.709991836 | -1.813511836 | 1.10352 | 0.0267 | 0.043915522 |
| Top |
| TissGene-miRNA for SLC22A10 |
| Significantly anti-correlated miRNAs of TissGene across 28 cancer types (Gene-miRNA relations from TargetScanHuman Relsease 7.1, Conserved_Site_Context_Scores.txt.zip, 06.01.2016) (TCGA IlluminaHiSeq_miRNASeq, log2(RPM+1) data, version 2016-11-21) (TCGA IlluminaHiSeq_RNASeqV2, log2(normalized_count+1) data, version 2016-08-16) (Spearman’s Rank Correlation (p-value<0.05 and coefficient<-0.25)) |
| Cancer type | miRNA id | miRNA accession | P-val. | Coeff. | # samples |
| Top |
| TissGeneMut for SLC22A10 |
| TissGeneSNV for SLC22A10 |
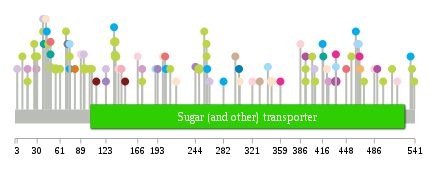
| nsSNV counts per each loci. Different colors of circles represent different cancer types. Circle size denotes number of samples. (TCGA somatic mutation (SNPs and small INDELs) data, version 2016-04-25) * Click on the image to enlarge it in a new window. |
 |
 |
| Somatic nucleotide variants of TissGene across 28 cancer types (X-axis: cancer type and Y-axis: % of mutated samples) The numbers in parentheses are numbers of samples with mutation (nsSNVs). (TCGA somatic mutation (SNPs and small INDELs) data, version 2016-04-25) |
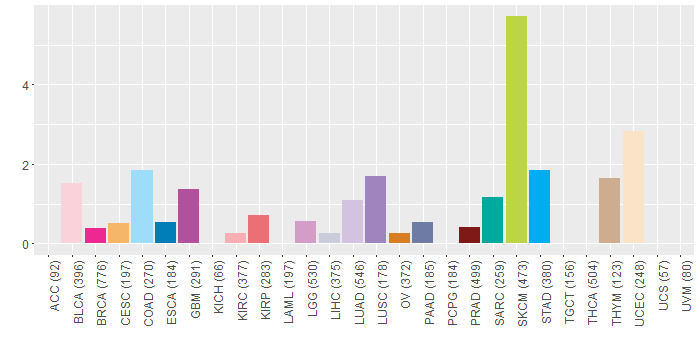 |
| - nsSNVs sorted by frequency. |
| AAchange | Cancer type | # samples |
| p.D136N | SKCM | 2 |
| p.R347C | UCEC | 2 |
| p.P94S | SKCM | 2 |
| p.S55F | SKCM | 2 |
| p.W135X | SKCM | 2 |
| p.R434H | GBM | 2 |
| p.P249S | SKCM | 2 |
| p.S259F | SKCM | 1 |
| p.E517K | BLCA | 1 |
| p.R17Q | SKCM | 1 |
| p.D123N | LUAD | 1 |
| p.E294D | HNSC | 1 |
| p.A71V | PAAD | 1 |
| p.R405H | LUAD | 1 |
| p.R393Q | GBM | 1 |
| p.K134T | STAD | 1 |
| p.S210F | SKCM | 1 |
| p.G386E | BLCA | 1 |
| p.R74K | STAD | 1 |
| p.D80Y | CHOL | 1 |
| p.Q104H | SKCM | 1 |
| p.R172Q | SKCM | 1 |
| p.L30I | SKCM | 1 |
| p.D140N | BLCA | 1 |
| p.K540M | SKCM | 1 |
| p.P461L | STAD | 1 |
| p.P39L | SARC | 1 |
| p.R465S | COAD | 1 |
| p.T448A | KIRP | 1 |
| p.R434C | COAD | 1 |
| p.L486F | BLCA | 1 |
| p.R256Q | SKCM | 1 |
| p.A29T | LGG | 1 |
| p.W69* | SKCM | 1 |
| p.W135* | SKCM | 1 |
| p.R321K | BLCA | 1 |
| p.R342C | COAD | 1 |
| p.R89C | BLCA | 1 |
| p.D123N | LUSC | 1 |
| p.R48C | SKCM | 1 |
| p.H455Y | SKCM | 1 |
| p.S218Y | UCEC | 1 |
| p.S263* | LUAD | 1 |
| p.S282C | STAD | 1 |
| p.L537F | SKCM | 1 |
| p.T490M | GBM | 1 |
| p.R48C | SARC | 1 |
| p.V463A | LIHC | 1 |
| p.R74G | COAD | 1 |
| p.G61S | SKCM | 1 |
| p.K535N | STAD | 1 |
| p.A466T | BRCA | 1 |
| p.A331T | THYM | 1 |
| p.R434C | BRCA | 1 |
| p.A110T | PRAD | 1 |
| p.R74K | SKCM | 1 |
| p.P45S | SKCM | 1 |
| p.Q259H | SKCM | 1 |
| p.R467T | CESC | 1 |
| p.R393X | SKCM | 1 |
| p.V416M | STAD | 1 |
| p.C200Y | UCEC | 1 |
| p.F204L | STAD | 1 |
| p.T424M | LGG | 1 |
| p.E38Q | SKCM | 1 |
| p.R406Q | SKCM | 1 |
| p.D472N | SKCM | 1 |
| p.L144M | KIRC | 1 |
| p.A190T | COAD | 1 |
| p.R101Q | SKCM | 1 |
| p.A193S | LUSC | 1 |
| p.F253Y | MESO | 1 |
| p.R172X | LGG | 1 |
| p.W120L | HNSC | 1 |
| p.A38S | LUAD | 1 |
| p.A303V | ESCA | 1 |
| p.E139D | HNSC | 1 |
| p.Q27* | SKCM | 1 |
| p.R17* | LGG | 1 |
| p.P26L | SKCM | 1 |
| p.R203C | KIRP | 1 |
| p.R166K | BLCA | 1 |
| p.R321I | CHOL | 1 |
| p.E517Q | HNSC | 1 |
| p.Q149E | PRAD | 1 |
| p.L176I | READ | 1 |
| p.V3L | LUAD | 1 |
| p.R48C | KIRP | 1 |
| p.P260S | STAD | 1 |
| p.A359G | BRCA | 1 |
| p.L93Q | LUAD | 1 |
| p.S81T | OV | 1 |
| p.R393* | SKCM | 1 |
| p.A422V | UCEC | 1 |
| p.H402Y | SKCM | 1 |
| p.L510F | SKCM | 1 |
| p.G244V | LUSC | 1 |
| p.V10I | SKCM | 1 |
| p.A43S | STAD | 1 |
| p.G417V | SARC | 1 |
| p.A42S | UCEC | 1 |
| p.A298S | THYM | 1 |
| p.R304C | UCEC | 1 |
| p.W498* | SKCM | 1 |
| Top |
| TissGeneCNV for SLC22A10 |
| Copy number variations of TissGene across 28 cancer types (X-axis: cancer type and Y-axis: % of CNV samples) (TCGA Gistic2_CopyNumber_Gistic2_all_data_by_genes, Gistic2 copy number data, version 2016-08-16) |
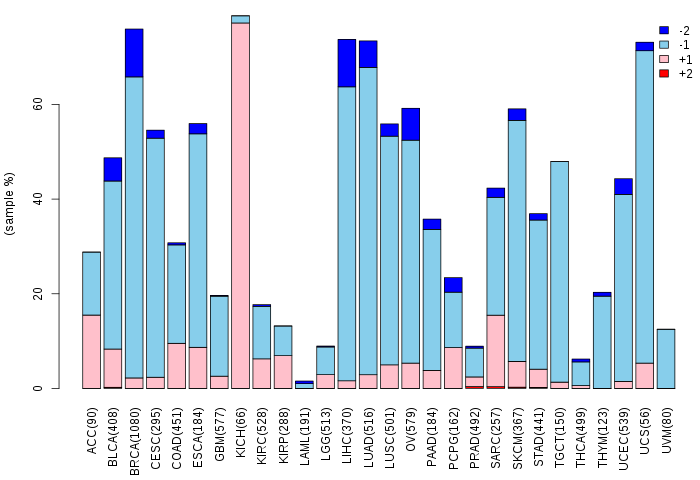 |
| Top |
| TissGeneFusions for SLC22A10 |
| Fusion genes including TissGene (ChimerDB 3.0, 2016-12-01 and TCGA fusion Portal 2015-12-01) |
| Database | Src | Cancer type | Sample | Fusion gene | ORF | 5'-gene BP | 3'-gene BP |
| TCGAfusionPortal | PRADA | BLCA | TCGA-BT-A2LA-01A | MLL-SLC22A10 | CDS-3UTR | Chr11:118345030 | Chr11:63137095 |
| Top |
| TissGeneNet for SLC22A10 |
| Co-expressed gene networks based on protein-protein interaction data (CePIN) (TCGA IlluminaHiSeq_RNASeqV2, pan-cancer normalized log2(norm_counts+1) data, version 2016-08-16) (PINA2 ppi data) |
| Top |
| TissGeneProg for SLC22A10 |
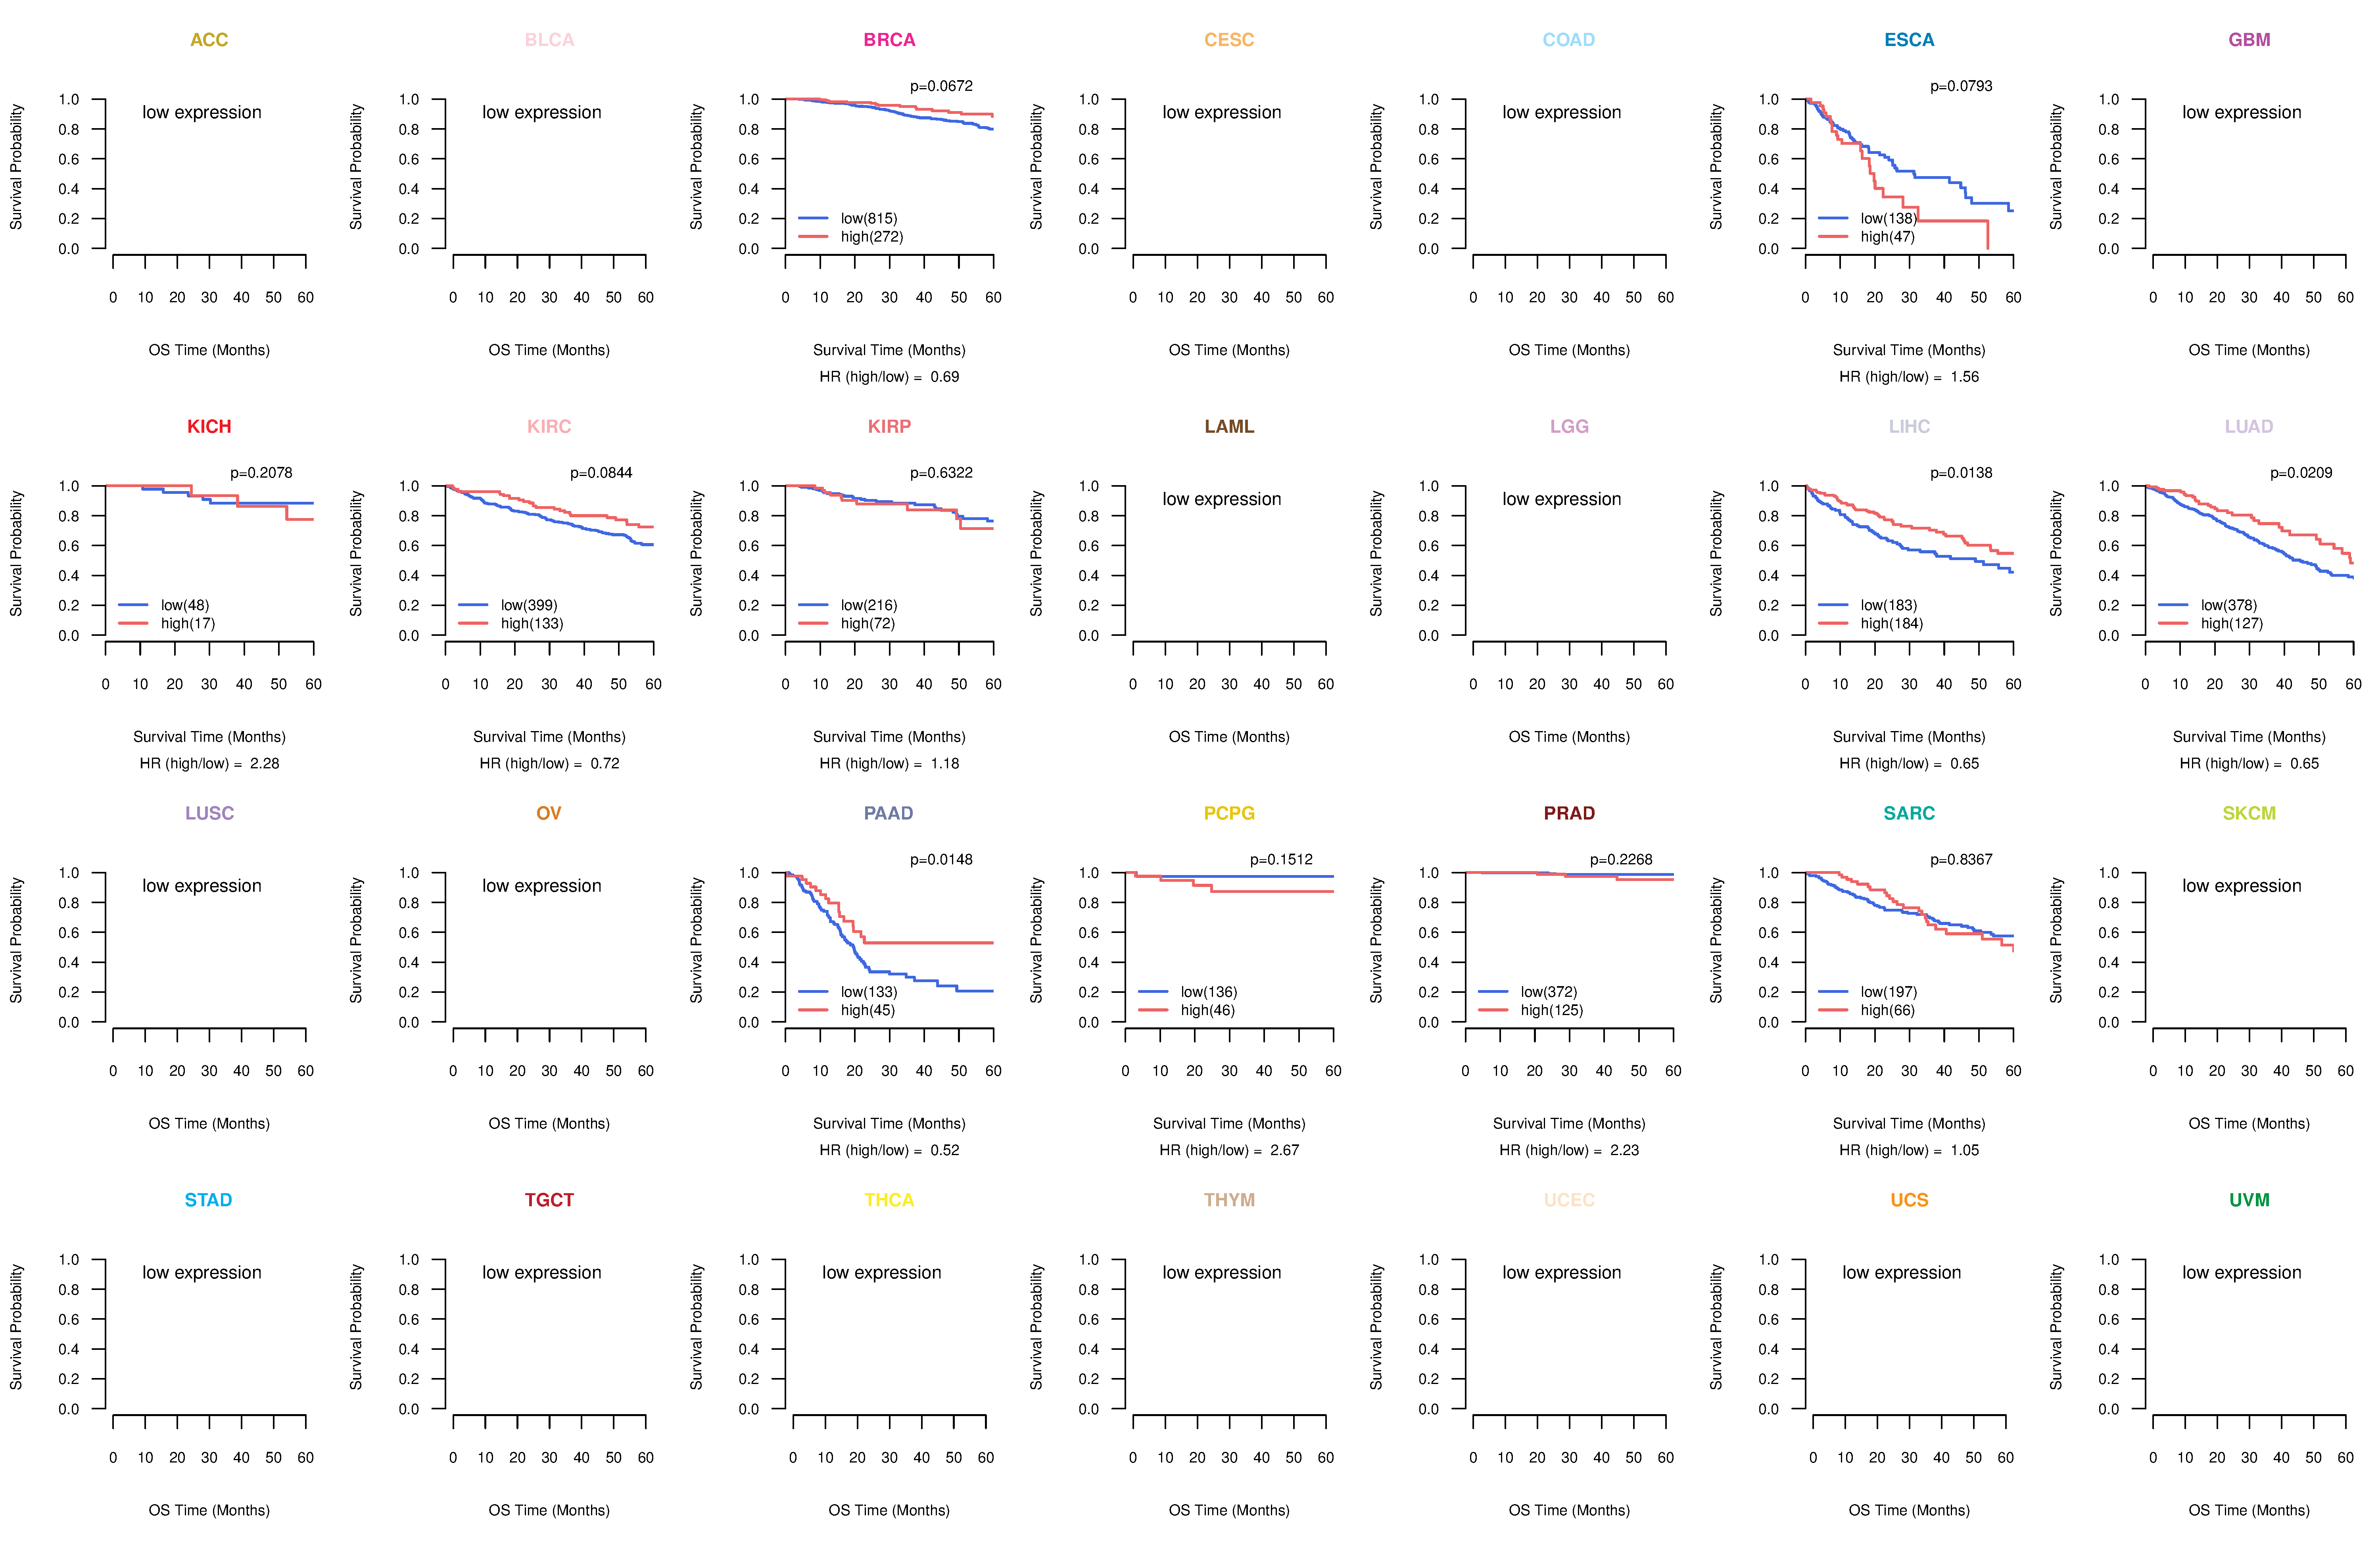
| Kaplan-Meier plots with logrank tests of overall survival (OS) using 28 cancer types (TCGA IlluminaHiSeq_RNASeqV2, pan-cancer normalized log2(norm_counts+1) data, version 2016-08-16) (TCGA clinicalMatrix, phenotype data, version 2016-04-27) * Click on the image to enlarge it in a new window. |
 |
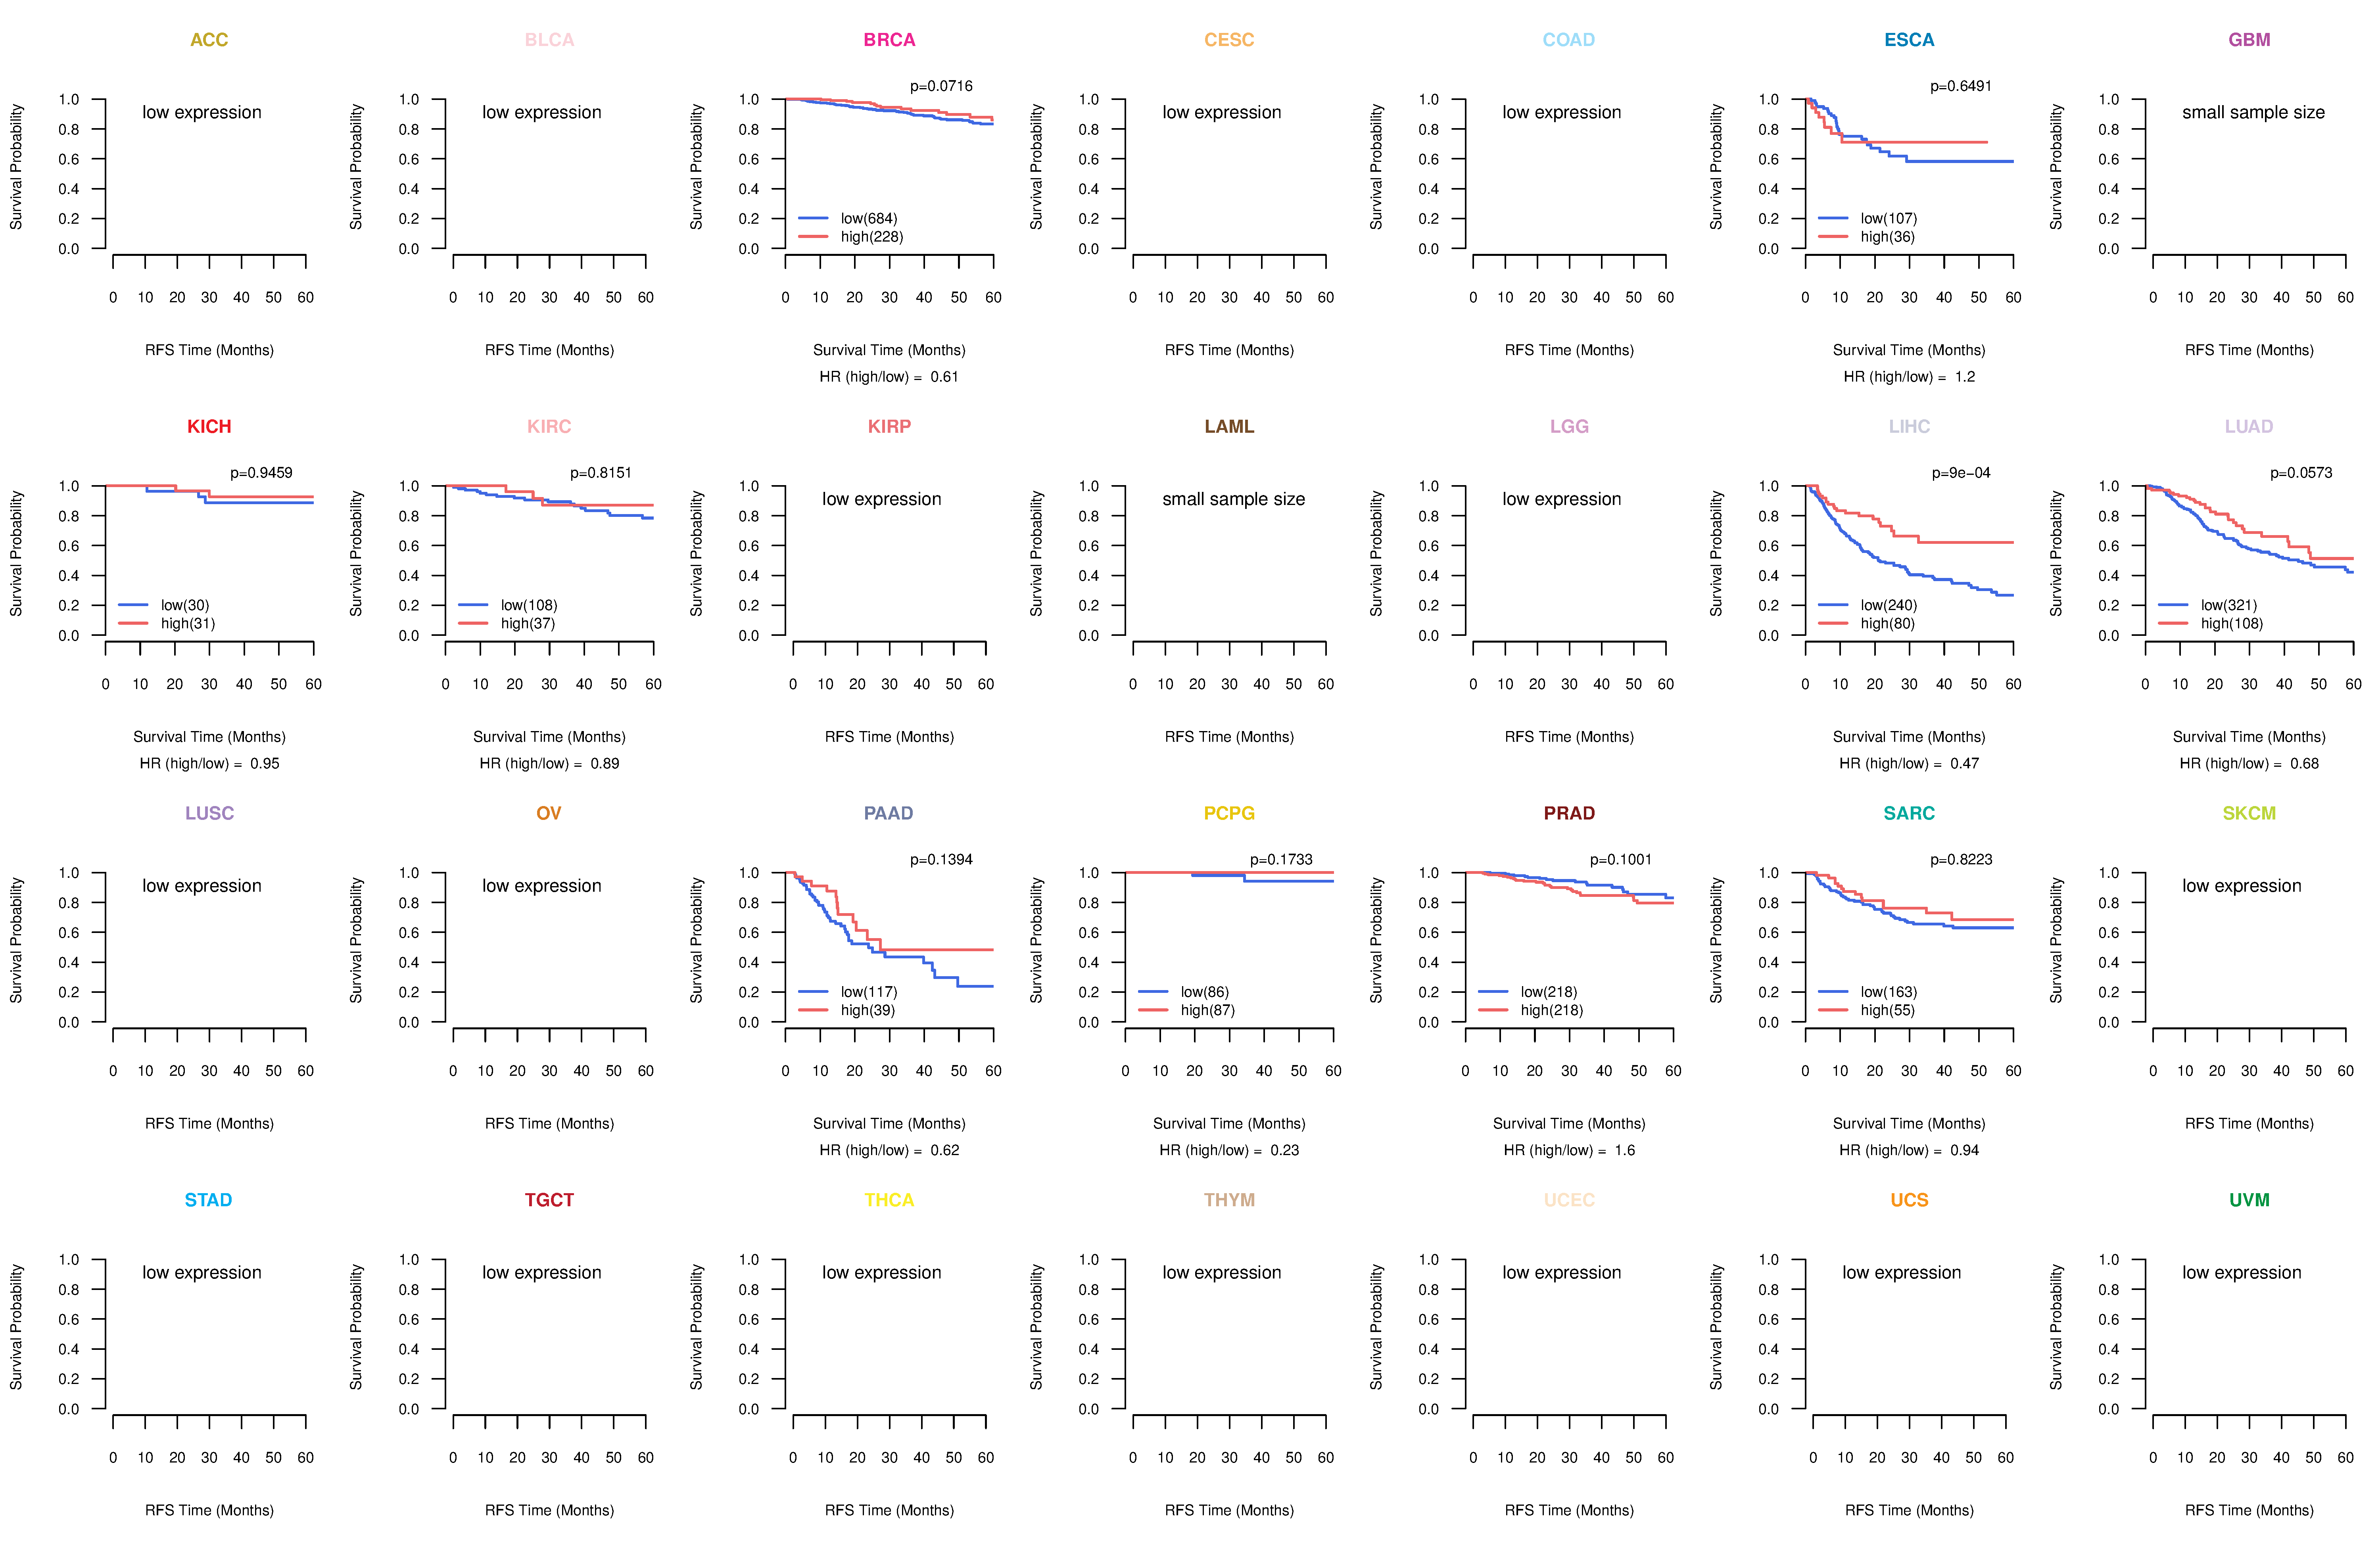
| Kaplan-Meier plots with logrank test of relapse free survival (RFS) using 28 cancer types (TCGA IlluminaHiSeq_RNASeqV2, pan-cancer normalized log2(norm_counts+1) data, version 2016-08-16) (TCGA clinicalMatrix, phenotype data, version 2016-04-27) * Click on the image enlarge it in a new window. |
 |
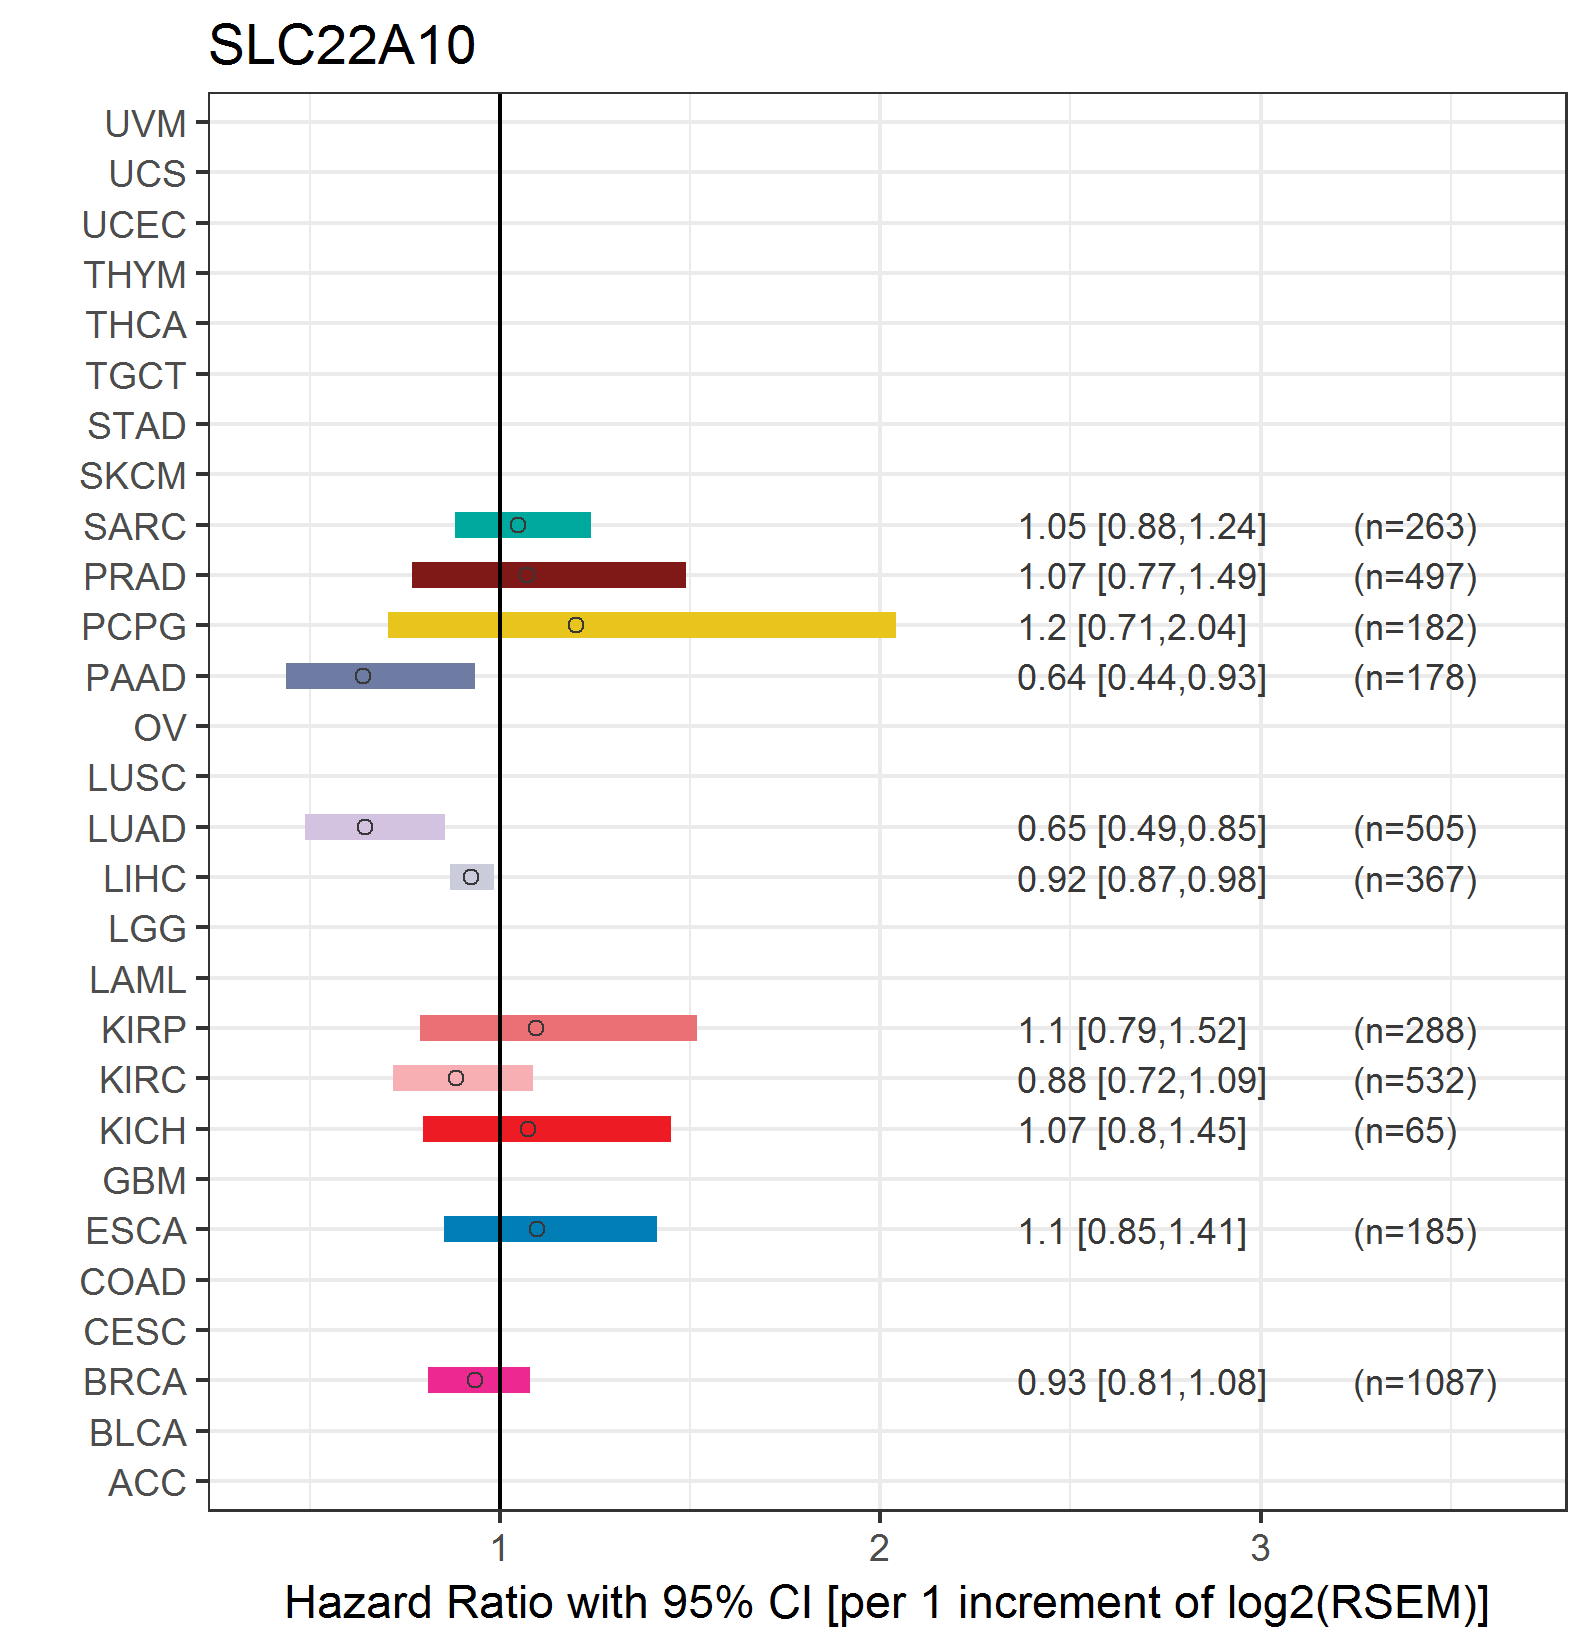
| Forest plot of Cox proportional hazard ratio (HR) and 95% CI of overall survival (OS) using 28 cancer types (TCGA IlluminaHiSeq_RNASeqV2, pan-cancer normalized log2(norm_counts+1) data, version 2016-08-16) (TCGA clinicalMatrix, phenotype data, version 2016-04-27) * Click on the image enlarge it in a new window. |
 |
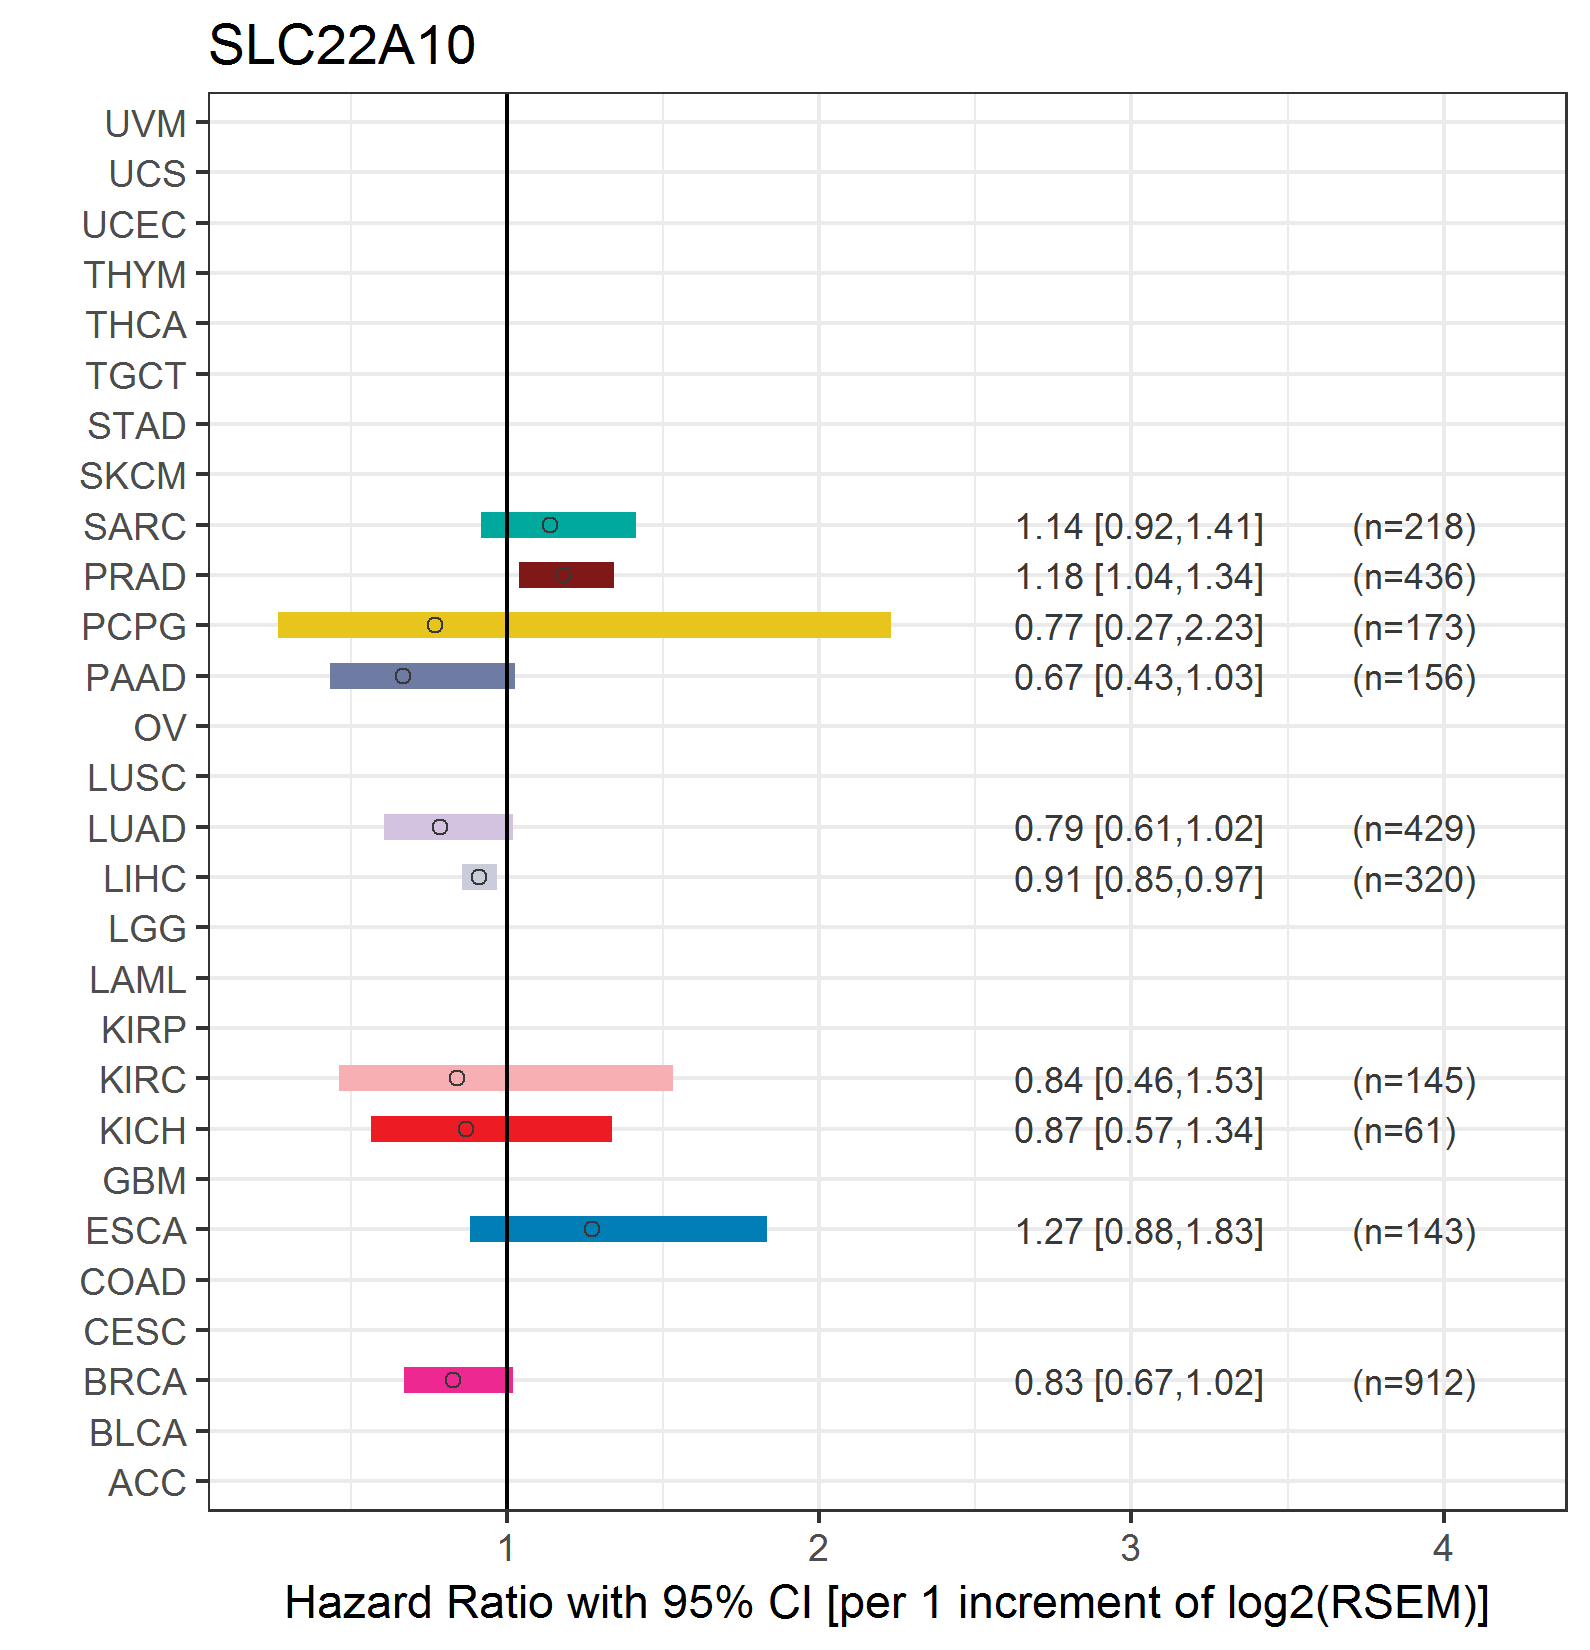
| Forest plot of Cox proportional hazard ratio (HR) and 95% CI of relapse free survival (RFS) using 28 cancer types (TCGA IlluminaHiSeq_RNASeqV2, pan-cancer normalized log2(norm_counts+1) data, version 2016-08-16) (TCGA clinicalMatrix, phenotype data, version 2016-04-27) * Click on the image enlarge it in a new window. |
 |
| Top |
| TissGeneClin for SLC22A10 |
| TissGeneDrug for SLC22A10 |
| Drug information targeting TissGene (DrugBank Version 5.0.6, 2017-04-01) |
| DrugBank ID | Drug name | Drug activity | Drug type | Drug status |
| Top |
| TissGeneDisease for SLC22A10 |
| Disease information associated with TissGene (DisGeNet, 2016-06-01) |
| Disease ID | Disease name | # pubmeds | Source |
|
Copyright 2016-Present - The University of Texas Health Science Center at Houston (UTHealth) Web File Viewing | How to Report, Fraud, Waste and Abuse | State of Texas | Statewide Search | Texas Homeland Security | Site Policies |