 |
| |
| |
| |
| |
| |
| |
|

| TissGeneSummary for TMEM220 |
 Gene summary Gene summary |
| Basic gene information | Gene symbol | TMEM220 |
| Gene name | transmembrane protein 220 | |
| Synonyms | - | |
| Cytomap | UCSC genome browser: 17p13.1 | |
| Type of gene | protein-coding | |
| RefGenes | NM_001004313.1, | |
| Description | - | |
| Modification date | 20141207 | |
| dbXrefs | HGNC : HGNC | |
| Ensembl : ENSG00000187824 | ||
| HPRD : 17371 | ||
| Vega : OTTHUMG00000178043 | ||
| Protein | UniProt: go to UniProt's Cross Reference DB Table | |
| Expression | CleanEX: HS_TMEM220 | |
| BioGPS: 388335 | ||
| Pathway | NCI Pathway Interaction Database: TMEM220 | |
| KEGG: TMEM220 | ||
| REACTOME: TMEM220 | ||
| Pathway Commons: TMEM220 | ||
| Context | iHOP: TMEM220 | |
| ligand binding site mutation search in PubMed: TMEM220 | ||
| UCL Cancer Institute: TMEM220 | ||
| Assigned class in TissGDB* | C | |
| Included tissue-specific gene expression resources | ||
| Specific-tissues in normal samples (assigned by TissGDB using HPA, TiGER, and GTEx) | LiverProstate | |
| Cancer types related to the specific-tissues in cancer samples (assigned by TissGDB using TCGA) | LIHCPRAD | |
| Reference showing the relevant tissue of TMEM220 | ||
| Description by TissGene annotations | ||
| * Class A consists of genes with literature evidence and is part of the cTissGenes. Class B consists of only cTissGenes without additional evidence. The remaining genes belong to Class C. |
| Gene ontology having evidence of Inferred from Direct Assay (IDA) from Entrez |
| GO ID | GO term | PubMed ID |
| Top |
| TissGeneExp for TMEM220 |
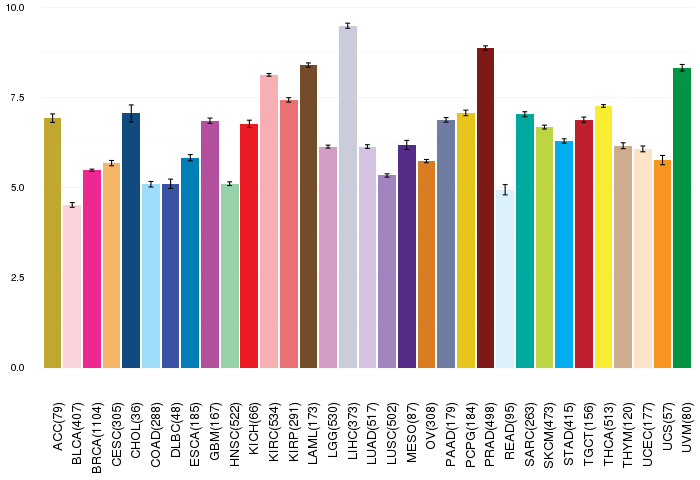
| Gene expressions across 28 cancer types (X-axis: cancer type and Y-axis: log2(norm_counts+1)) (TCGA IlluminaHiSeq_RNASeqV2, pan-cancer normalized log2(norm_counts+1) data, version 2016-08-16) |
 |
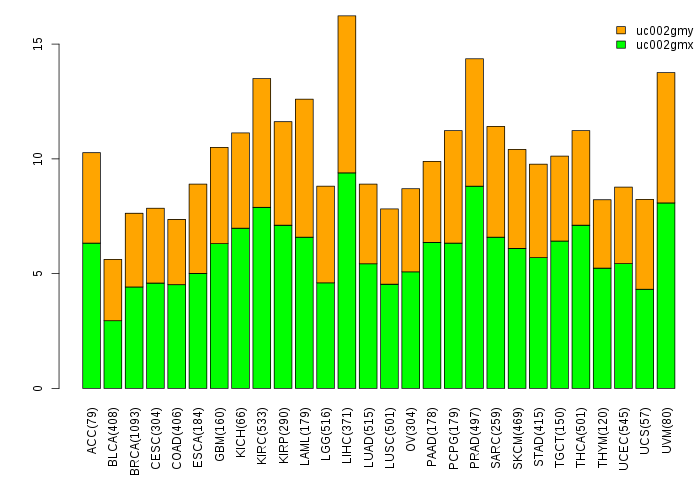
| Gene isoform expressions across 28 cancer types (X-axis: cancer type and Y-axis: log2(norm_counts+1)) (TCGA pan-cancer tcga_rsem_isoform_tpm, version 2016-09-01) |
 |
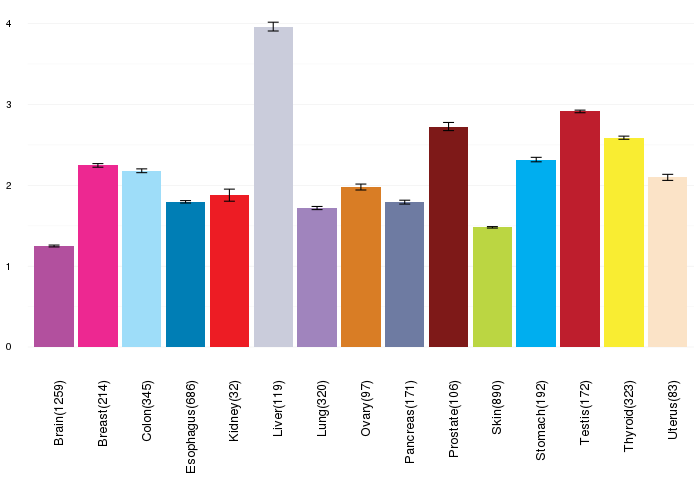
| Gene expressions across normal tissues of GTEx data (GTEx GTEx_Analysis_v6_RNA-seq_RNA-SeQCv1.1.8_gene_rpkm.gct) - Here, we shows the matched tissue types only among our 28 cancer types. |
 |
| Different expressions across 14 cancer types with more than 10 samples between matched tumors and normals (X-axis: cancer type and Y-axis: log2(norm_counts+1)) (TCGA IlluminaHiSeq_RNASeqV2, pan-cancer normalized log2(norm_counts+1) data, version 2016-08-16) |
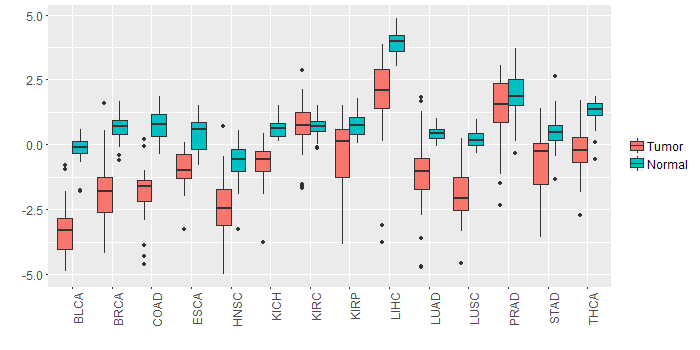 |
| - Significantly differentially expressed cancer types and information. (|Fold change|>1 and FDR<0.05) |
| Cancer type | Mean(exp) in tumor | Mean(exp) in matched normal | Log2FC | P-val. | FDR |
| STAD | -0.728718684 | 0.476587566 | -1.20530625 | 4.08E-06 | 5.40E-05 |
| BRCA | -1.837836502 | 0.685165252 | -2.523001754 | 2.53E-54 | 4.07E-52 |
| THCA | -0.136707614 | 1.317966962 | -1.454674576 | 1.31E-18 | 3.67E-17 |
| BLCA | -3.253161941 | -0.246425099 | -3.006736842 | 8.63E-11 | 2.40E-08 |
| HNSC | -2.496188379 | -0.665041868 | -1.831146512 | 7.37E-12 | 2.02E-10 |
| LIHC | 1.971420691 | 3.923176691 | -1.951756 | 1.01E-12 | 1.99E-11 |
| LUAD | -1.174398965 | 0.431688966 | -1.606087931 | 1.96E-14 | 1.90E-13 |
| COAD | -1.895120848 | 0.746952229 | -2.642073077 | 5.56E-13 | 1.58E-11 |
| LUSC | -1.9162348 | 0.221616181 | -2.13785098 | 8.46E-23 | 1.40E-21 |
| KICH | -0.797497309 | 0.627326691 | -1.424824 | 3.33E-07 | 1.37E-06 |
| ESCA | -1.040227491 | 0.325945236 | -1.366172727 | 0.0015 | 0.019062857 |
| KIRP | -0.354778059 | 0.760109441 | -1.1148875 | 8.85E-05 | 0.000306199 |
| Top |
| TissGene-miRNA for TMEM220 |
| Significantly anti-correlated miRNAs of TissGene across 28 cancer types (Gene-miRNA relations from TargetScanHuman Relsease 7.1, Conserved_Site_Context_Scores.txt.zip, 06.01.2016) (TCGA IlluminaHiSeq_miRNASeq, log2(RPM+1) data, version 2016-11-21) (TCGA IlluminaHiSeq_RNASeqV2, log2(normalized_count+1) data, version 2016-08-16) (Spearman’s Rank Correlation (p-value<0.05 and coefficient<-0.25)) |
| Cancer type | miRNA id | miRNA accession | P-val. | Coeff. | # samples |
| Top |
| TissGeneMut for TMEM220 |
| TissGeneSNV for TMEM220 |
| nsSNV counts per each loci. Different colors of circles represent different cancer types. Circle size denotes number of samples. (TCGA somatic mutation (SNPs and small INDELs) data, version 2016-04-25) * Click on the image to enlarge it in a new window. |
 |
 |
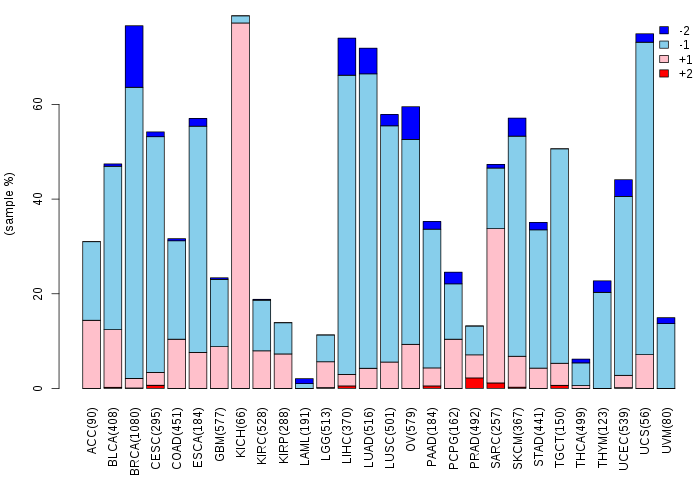
| Somatic nucleotide variants of TissGene across 28 cancer types (X-axis: cancer type and Y-axis: % of mutated samples) The numbers in parentheses are numbers of samples with mutation (nsSNVs). (TCGA somatic mutation (SNPs and small INDELs) data, version 2016-04-25) |
 |
| - nsSNVs sorted by frequency. |
| AAchange | Cancer type | # samples |
| p.S114C | KIRP | 1 |
| p.W107R | BLCA | 1 |
| p.T71M | GBM | 1 |
| p.A74V | LUAD | 1 |
| p.I89N | COAD | 1 |
| p.E94Q | LGG | 1 |
| Top |
| TissGeneCNV for TMEM220 |
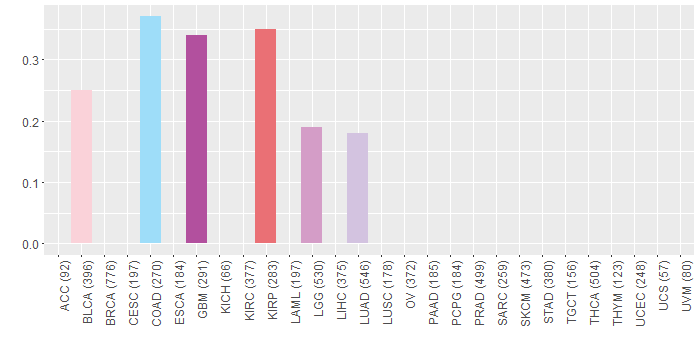
| Copy number variations of TissGene across 28 cancer types (X-axis: cancer type and Y-axis: % of CNV samples) (TCGA Gistic2_CopyNumber_Gistic2_all_data_by_genes, Gistic2 copy number data, version 2016-08-16) |
 |
| Top |
| TissGeneFusions for TMEM220 |
| Fusion genes including TissGene (ChimerDB 3.0, 2016-12-01 and TCGA fusion Portal 2015-12-01) |
| Database | Src | Cancer type | Sample | Fusion gene | ORF | 5'-gene BP | 3'-gene BP |
| Top |
| TissGeneNet for TMEM220 |
| Co-expressed gene networks based on protein-protein interaction data (CePIN) (TCGA IlluminaHiSeq_RNASeqV2, pan-cancer normalized log2(norm_counts+1) data, version 2016-08-16) (PINA2 ppi data) |
| Top |
| TissGeneProg for TMEM220 |
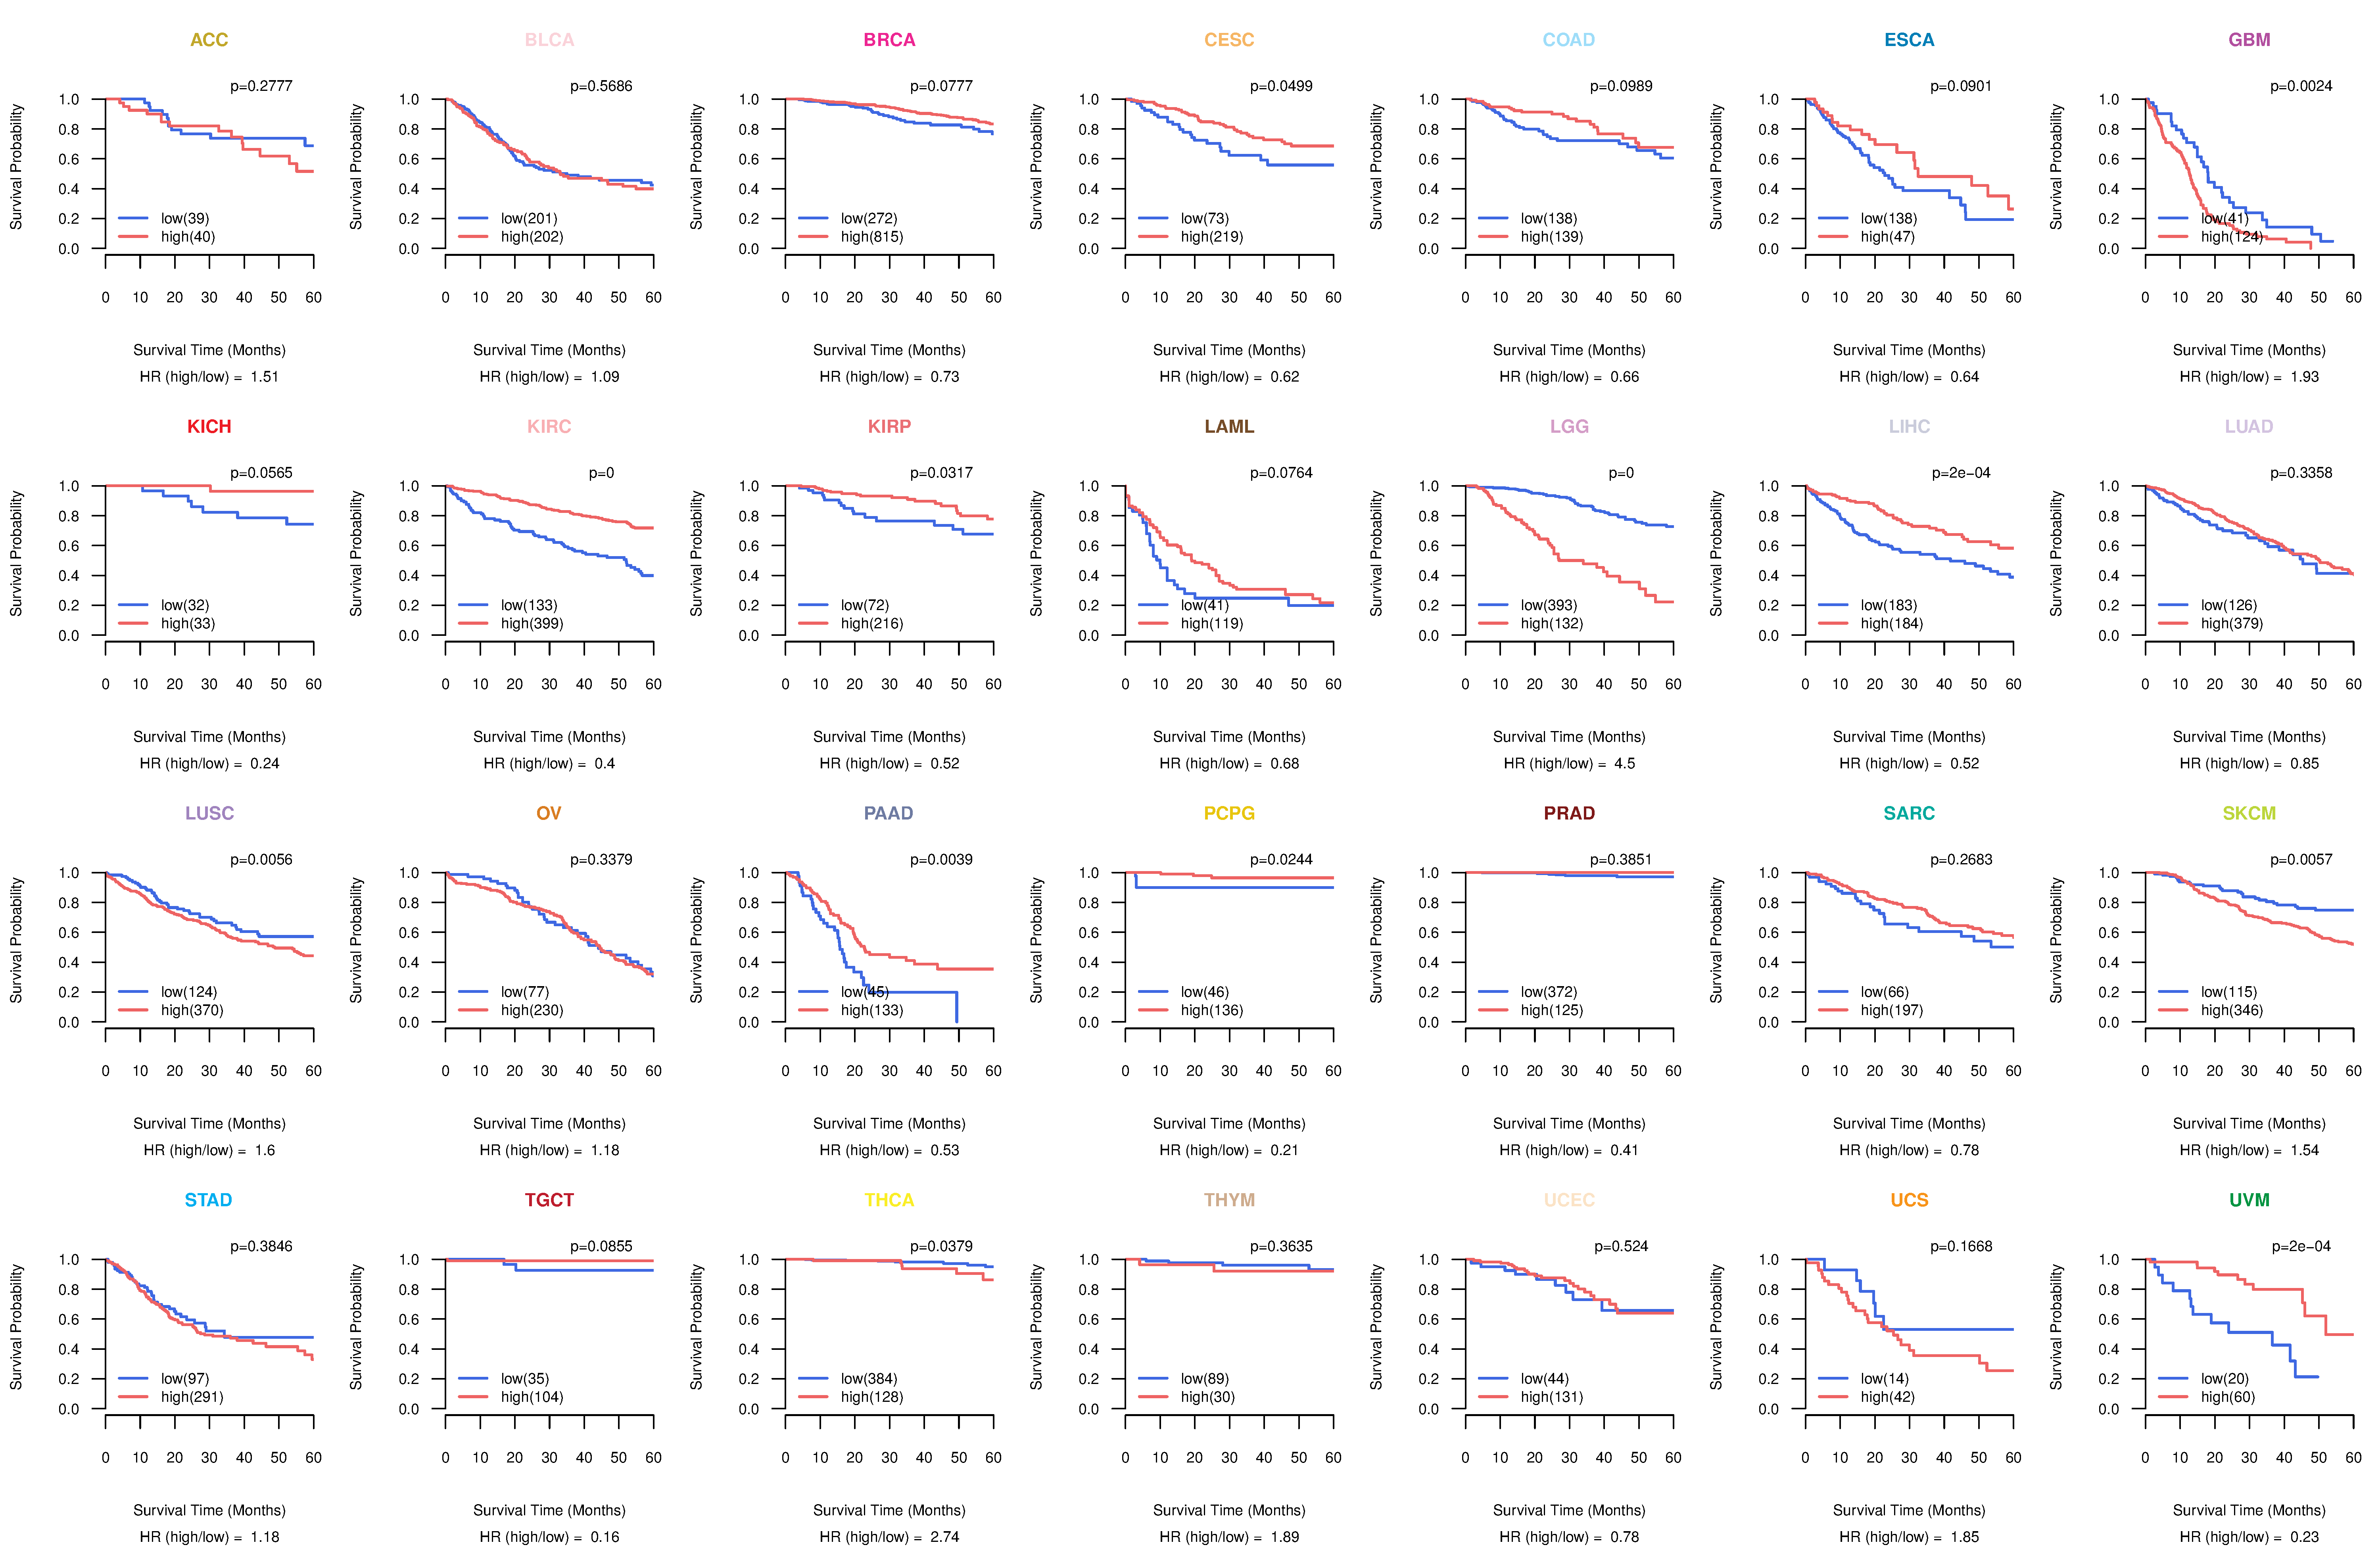
| Kaplan-Meier plots with logrank tests of overall survival (OS) using 28 cancer types (TCGA IlluminaHiSeq_RNASeqV2, pan-cancer normalized log2(norm_counts+1) data, version 2016-08-16) (TCGA clinicalMatrix, phenotype data, version 2016-04-27) * Click on the image to enlarge it in a new window. |
 |
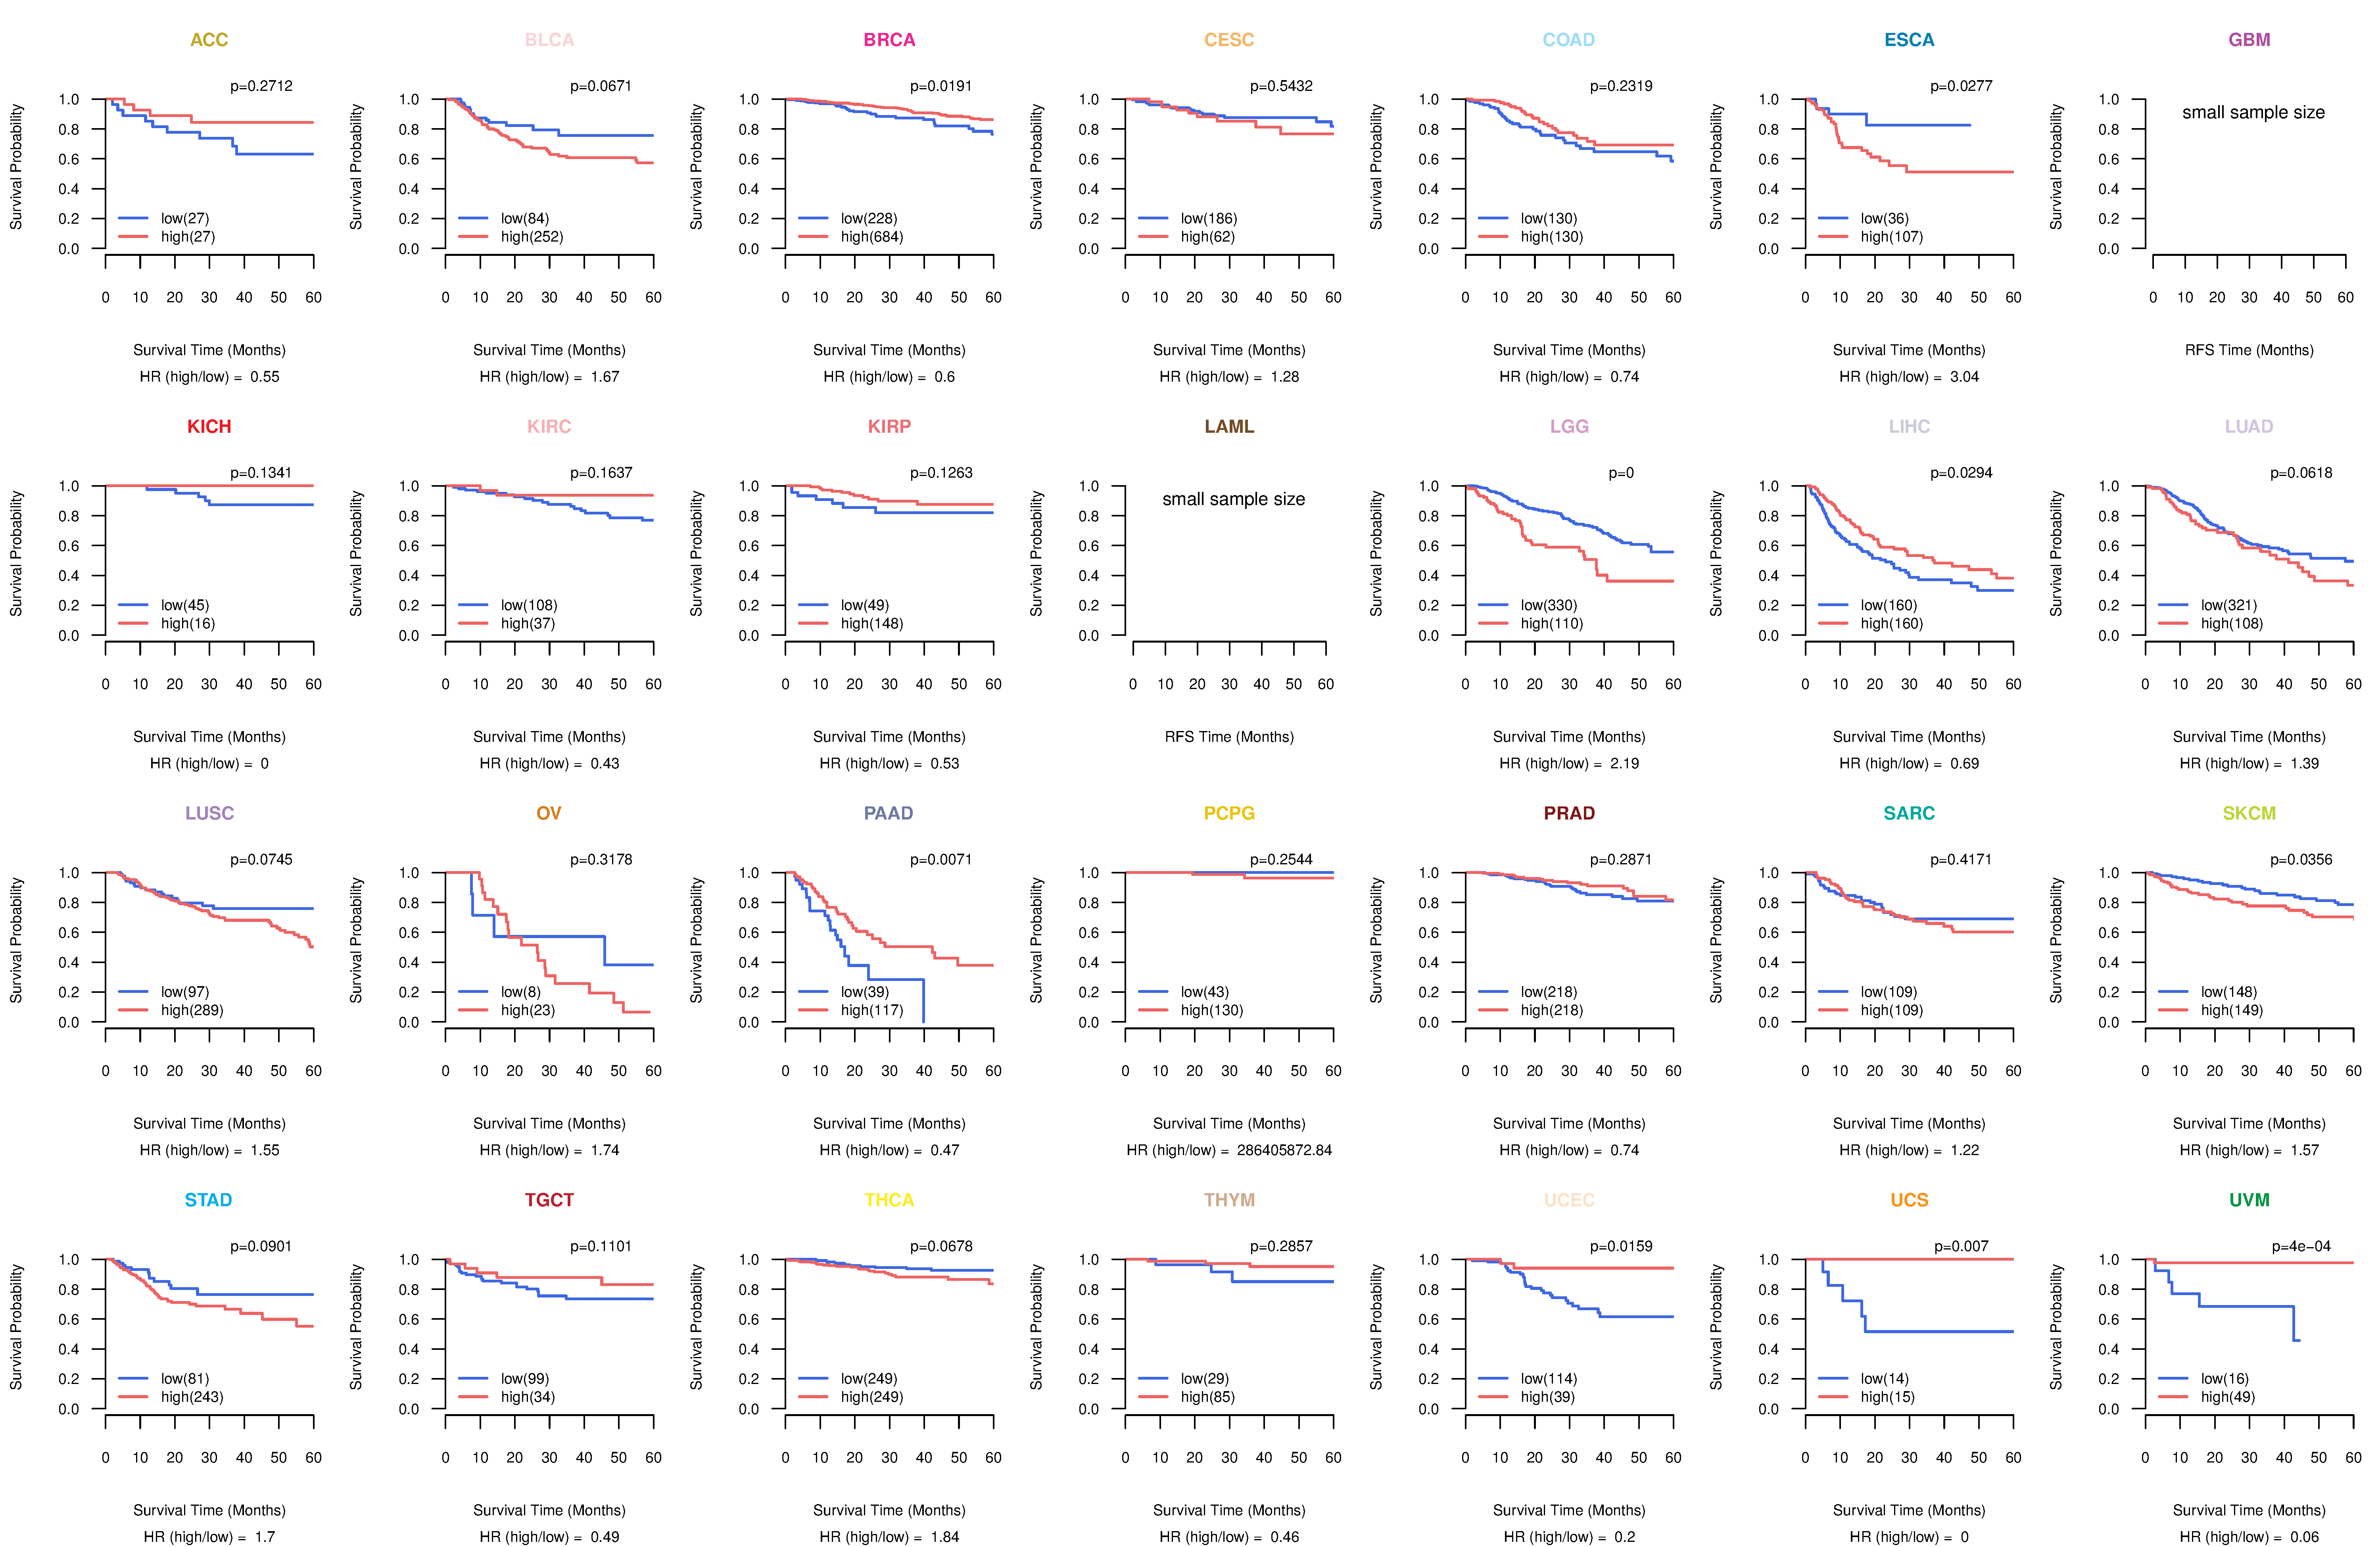
| Kaplan-Meier plots with logrank test of relapse free survival (RFS) using 28 cancer types (TCGA IlluminaHiSeq_RNASeqV2, pan-cancer normalized log2(norm_counts+1) data, version 2016-08-16) (TCGA clinicalMatrix, phenotype data, version 2016-04-27) * Click on the image enlarge it in a new window. |
 |
| Forest plot of Cox proportional hazard ratio (HR) and 95% CI of overall survival (OS) using 28 cancer types (TCGA IlluminaHiSeq_RNASeqV2, pan-cancer normalized log2(norm_counts+1) data, version 2016-08-16) (TCGA clinicalMatrix, phenotype data, version 2016-04-27) * Click on the image enlarge it in a new window. |
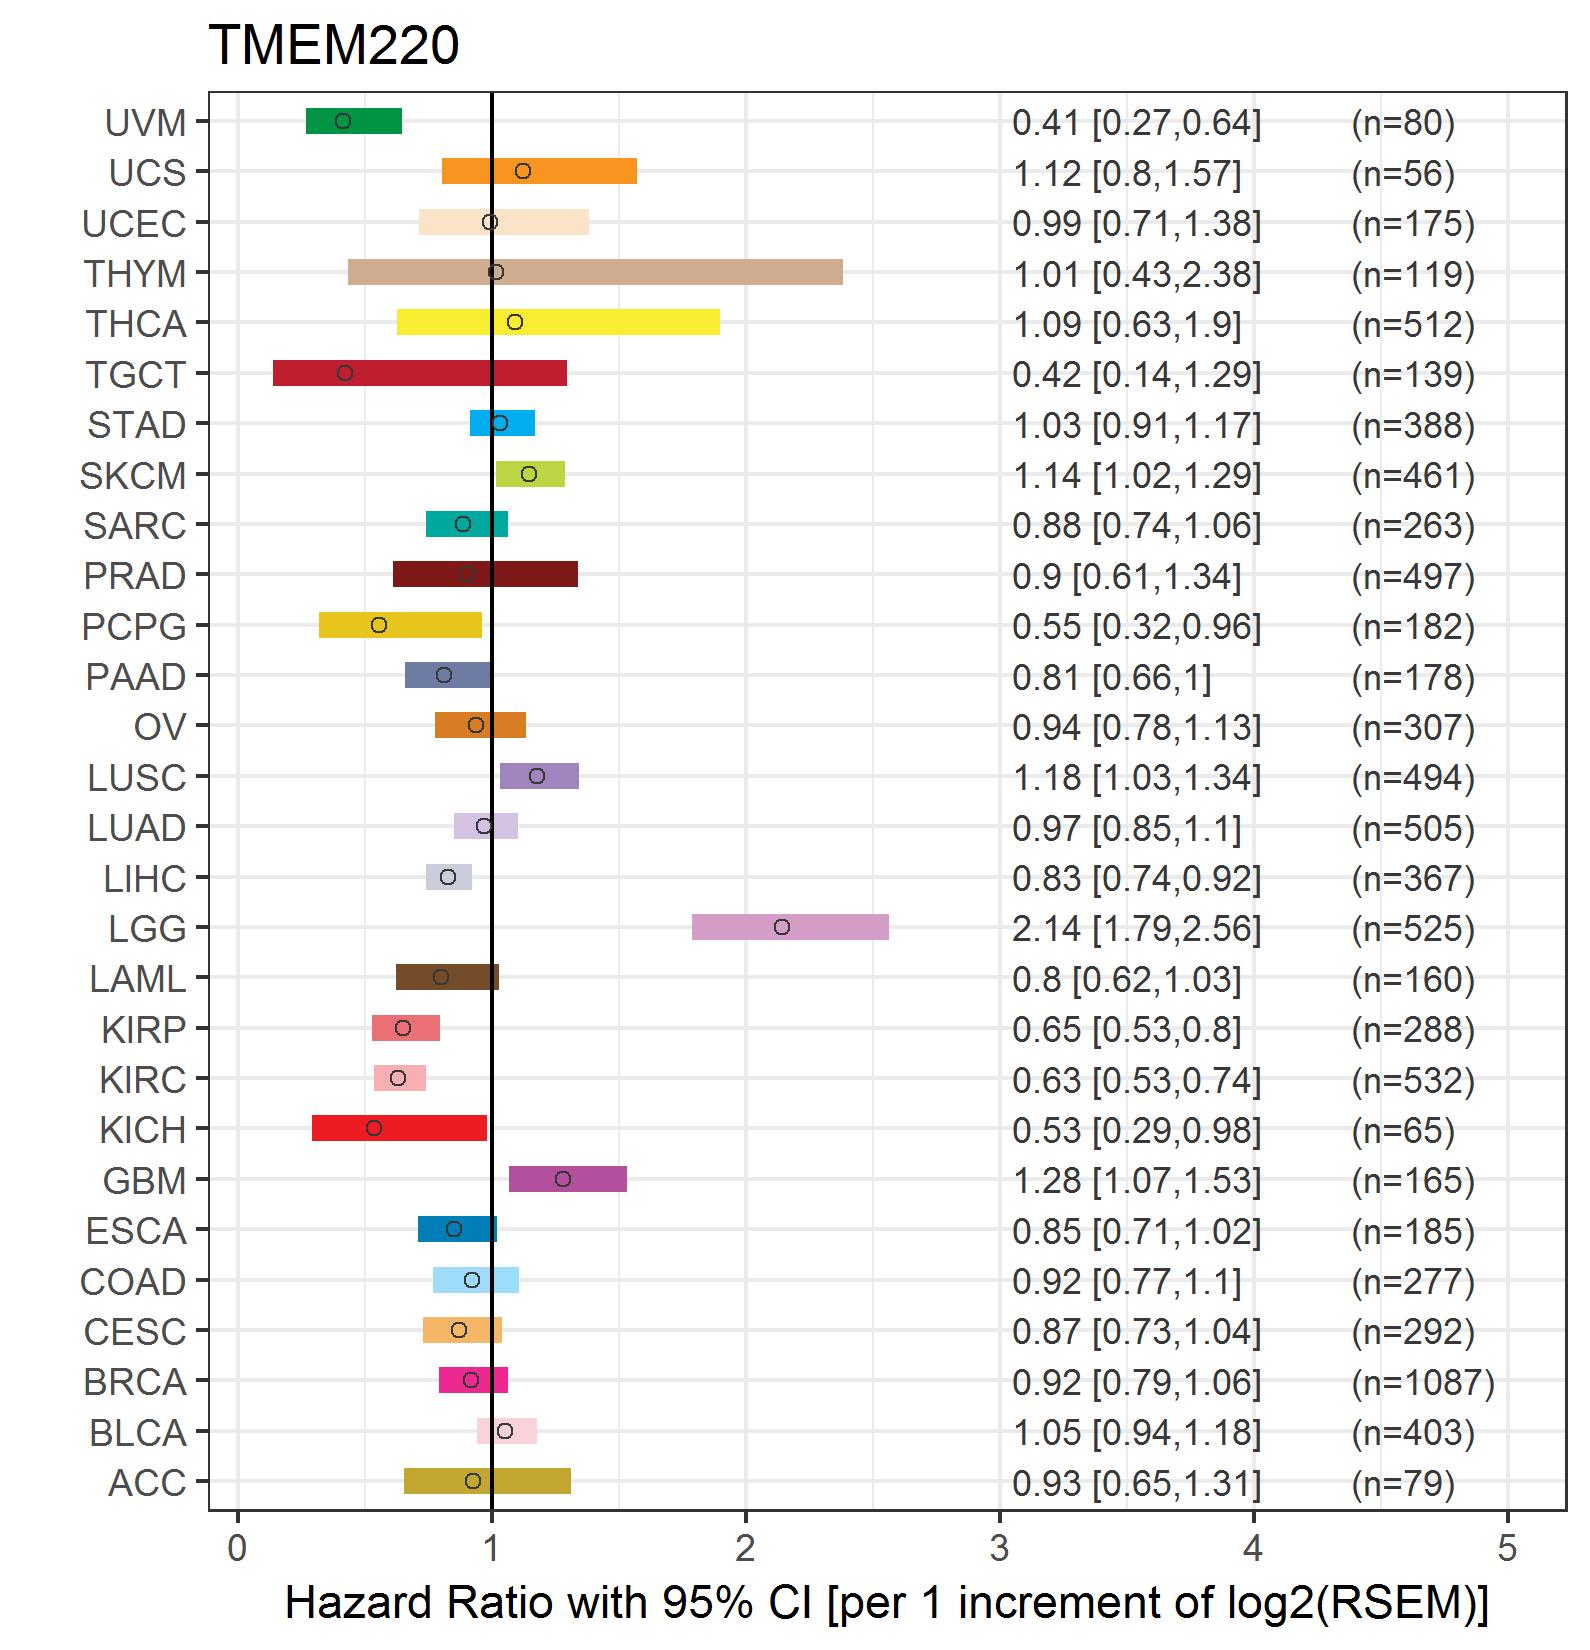 |
| Forest plot of Cox proportional hazard ratio (HR) and 95% CI of relapse free survival (RFS) using 28 cancer types (TCGA IlluminaHiSeq_RNASeqV2, pan-cancer normalized log2(norm_counts+1) data, version 2016-08-16) (TCGA clinicalMatrix, phenotype data, version 2016-04-27) * Click on the image enlarge it in a new window. |
 |
| Top |
| TissGeneClin for TMEM220 |
| TissGeneDrug for TMEM220 |
| Drug information targeting TissGene (DrugBank Version 5.0.6, 2017-04-01) |
| DrugBank ID | Drug name | Drug activity | Drug type | Drug status |
| Top |
| TissGeneDisease for TMEM220 |
| Disease information associated with TissGene (DisGeNet, 2016-06-01) |
| Disease ID | Disease name | # pubmeds | Source |
|
Copyright 2016-Present - The University of Texas Health Science Center at Houston (UTHealth) Web File Viewing | How to Report, Fraud, Waste and Abuse | State of Texas | Statewide Search | Texas Homeland Security | Site Policies |