 |
| |
| |
| |
| |
| |
| |
|

| TissGeneSummary for GBP7 |
 Gene summary Gene summary |
| Basic gene information | Gene symbol | GBP7 |
| Gene name | guanylate binding protein 7 | |
| Synonyms | GBP4L | |
| Cytomap | UCSC genome browser: 1p22.2 | |
| Type of gene | protein-coding | |
| RefGenes | NM_207398.2, | |
| Description | GBP-7GTP-binding protein 7guanine nucleotide-binding protein 7guanylate-binding protein 7 | |
| Modification date | 20141207 | |
| dbXrefs | MIM : 612468 | |
| HGNC : HGNC | ||
| Ensembl : ENSG00000213512 | ||
| HPRD : 13432 | ||
| Vega : OTTHUMG00000010659 | ||
| Protein | UniProt: go to UniProt's Cross Reference DB Table | |
| Expression | CleanEX: HS_GBP7 | |
| BioGPS: 388646 | ||
| Pathway | NCI Pathway Interaction Database: GBP7 | |
| KEGG: GBP7 | ||
| REACTOME: GBP7 | ||
| Pathway Commons: GBP7 | ||
| Context | iHOP: GBP7 | |
| ligand binding site mutation search in PubMed: GBP7 | ||
| UCL Cancer Institute: GBP7 | ||
| Assigned class in TissGDB* | C | |
| Included tissue-specific gene expression resources | HPA,GTEx | |
| Specific-tissues in normal samples (assigned by TissGDB using HPA, TiGER, and GTEx) | Liver | |
| Cancer types related to the specific-tissues in cancer samples (assigned by TissGDB using TCGA) | LIHC | |
| Reference showing the relevant tissue of GBP7 | ||
| Description by TissGene annotations | TissgsKTS | |
| * Class A consists of genes with literature evidence and is part of the cTissGenes. Class B consists of only cTissGenes without additional evidence. The remaining genes belong to Class C. |
| Gene ontology having evidence of Inferred from Direct Assay (IDA) from Entrez |
| GO ID | GO term | PubMed ID |
| Top |
| TissGeneExp for GBP7 |
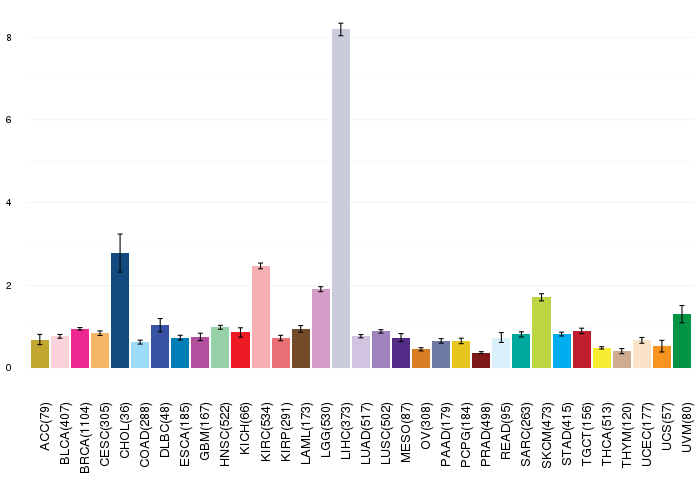
| Gene expressions across 28 cancer types (X-axis: cancer type and Y-axis: log2(norm_counts+1)) (TCGA IlluminaHiSeq_RNASeqV2, pan-cancer normalized log2(norm_counts+1) data, version 2016-08-16) |
 |
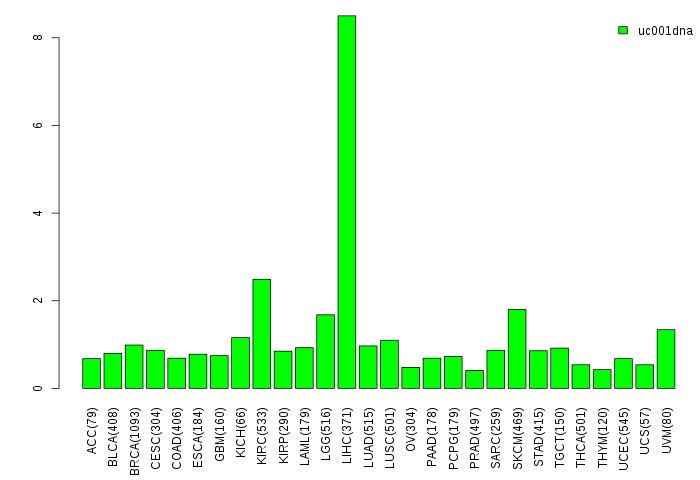
| Gene isoform expressions across 28 cancer types (X-axis: cancer type and Y-axis: log2(norm_counts+1)) (TCGA pan-cancer tcga_rsem_isoform_tpm, version 2016-09-01) |
 |
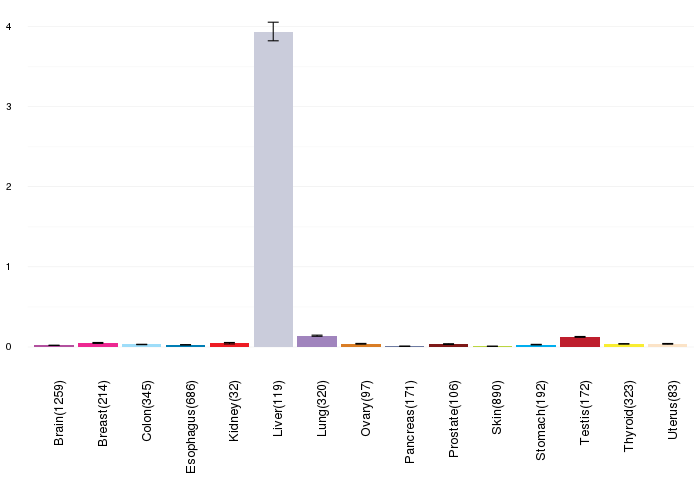
| Gene expressions across normal tissues of GTEx data (GTEx GTEx_Analysis_v6_RNA-seq_RNA-SeQCv1.1.8_gene_rpkm.gct) - Here, we shows the matched tissue types only among our 28 cancer types. |
 |
| Different expressions across 14 cancer types with more than 10 samples between matched tumors and normals (X-axis: cancer type and Y-axis: log2(norm_counts+1)) (TCGA IlluminaHiSeq_RNASeqV2, pan-cancer normalized log2(norm_counts+1) data, version 2016-08-16) |
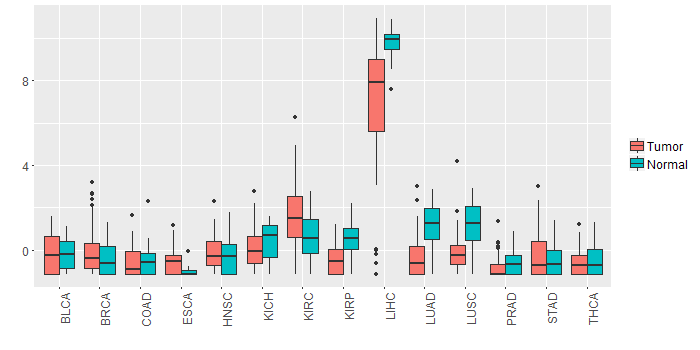 |
| - Significantly differentially expressed cancer types and information. (|Fold change|>1 and FDR<0.05) |
| Cancer type | Mean(exp) in tumor | Mean(exp) in matched normal | Log2FC | P-val. | FDR |
| LUSC | -0.106413283 | 1.27289456 | -1.379307843 | 2.44E-10 | 8.86E-10 |
| LUAD | -0.330744115 | 1.214055885 | -1.5448 | 6.37E-14 | 5.72E-13 |
| LIHC | 6.74539154 | 9.78445554 | -3.039064 | 6.98E-08 | 5.12E-07 |
| Top |
| TissGene-miRNA for GBP7 |
| Significantly anti-correlated miRNAs of TissGene across 28 cancer types (Gene-miRNA relations from TargetScanHuman Relsease 7.1, Conserved_Site_Context_Scores.txt.zip, 06.01.2016) (TCGA IlluminaHiSeq_miRNASeq, log2(RPM+1) data, version 2016-11-21) (TCGA IlluminaHiSeq_RNASeqV2, log2(normalized_count+1) data, version 2016-08-16) (Spearman’s Rank Correlation (p-value<0.05 and coefficient<-0.25)) |
| Cancer type | miRNA id | miRNA accession | P-val. | Coeff. | # samples |
| Top |
| TissGeneMut for GBP7 |
| TissGeneSNV for GBP7 |
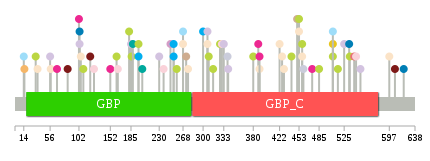
| nsSNV counts per each loci. Different colors of circles represent different cancer types. Circle size denotes number of samples. (TCGA somatic mutation (SNPs and small INDELs) data, version 2016-04-25) * Click on the image to enlarge it in a new window. |
 |
 |
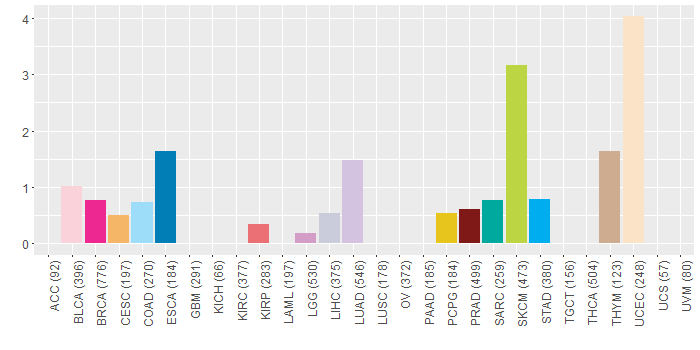
| Somatic nucleotide variants of TissGene across 28 cancer types (X-axis: cancer type and Y-axis: % of mutated samples) The numbers in parentheses are numbers of samples with mutation (nsSNVs). (TCGA somatic mutation (SNPs and small INDELs) data, version 2016-04-25) |
 |
| - nsSNVs sorted by frequency. |
| AAchange | Cancer type | # samples |
| p.F227L | HNSC | 1 |
| p.Q507E | SKCM | 1 |
| p.L597I | UCEC | 1 |
| p.E525Q | LUAD | 1 |
| p.Q507E | PCPG | 1 |
| p.A307V | UCEC | 1 |
| p.A203V | SARC | 1 |
| p.H248R | LGG | 1 |
| p.D182N | SKCM | 1 |
| p.P109S | SKCM | 1 |
| p.L460P | LIHC | 1 |
| p.E485K | SKCM | 1 |
| p.K57T | UCEC | 1 |
| p.R253X | STAD | 1 |
| p.A316T | SKCM | 1 |
| p.E162K | SKCM | 1 |
| p.E458K | HNSC | 1 |
| p.K188N | SARC | 1 |
| p.A330V | BLCA | 1 |
| p.E544Q | BLCA | 1 |
| p.S422P | UCEC | 1 |
| p.H551Q | LUAD | 1 |
| p.N56K | LUAD | 1 |
| p.F268L | COAD | 1 |
| p.A33V | SKCM | 1 |
| p.E186K | SKCM | 1 |
| p.L67Q | BRCA | 1 |
| p.V120L | PRAD | 1 |
| p.S73C | HNSC | 1 |
| p.G453* | UCEC | 1 |
| p.R577X | READ | 1 |
| p.R412W | HNSC | 1 |
| p.R253* | STAD | 1 |
| p.A339T | LIHC | 1 |
| p.E458K | SKCM | 1 |
| p.D103N | LUAD | 1 |
| p.P429L | UCEC | 1 |
| p.H333L | LUAD | 1 |
| p.Q36H | UCEC | 1 |
| p.M515I | SKCM | 1 |
| p.G102S | BRCA | 1 |
| p.P450H | THYM | 1 |
| p.E458K | UCEC | 1 |
| p.K390R | UCEC | 1 |
| p.L246F | HNSC | 1 |
| p.F273L | THYM | 1 |
| p.P84S | PRAD | 1 |
| p.K441M | SKCM | 1 |
| p.D258N | SKCM | 1 |
| p.K230I | LUAD | 1 |
| p.E105* | UCEC | 1 |
| p.K533N | ESCA | 1 |
| p.E15Q | CESC | 1 |
| p.I474M | BRCA | 1 |
| p.E164* | BLCA | 1 |
| p.D237H | BLCA | 1 |
| p.M534I | SKCM | 1 |
| p.F126L | BLCA | 1 |
| p.A606V | PRAD | 1 |
| p.K620T | ESCA | 1 |
| p.E99D | READ | 1 |
| p.T14I | COAD | 1 |
| p.F426L | UCEC | 1 |
| p.Q380* | SKCM | 1 |
| p.L185M | LUAD | 1 |
| p.P309L | SKCM | 1 |
| p.L300M | STAD | 1 |
| p.D197V | SKCM | 1 |
| p.D197E | STAD | 1 |
| p.E388D | BRCA | 1 |
| p.K390N | BRCA | 1 |
| p.V327A | SKCM | 1 |
| p.M368I | DLBC | 1 |
| p.E186K | HNSC | 1 |
| p.I152M | BRCA | 1 |
| p.A307V | LUAD | 1 |
| p.Q507E | COAD | 1 |
| p.G453E | SKCM | 1 |
| p.E283Q | READ | 1 |
| p.Q340H | LUAD | 1 |
| p.Y541F | KIRP | 1 |
| p.F268L | UCEC | 1 |
| p.D103V | ESCA | 1 |
| p.A276T | UCEC | 1 |
| Top |
| TissGeneCNV for GBP7 |
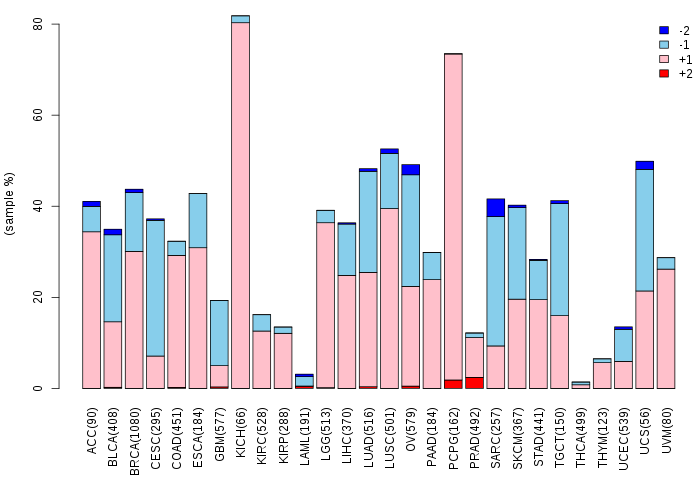
| Copy number variations of TissGene across 28 cancer types (X-axis: cancer type and Y-axis: % of CNV samples) (TCGA Gistic2_CopyNumber_Gistic2_all_data_by_genes, Gistic2 copy number data, version 2016-08-16) |
 |
| Top |
| TissGeneFusions for GBP7 |
| Fusion genes including TissGene (ChimerDB 3.0, 2016-12-01 and TCGA fusion Portal 2015-12-01) |
| Database | Src | Cancer type | Sample | Fusion gene | ORF | 5'-gene BP | 3'-gene BP |
| Top |
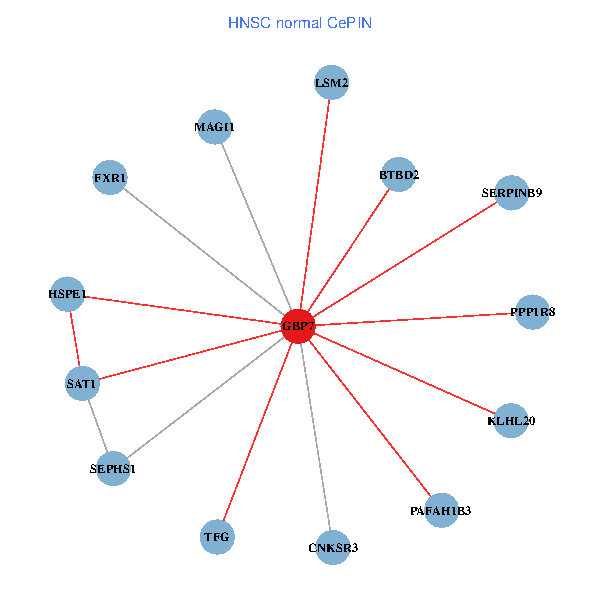
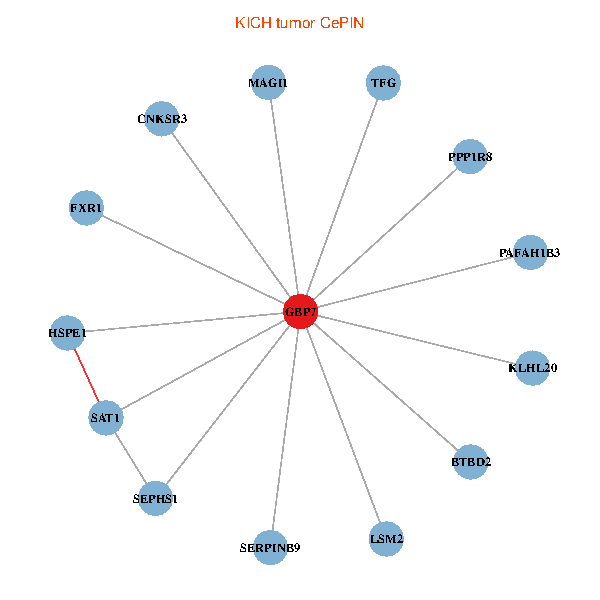
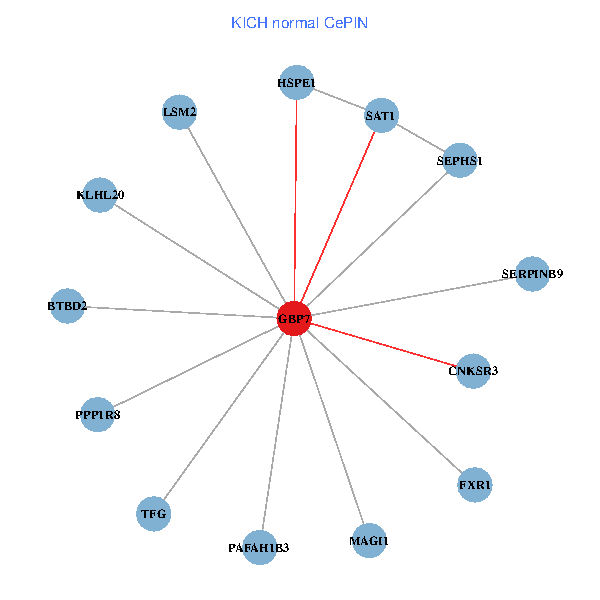
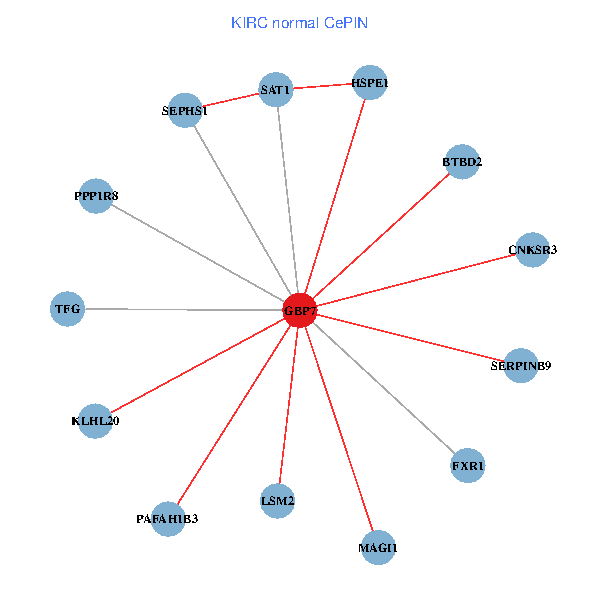
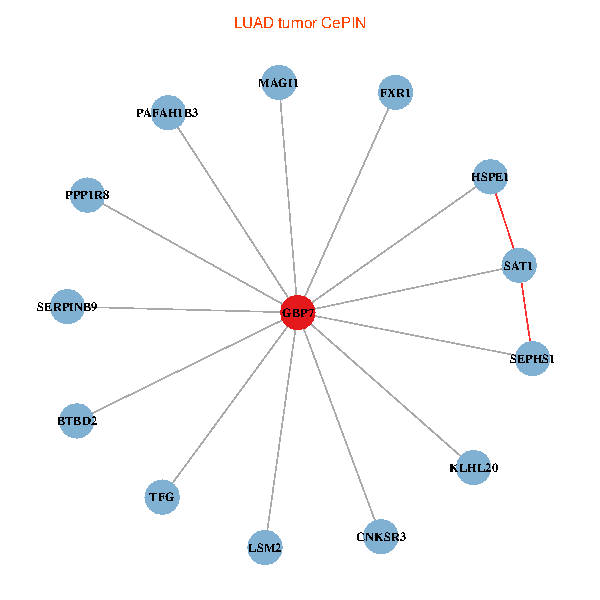
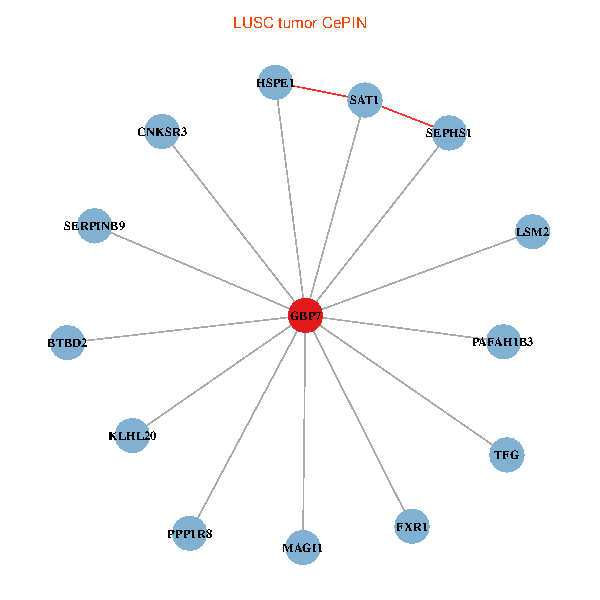
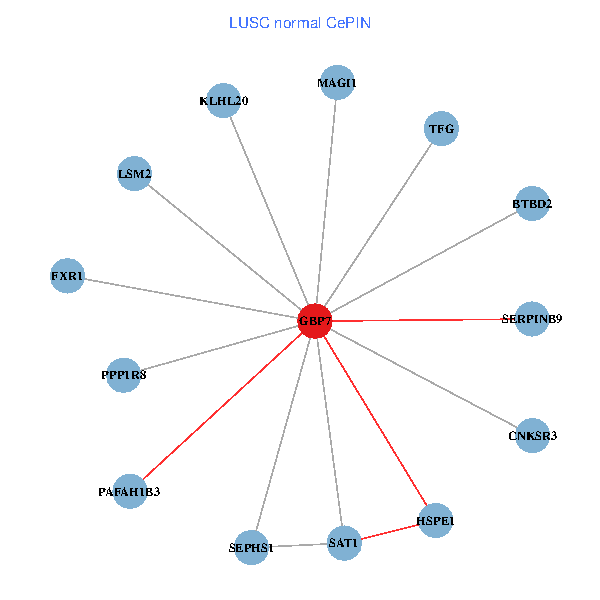
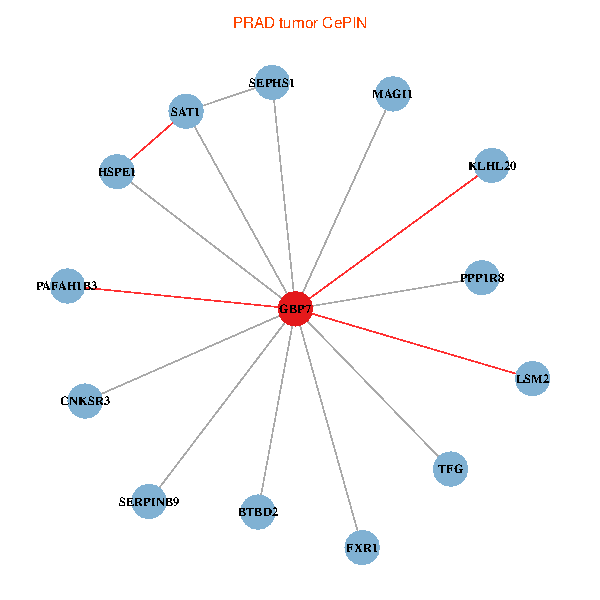
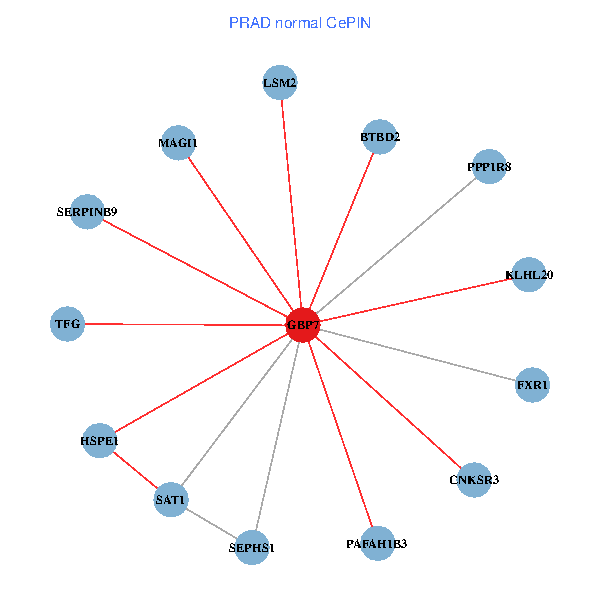
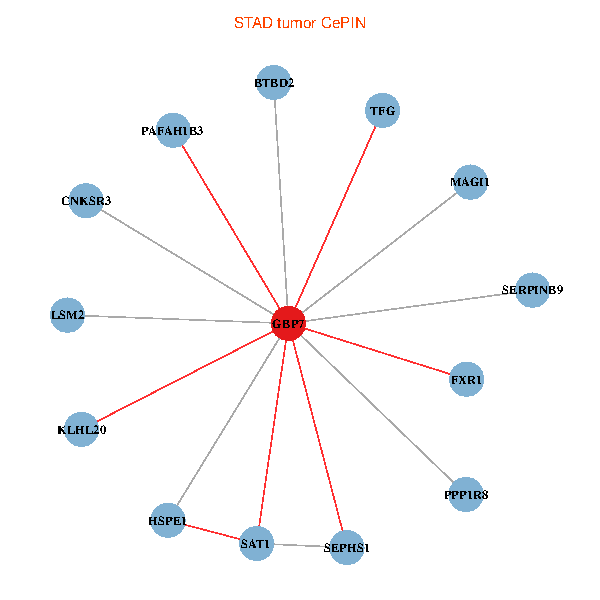
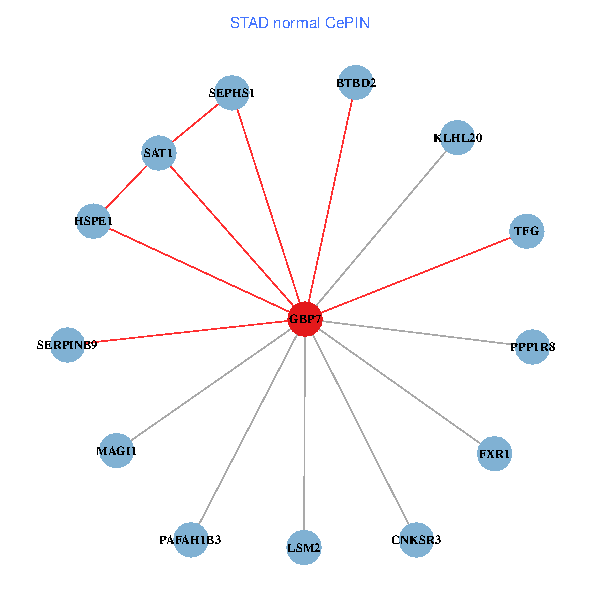
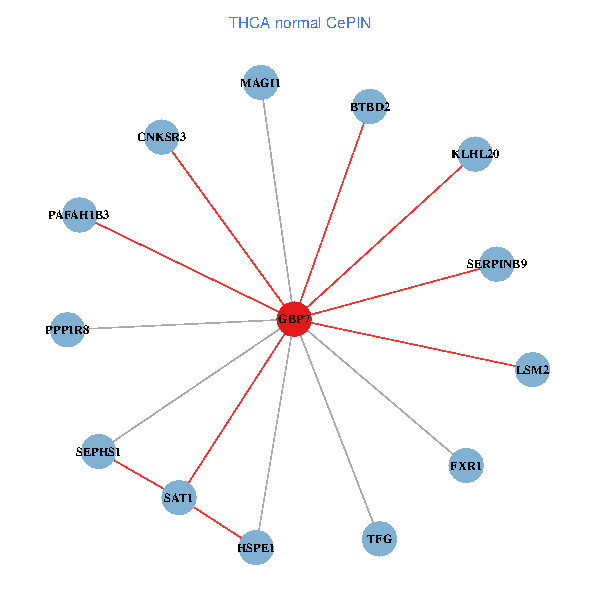
| TissGeneNet for GBP7 |
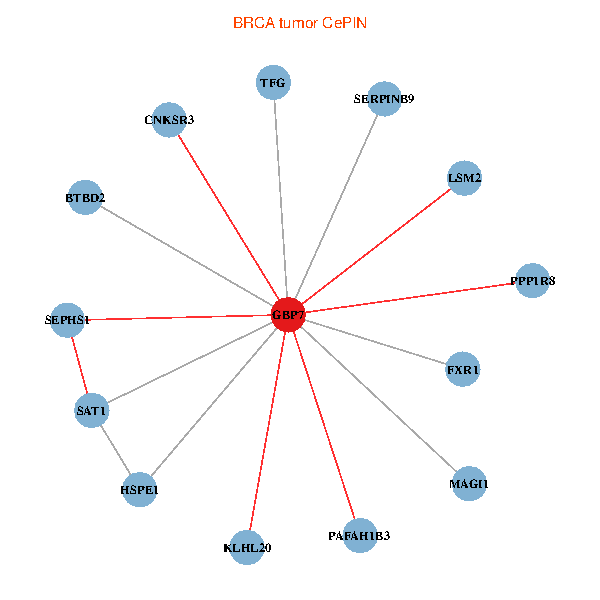
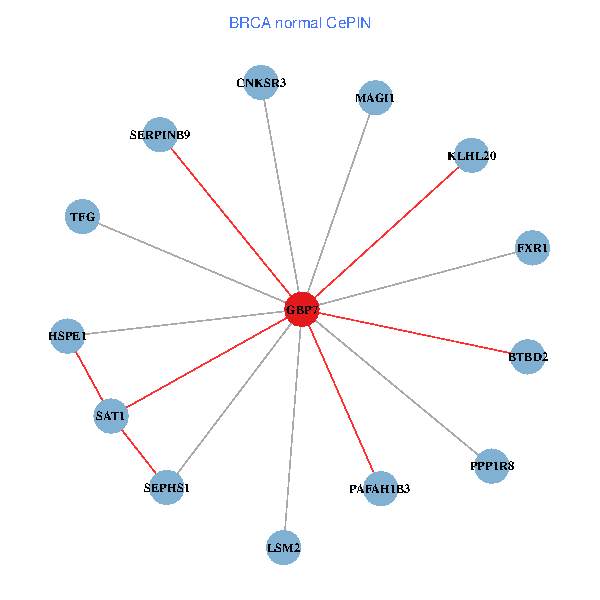
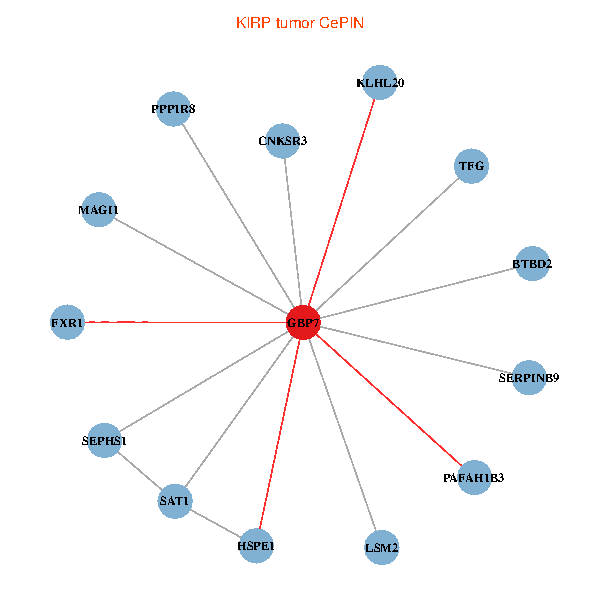
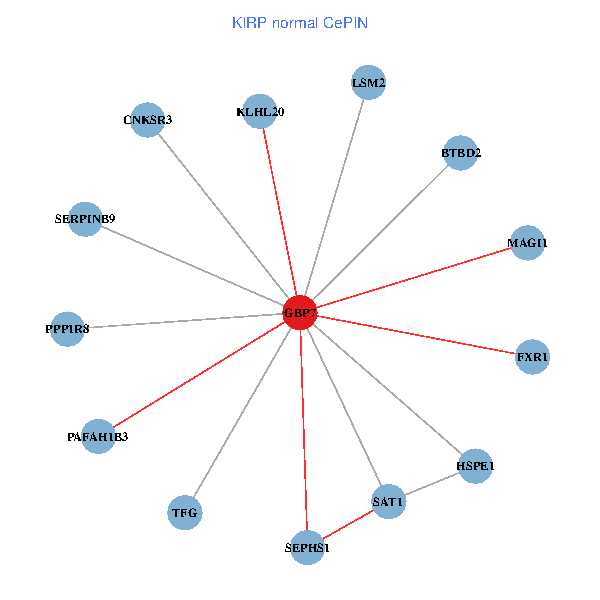
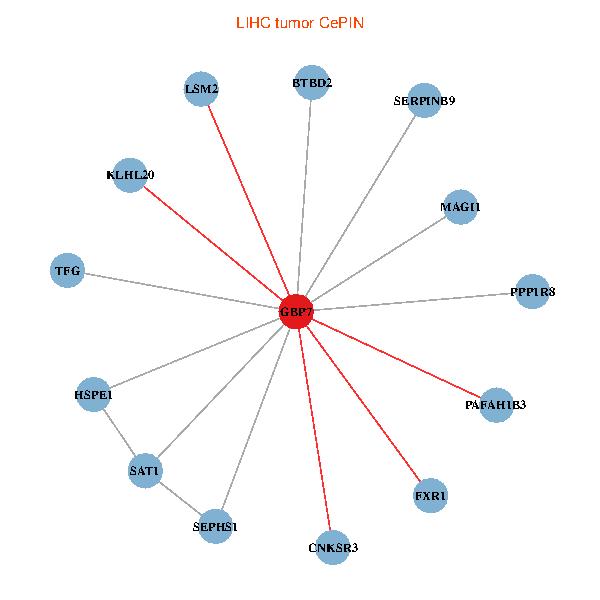
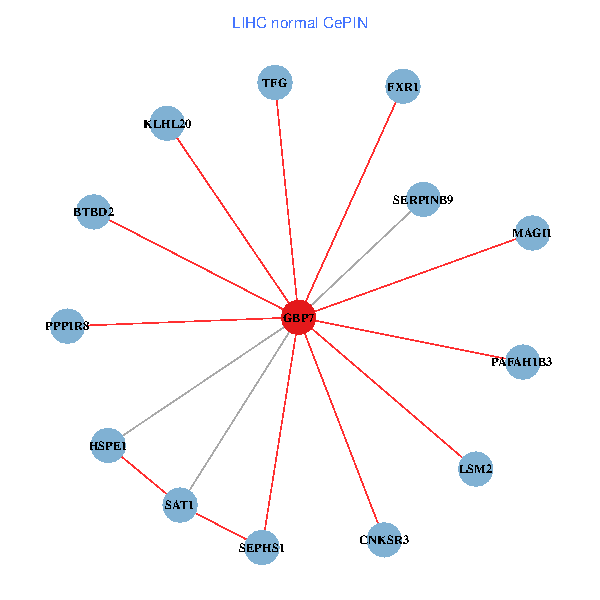
| Co-expressed gene networks based on protein-protein interaction data (CePIN) (TCGA IlluminaHiSeq_RNASeqV2, pan-cancer normalized log2(norm_counts+1) data, version 2016-08-16) (PINA2 ppi data) |
| BRCA (tumor) | BRCA (normal) |
| GBP7, PAFAH1B3, MAGI1, TFG, HSPE1, SAT1, PPP1R8, FXR1, SEPHS1, SERPINB9, KLHL20, LSM2, BTBD2, CNKSR3 (tumor) | GBP7, PAFAH1B3, MAGI1, TFG, HSPE1, SAT1, PPP1R8, FXR1, SEPHS1, SERPINB9, KLHL20, LSM2, BTBD2, CNKSR3 (normal) |
 |  |
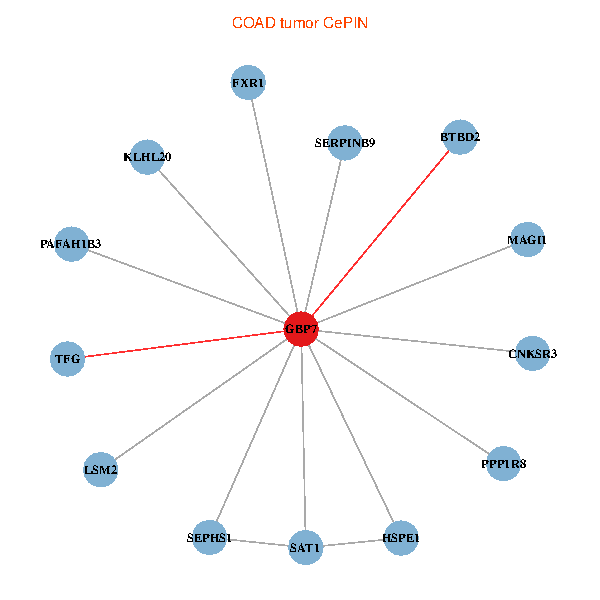
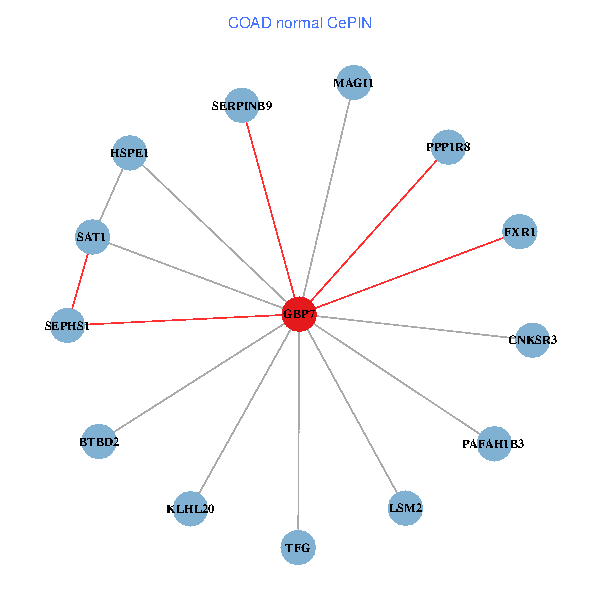
| COAD (tumor) | COAD (normal) |
| GBP7, PAFAH1B3, MAGI1, TFG, HSPE1, SAT1, PPP1R8, FXR1, SEPHS1, SERPINB9, KLHL20, LSM2, BTBD2, CNKSR3 (tumor) | GBP7, PAFAH1B3, MAGI1, TFG, HSPE1, SAT1, PPP1R8, FXR1, SEPHS1, SERPINB9, KLHL20, LSM2, BTBD2, CNKSR3 (normal) |
 |  |
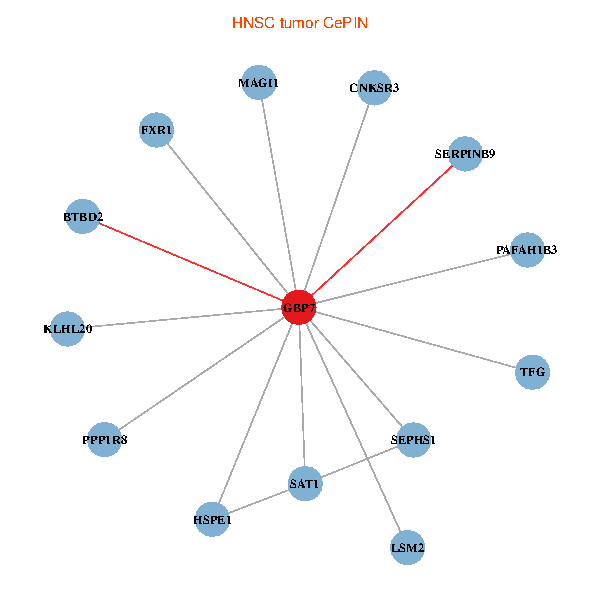
| HNSC (tumor) | HNSC (normal) |
| GBP7, PAFAH1B3, MAGI1, TFG, HSPE1, SAT1, PPP1R8, FXR1, SEPHS1, SERPINB9, KLHL20, LSM2, BTBD2, CNKSR3 (tumor) | GBP7, PAFAH1B3, MAGI1, TFG, HSPE1, SAT1, PPP1R8, FXR1, SEPHS1, SERPINB9, KLHL20, LSM2, BTBD2, CNKSR3 (normal) |
 |  |
| KICH (tumor) | KICH (normal) |
| GBP7, PAFAH1B3, MAGI1, TFG, HSPE1, SAT1, PPP1R8, FXR1, SEPHS1, SERPINB9, KLHL20, LSM2, BTBD2, CNKSR3 (tumor) | GBP7, PAFAH1B3, MAGI1, TFG, HSPE1, SAT1, PPP1R8, FXR1, SEPHS1, SERPINB9, KLHL20, LSM2, BTBD2, CNKSR3 (normal) |
 |  |
| KIRC (tumor) | KIRC (normal) |
| GBP7, PAFAH1B3, MAGI1, TFG, HSPE1, SAT1, PPP1R8, FXR1, SEPHS1, SERPINB9, KLHL20, LSM2, BTBD2, CNKSR3 (tumor) | GBP7, PAFAH1B3, MAGI1, TFG, HSPE1, SAT1, PPP1R8, FXR1, SEPHS1, SERPINB9, KLHL20, LSM2, BTBD2, CNKSR3 (normal) |
 |  |
| KIRP (tumor) | KIRP (normal) |
| GBP7, PAFAH1B3, MAGI1, TFG, HSPE1, SAT1, PPP1R8, FXR1, SEPHS1, SERPINB9, KLHL20, LSM2, BTBD2, CNKSR3 (tumor) | GBP7, PAFAH1B3, MAGI1, TFG, HSPE1, SAT1, PPP1R8, FXR1, SEPHS1, SERPINB9, KLHL20, LSM2, BTBD2, CNKSR3 (normal) |
 |  |
| LIHC (tumor) | LIHC (normal) |
| GBP7, PAFAH1B3, MAGI1, TFG, HSPE1, SAT1, PPP1R8, FXR1, SEPHS1, SERPINB9, KLHL20, LSM2, BTBD2, CNKSR3 (tumor) | GBP7, PAFAH1B3, MAGI1, TFG, HSPE1, SAT1, PPP1R8, FXR1, SEPHS1, SERPINB9, KLHL20, LSM2, BTBD2, CNKSR3 (normal) |
 |  |
| LUAD (tumor) | LUAD (normal) |
| GBP7, PAFAH1B3, MAGI1, TFG, HSPE1, SAT1, PPP1R8, FXR1, SEPHS1, SERPINB9, KLHL20, LSM2, BTBD2, CNKSR3 (tumor) | GBP7, PAFAH1B3, MAGI1, TFG, HSPE1, SAT1, PPP1R8, FXR1, SEPHS1, SERPINB9, KLHL20, LSM2, BTBD2, CNKSR3 (normal) |
 |  |
| LUSC (tumor) | LUSC (normal) |
| GBP7, PAFAH1B3, MAGI1, TFG, HSPE1, SAT1, PPP1R8, FXR1, SEPHS1, SERPINB9, KLHL20, LSM2, BTBD2, CNKSR3 (tumor) | GBP7, PAFAH1B3, MAGI1, TFG, HSPE1, SAT1, PPP1R8, FXR1, SEPHS1, SERPINB9, KLHL20, LSM2, BTBD2, CNKSR3 (normal) |
 |  |
| PRAD (tumor) | PRAD (normal) |
| GBP7, PAFAH1B3, MAGI1, TFG, HSPE1, SAT1, PPP1R8, FXR1, SEPHS1, SERPINB9, KLHL20, LSM2, BTBD2, CNKSR3 (tumor) | GBP7, PAFAH1B3, MAGI1, TFG, HSPE1, SAT1, PPP1R8, FXR1, SEPHS1, SERPINB9, KLHL20, LSM2, BTBD2, CNKSR3 (normal) |
 |  |
| STAD (tumor) | STAD (normal) |
| GBP7, PAFAH1B3, MAGI1, TFG, HSPE1, SAT1, PPP1R8, FXR1, SEPHS1, SERPINB9, KLHL20, LSM2, BTBD2, CNKSR3 (tumor) | GBP7, PAFAH1B3, MAGI1, TFG, HSPE1, SAT1, PPP1R8, FXR1, SEPHS1, SERPINB9, KLHL20, LSM2, BTBD2, CNKSR3 (normal) |
 |  |
| THCA (tumor) | THCA (normal) |
| GBP7, PAFAH1B3, MAGI1, TFG, HSPE1, SAT1, PPP1R8, FXR1, SEPHS1, SERPINB9, KLHL20, LSM2, BTBD2, CNKSR3 (tumor) | GBP7, PAFAH1B3, MAGI1, TFG, HSPE1, SAT1, PPP1R8, FXR1, SEPHS1, SERPINB9, KLHL20, LSM2, BTBD2, CNKSR3 (normal) |
 |  |
| Top |
| TissGeneProg for GBP7 |
| Kaplan-Meier plots with logrank tests of overall survival (OS) using 28 cancer types (TCGA IlluminaHiSeq_RNASeqV2, pan-cancer normalized log2(norm_counts+1) data, version 2016-08-16) (TCGA clinicalMatrix, phenotype data, version 2016-04-27) * Click on the image to enlarge it in a new window. |
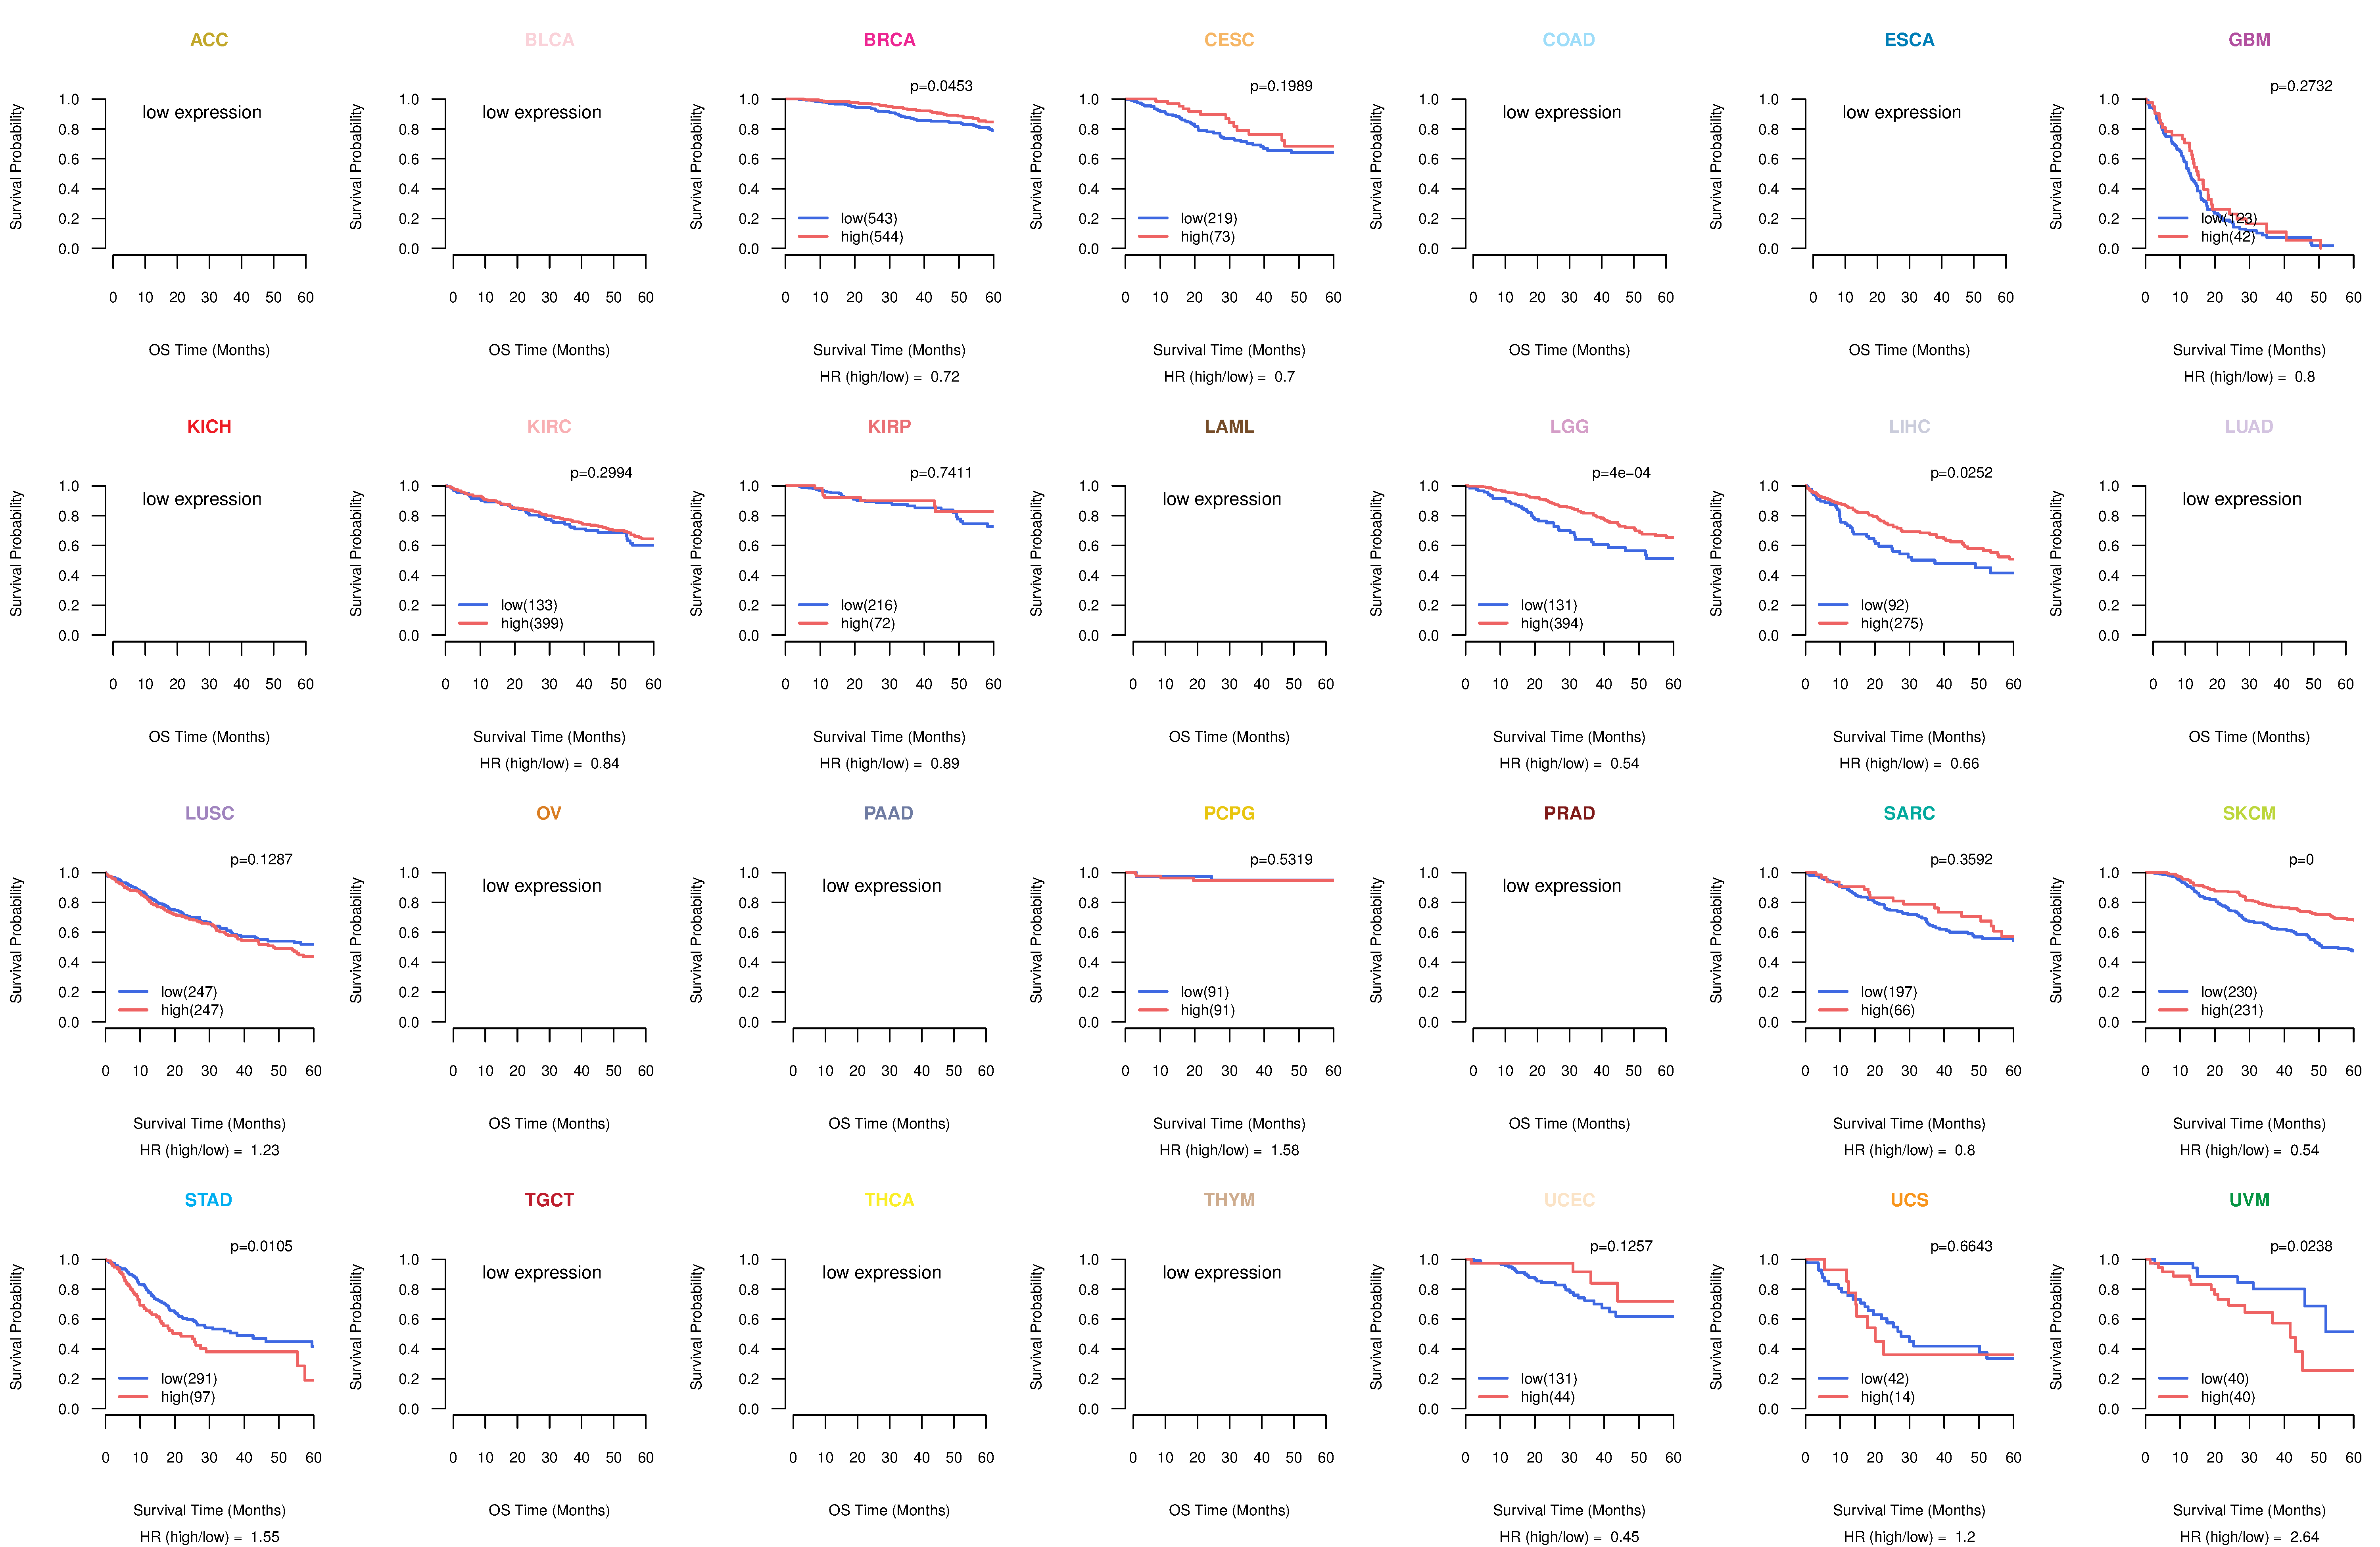 |
| Kaplan-Meier plots with logrank test of relapse free survival (RFS) using 28 cancer types (TCGA IlluminaHiSeq_RNASeqV2, pan-cancer normalized log2(norm_counts+1) data, version 2016-08-16) (TCGA clinicalMatrix, phenotype data, version 2016-04-27) * Click on the image enlarge it in a new window. |
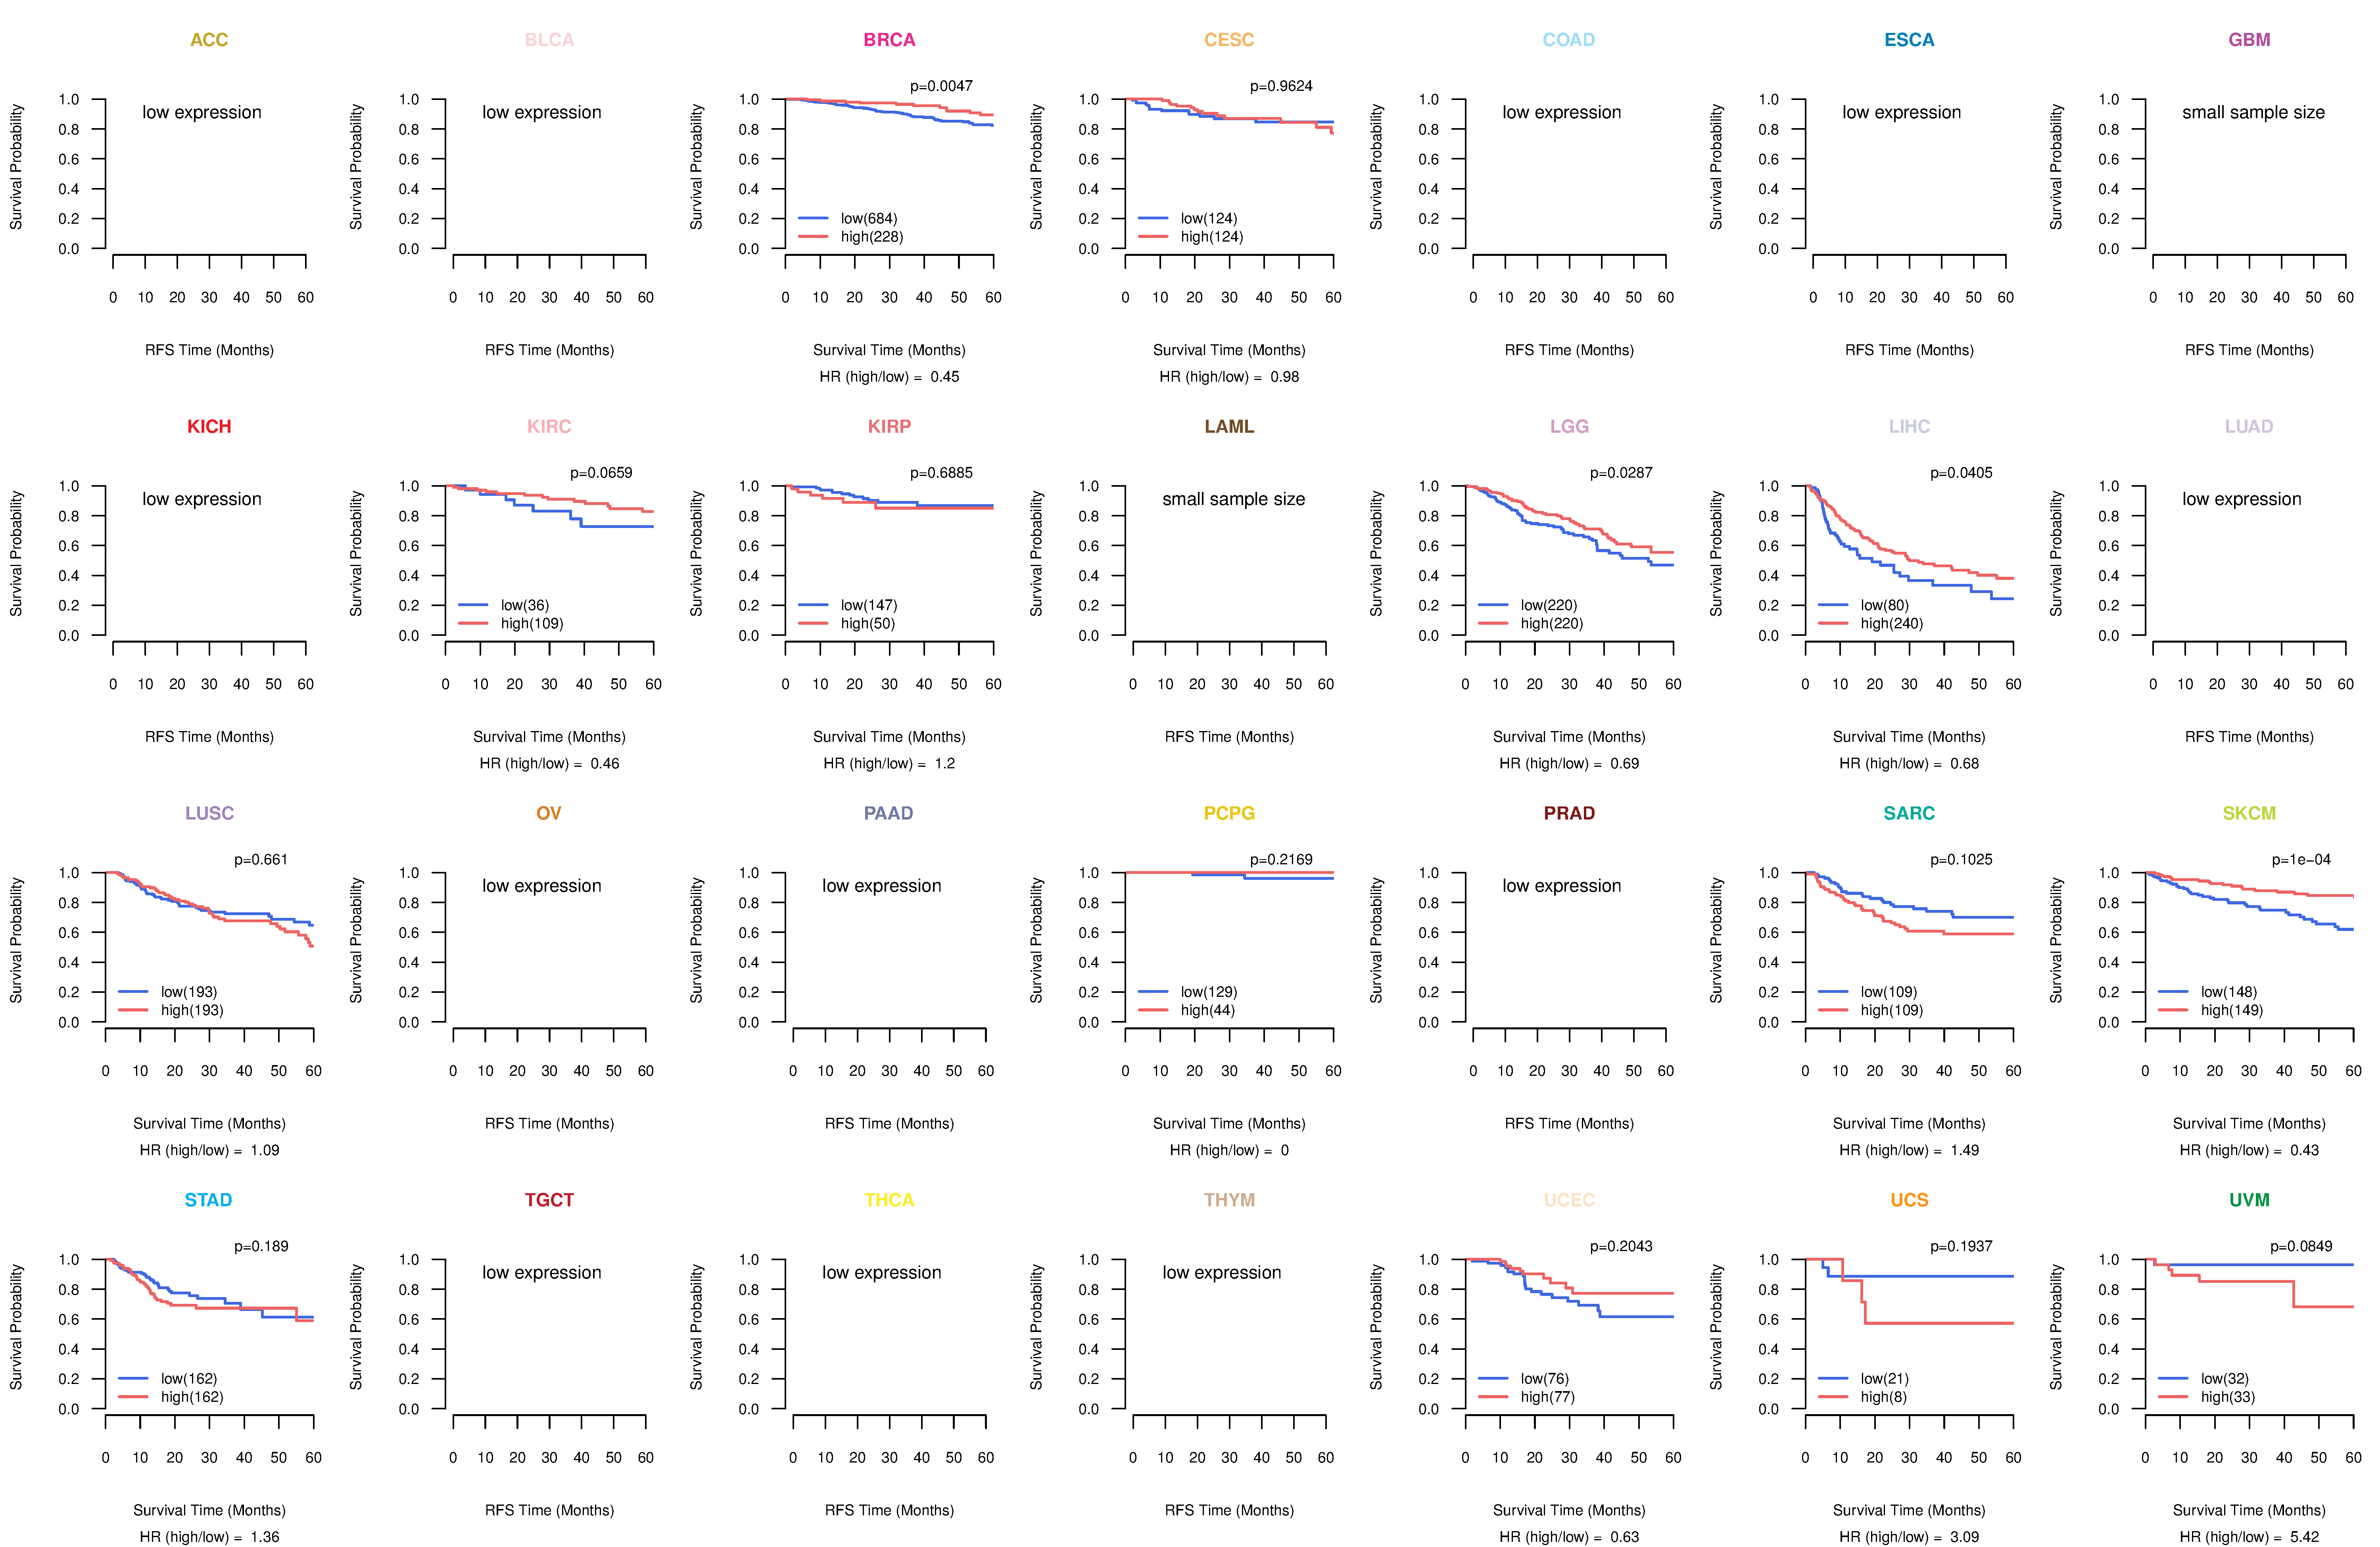 |
| Forest plot of Cox proportional hazard ratio (HR) and 95% CI of overall survival (OS) using 28 cancer types (TCGA IlluminaHiSeq_RNASeqV2, pan-cancer normalized log2(norm_counts+1) data, version 2016-08-16) (TCGA clinicalMatrix, phenotype data, version 2016-04-27) * Click on the image enlarge it in a new window. |
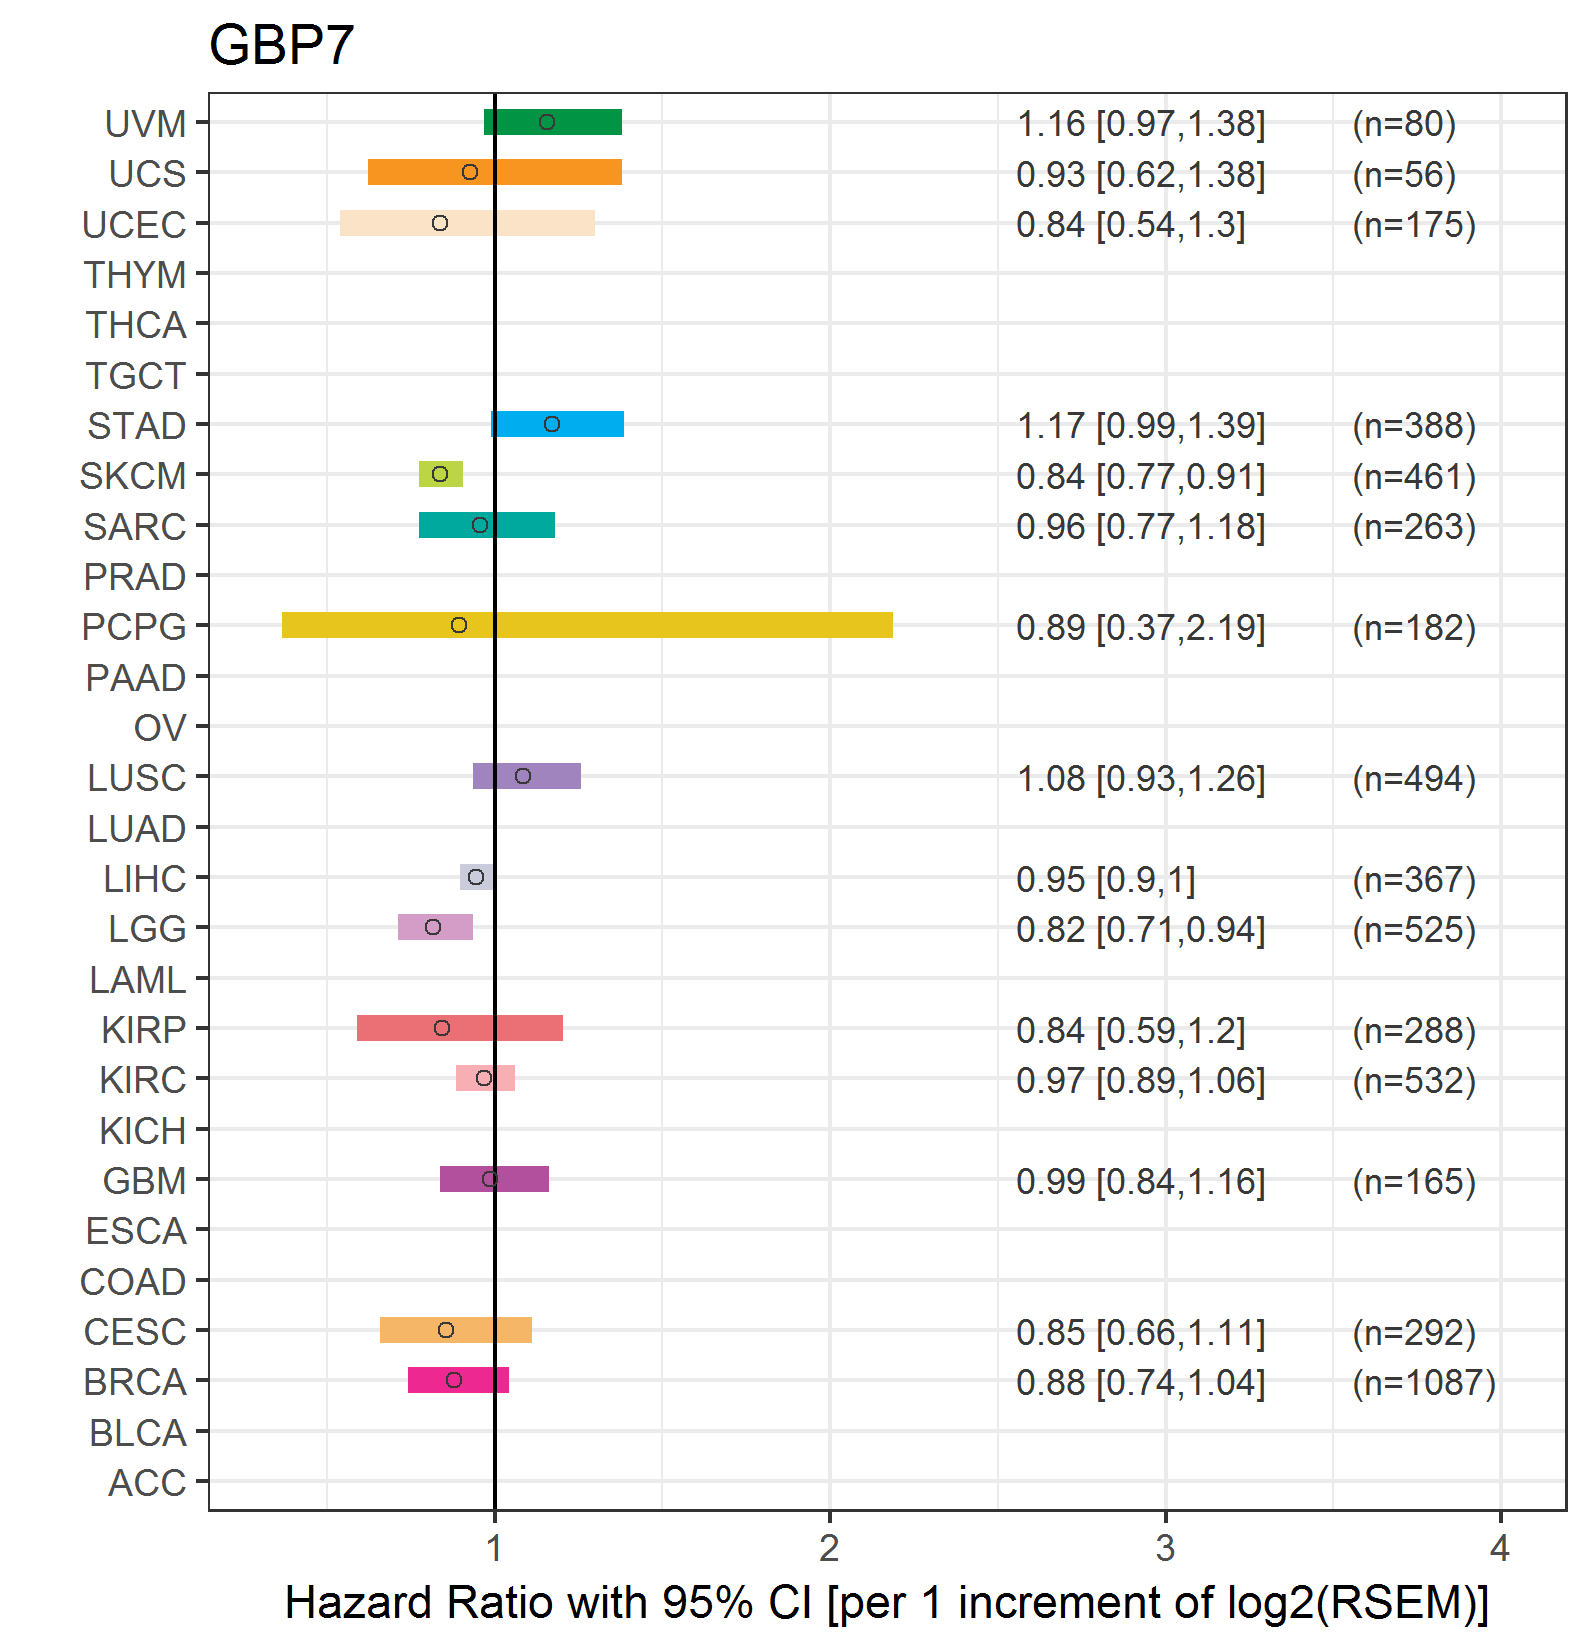 |
| Forest plot of Cox proportional hazard ratio (HR) and 95% CI of relapse free survival (RFS) using 28 cancer types (TCGA IlluminaHiSeq_RNASeqV2, pan-cancer normalized log2(norm_counts+1) data, version 2016-08-16) (TCGA clinicalMatrix, phenotype data, version 2016-04-27) * Click on the image enlarge it in a new window. |
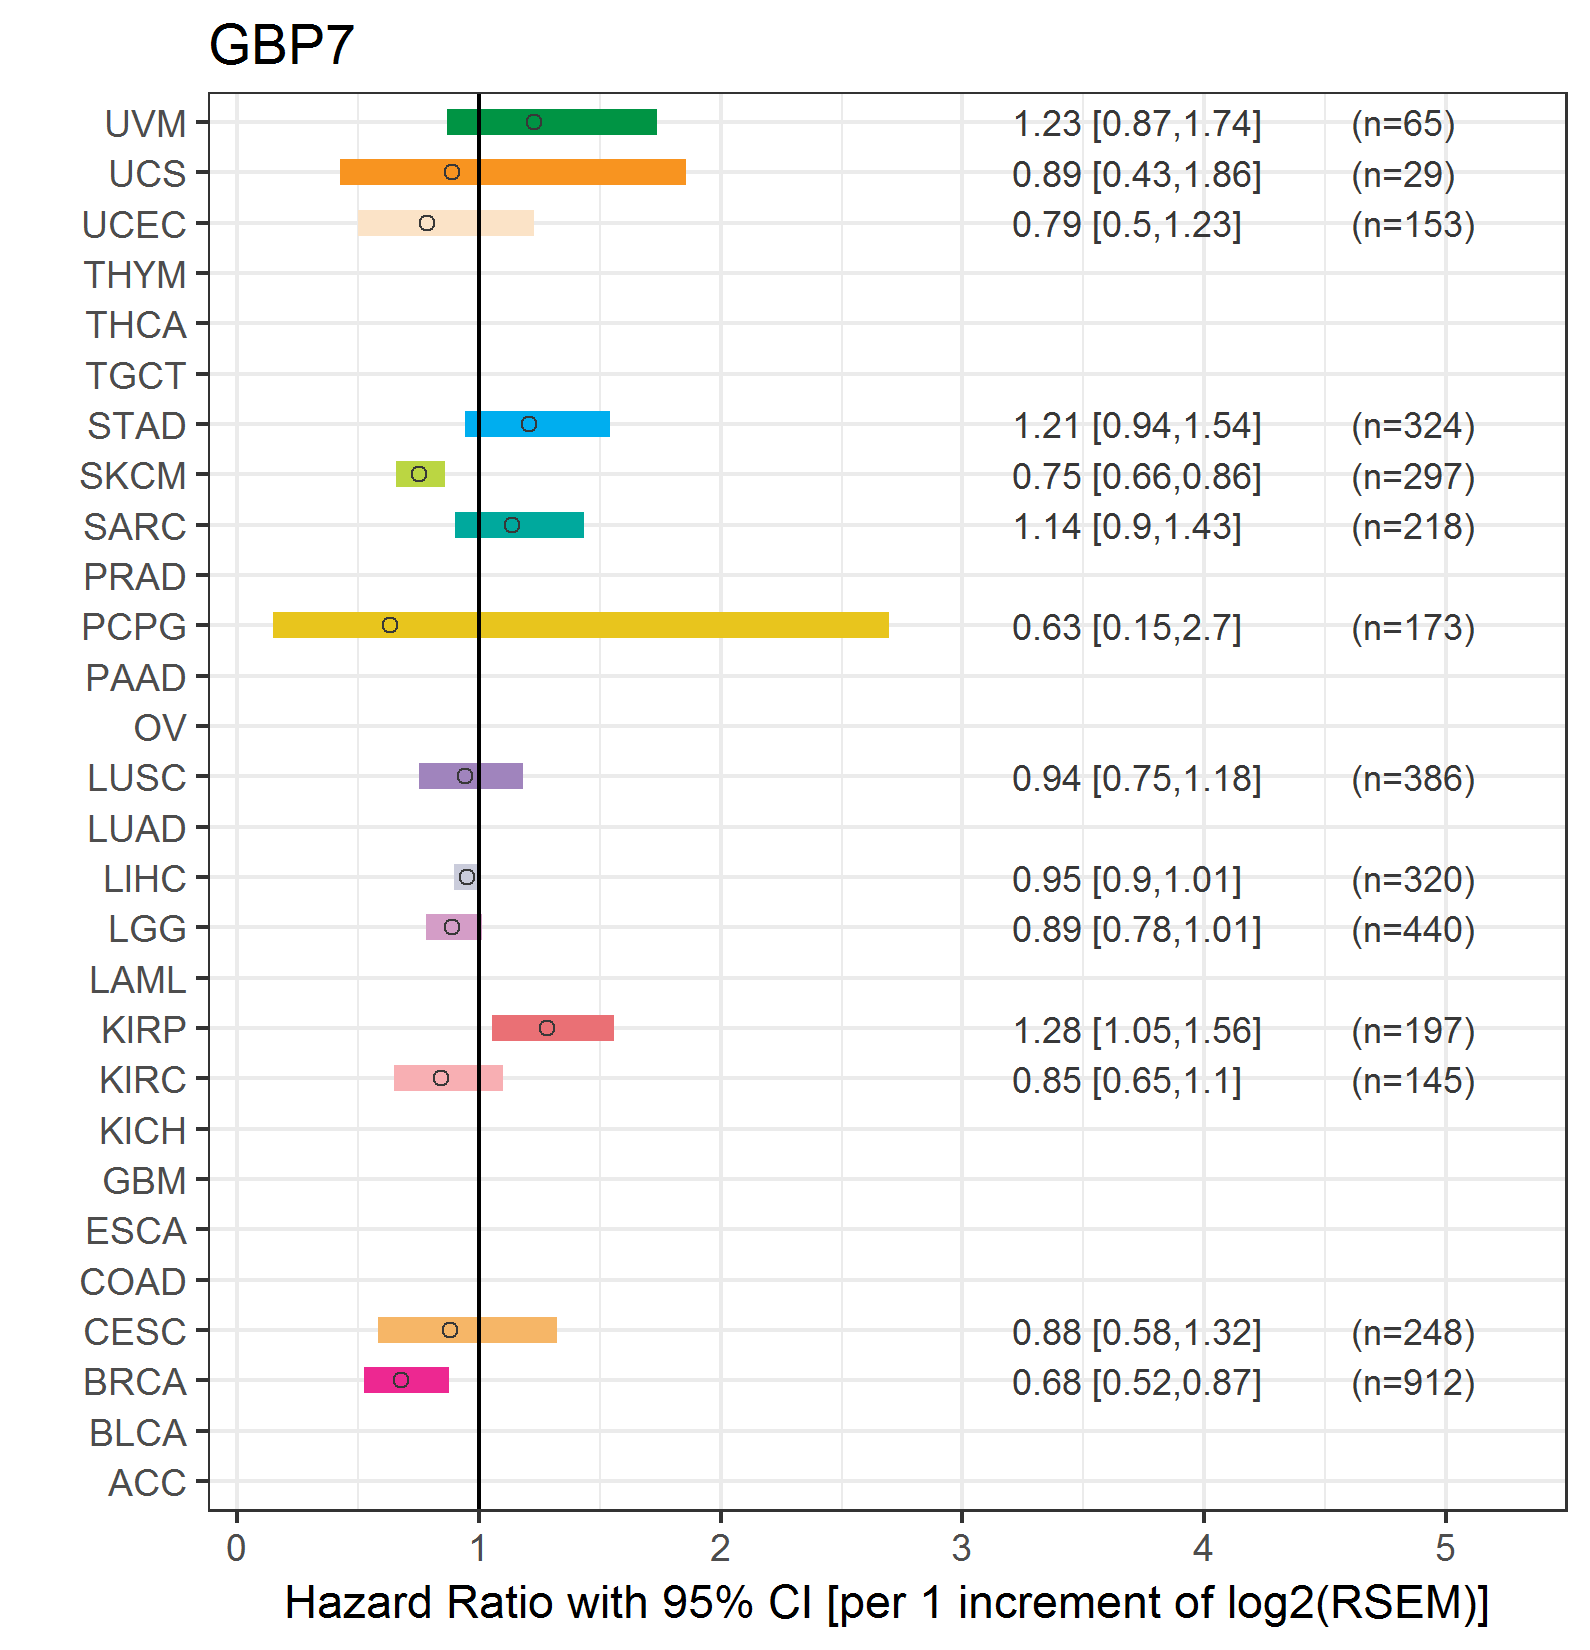 |
| Top |
| TissGeneClin for GBP7 |
| TissGeneDrug for GBP7 |
| Drug information targeting TissGene (DrugBank Version 5.0.6, 2017-04-01) |
| DrugBank ID | Drug name | Drug activity | Drug type | Drug status |
| Top |
| TissGeneDisease for GBP7 |
| Disease information associated with TissGene (DisGeNet, 2016-06-01) |
| Disease ID | Disease name | # pubmeds | Source |
| umls:C0024535 | Malaria, Falciparum | 1 | GAD |
|
Copyright 2016-Present - The University of Texas Health Science Center at Houston (UTHealth) Web File Viewing | How to Report, Fraud, Waste and Abuse | State of Texas | Statewide Search | Texas Homeland Security | Site Policies |