 |
| |
| |
| |
| |
| |
| |
|

| TissGeneSummary for XKR9 |
 Gene summary Gene summary |
| Basic gene information | Gene symbol | XKR9 |
| Gene name | XK, Kell blood group complex subunit-related family, member 9 | |
| Synonyms | XRG9 | |
| Cytomap | UCSC genome browser: 8q13.3 | |
| Type of gene | protein-coding | |
| RefGenes | NM_001011720.1, NM_001287258.1,NM_001287259.1,NM_001287260.1, | |
| Description | X Kell blood group precursor-related family, member 9XK-related protein 9 | |
| Modification date | 20141207 | |
| dbXrefs | HGNC : HGNC | |
| Ensembl : ENSG00000221947 | ||
| HPRD : 18309 | ||
| Vega : OTTHUMG00000164431 | ||
| Protein | UniProt: go to UniProt's Cross Reference DB Table | |
| Expression | CleanEX: HS_XKR9 | |
| BioGPS: 389668 | ||
| Pathway | NCI Pathway Interaction Database: XKR9 | |
| KEGG: XKR9 | ||
| REACTOME: XKR9 | ||
| Pathway Commons: XKR9 | ||
| Context | iHOP: XKR9 | |
| ligand binding site mutation search in PubMed: XKR9 | ||
| UCL Cancer Institute: XKR9 | ||
| Assigned class in TissGDB* | C | |
| Included tissue-specific gene expression resources | TiGER,GTEx | |
| Specific-tissues in normal samples (assigned by TissGDB using HPA, TiGER, and GTEx) | ColonTestis | |
| Cancer types related to the specific-tissues in cancer samples (assigned by TissGDB using TCGA) | COADTGCT | |
| Reference showing the relevant tissue of XKR9 | ||
| Description by TissGene annotations | Have significant anti-correlated miRNA | |
| * Class A consists of genes with literature evidence and is part of the cTissGenes. Class B consists of only cTissGenes without additional evidence. The remaining genes belong to Class C. |
| Gene ontology having evidence of Inferred from Direct Assay (IDA) from Entrez |
| GO ID | GO term | PubMed ID |
| Top |
| TissGeneExp for XKR9 |
| Gene expressions across 28 cancer types (X-axis: cancer type and Y-axis: log2(norm_counts+1)) (TCGA IlluminaHiSeq_RNASeqV2, pan-cancer normalized log2(norm_counts+1) data, version 2016-08-16) |
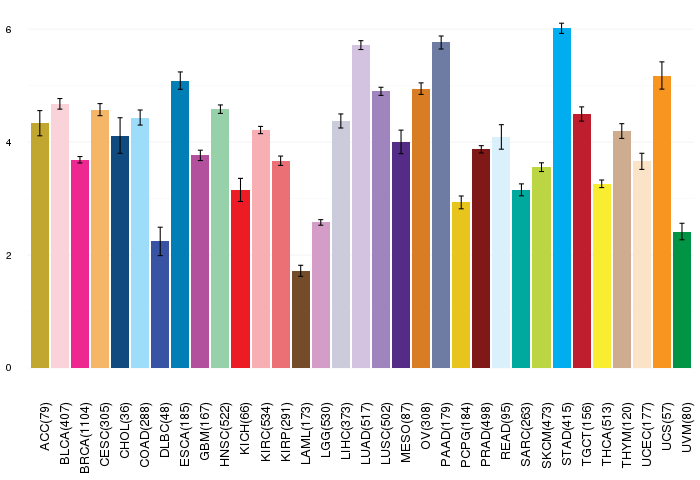 |
| Gene isoform expressions across 28 cancer types (X-axis: cancer type and Y-axis: log2(norm_counts+1)) (TCGA pan-cancer tcga_rsem_isoform_tpm, version 2016-09-01) |
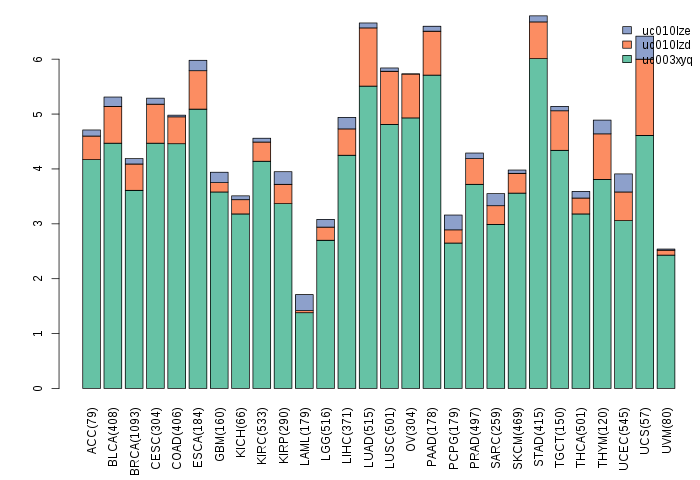 |
| Gene expressions across normal tissues of GTEx data (GTEx GTEx_Analysis_v6_RNA-seq_RNA-SeQCv1.1.8_gene_rpkm.gct) - Here, we shows the matched tissue types only among our 28 cancer types. |
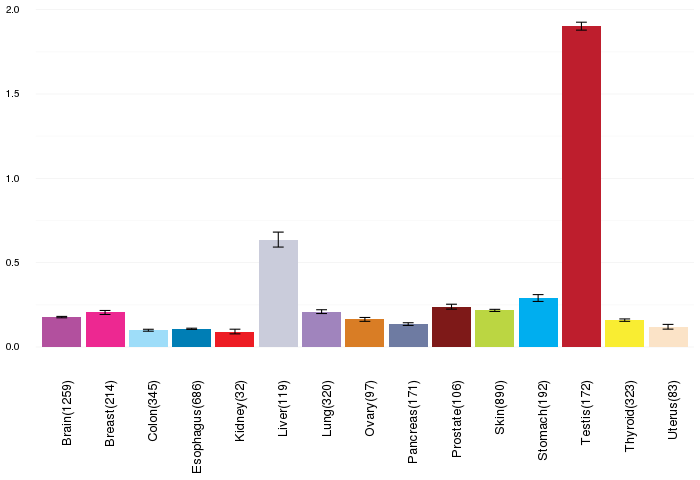 |
| Different expressions across 14 cancer types with more than 10 samples between matched tumors and normals (X-axis: cancer type and Y-axis: log2(norm_counts+1)) (TCGA IlluminaHiSeq_RNASeqV2, pan-cancer normalized log2(norm_counts+1) data, version 2016-08-16) |
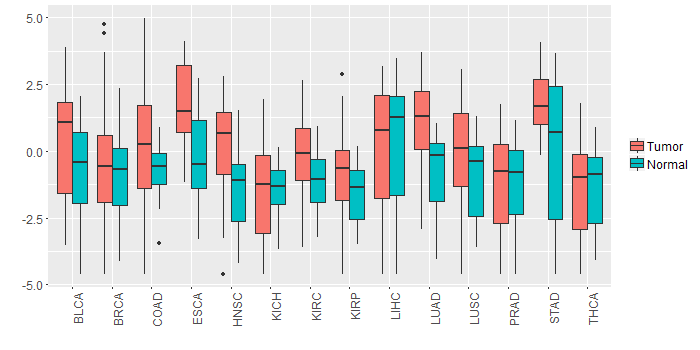 |
| - Significantly differentially expressed cancer types and information. (|Fold change|>1 and FDR<0.05) |
| Cancer type | Mean(exp) in tumor | Mean(exp) in matched normal | Log2FC | P-val. | FDR |
| HNSC | 0.147511391 | -1.456870004 | 1.604381395 | 1.39E-05 | 7.59E-05 |
| LUAD | 1.003524903 | -0.685780269 | 1.689305172 | 3.24E-08 | 1.36E-07 |
| STAD | 1.889718222 | -0.113672403 | 2.003390625 | 0.000927 | 0.004987615 |
| Top |
| TissGene-miRNA for XKR9 |
| Significantly anti-correlated miRNAs of TissGene across 28 cancer types (Gene-miRNA relations from TargetScanHuman Relsease 7.1, Conserved_Site_Context_Scores.txt.zip, 06.01.2016) (TCGA IlluminaHiSeq_miRNASeq, log2(RPM+1) data, version 2016-11-21) (TCGA IlluminaHiSeq_RNASeqV2, log2(normalized_count+1) data, version 2016-08-16) (Spearman’s Rank Correlation (p-value<0.05 and coefficient<-0.25)) |
| Cancer type | miRNA id | miRNA accession | P-val. | Coeff. | # samples |
| ACC | hsa-miR-494-3p | MIMAT0002816 | 0.0043 | -0.32 | 78 |
| ACC | hsa-miR-494-3p | MIMAT0002816 | 0.0043 | -0.32 | 78 |
| Top |
| TissGeneMut for XKR9 |
| TissGeneSNV for XKR9 |
| nsSNV counts per each loci. Different colors of circles represent different cancer types. Circle size denotes number of samples. (TCGA somatic mutation (SNPs and small INDELs) data, version 2016-04-25) * Click on the image to enlarge it in a new window. |
 |
 |
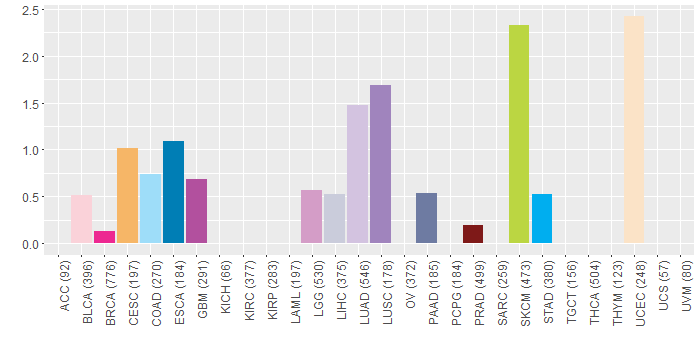
| Somatic nucleotide variants of TissGene across 28 cancer types (X-axis: cancer type and Y-axis: % of mutated samples) The numbers in parentheses are numbers of samples with mutation (nsSNVs). (TCGA somatic mutation (SNPs and small INDELs) data, version 2016-04-25) |
 |
| - nsSNVs sorted by frequency. |
| AAchange | Cancer type | # samples |
| p.L334F | SKCM | 2 |
| p.E355D | READ | 1 |
| p.A166V | GBM | 1 |
| p.L155V | BLCA | 1 |
| p.S215L | SKCM | 1 |
| p.F113L | COAD | 1 |
| p.Q6H | UCEC | 1 |
| p.S322I | UCEC | 1 |
| p.G300V | ESCA | 1 |
| p.W177R | LGG | 1 |
| p.M217V | UCEC | 1 |
| p.L190F | LUSC | 1 |
| p.G341E | SKCM | 1 |
| p.D130N | SKCM | 1 |
| p.L330P | STAD | 1 |
| p.V267F | HNSC | 1 |
| p.W62L | HNSC | 1 |
| p.V184L | SKCM | 1 |
| p.R294S | LUAD | 1 |
| p.M9I | HNSC | 1 |
| p.L362I | COAD | 1 |
| p.L222F | DLBC | 1 |
| p.A55S | LUAD | 1 |
| p.D21Y | GBM | 1 |
| p.G87* | UCEC | 1 |
| p.Y263C | LGG | 1 |
| p.L271F | LUSC | 1 |
| p.I278V | LIHC | 1 |
| p.E373K | SKCM | 1 |
| p.M133K | LGG | 1 |
| p.W62C | HNSC | 1 |
| p.W245* | STAD | 1 |
| p.C254X | LIHC | 1 |
| p.E116* | LUAD | 1 |
| p.V184A | PRAD | 1 |
| p.A95G | ESCA | 1 |
| p.F58I | LUAD | 1 |
| p.S132I | UCEC | 1 |
| p.G198R | LUAD | 1 |
| p.Q6H | READ | 1 |
| p.G332V | PAAD | 1 |
| p.G332V | UCEC | 1 |
| p.F47C | BRCA | 1 |
| p.P286S | SKCM | 1 |
| p.Q159H | PAAD | 1 |
| p.A160V | READ | 1 |
| p.G280V | LUSC | 1 |
| p.S61Y | CESC | 1 |
| p.W245X | STAD | 1 |
| p.S258I | PAAD | 1 |
| p.F162L | LUAD | 1 |
| p.C173S | LUAD | 1 |
| p.Q37R | BLCA | 1 |
| p.L362I | CESC | 1 |
| p.I244L | SKCM | 1 |
| p.G358E | SKCM | 1 |
| p.V293I | UCEC | 1 |
| p.E115G | SKCM | 1 |
| p.L299F | LUAD | 1 |
| Top |
| TissGeneCNV for XKR9 |
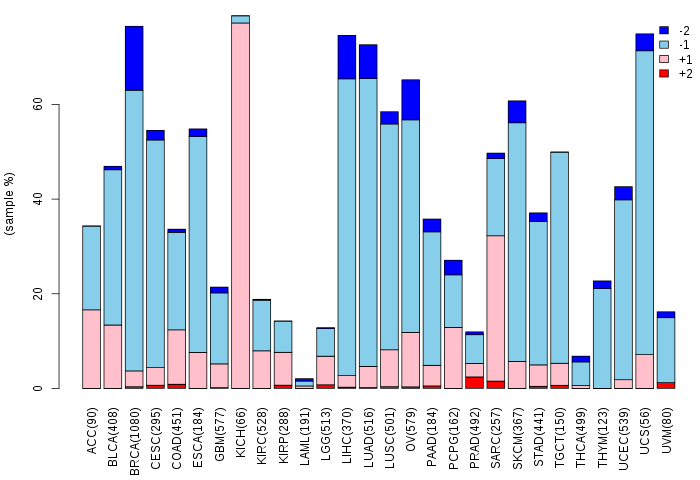
| Copy number variations of TissGene across 28 cancer types (X-axis: cancer type and Y-axis: % of CNV samples) (TCGA Gistic2_CopyNumber_Gistic2_all_data_by_genes, Gistic2 copy number data, version 2016-08-16) |
 |
| Top |
| TissGeneFusions for XKR9 |
| Fusion genes including TissGene (ChimerDB 3.0, 2016-12-01 and TCGA fusion Portal 2015-12-01) |
| Database | Src | Cancer type | Sample | Fusion gene | ORF | 5'-gene BP | 3'-gene BP |
| TCGAfusionPortal | PRADA | LUAD | TCGA-91-7771-01A | NCOA2-XKR9 | CDS-5UTR | Chr8:71033537 | Chr8:71587053 |
| Top |
| TissGeneNet for XKR9 |
| Co-expressed gene networks based on protein-protein interaction data (CePIN) (TCGA IlluminaHiSeq_RNASeqV2, pan-cancer normalized log2(norm_counts+1) data, version 2016-08-16) (PINA2 ppi data) |
| Top |
| TissGeneProg for XKR9 |
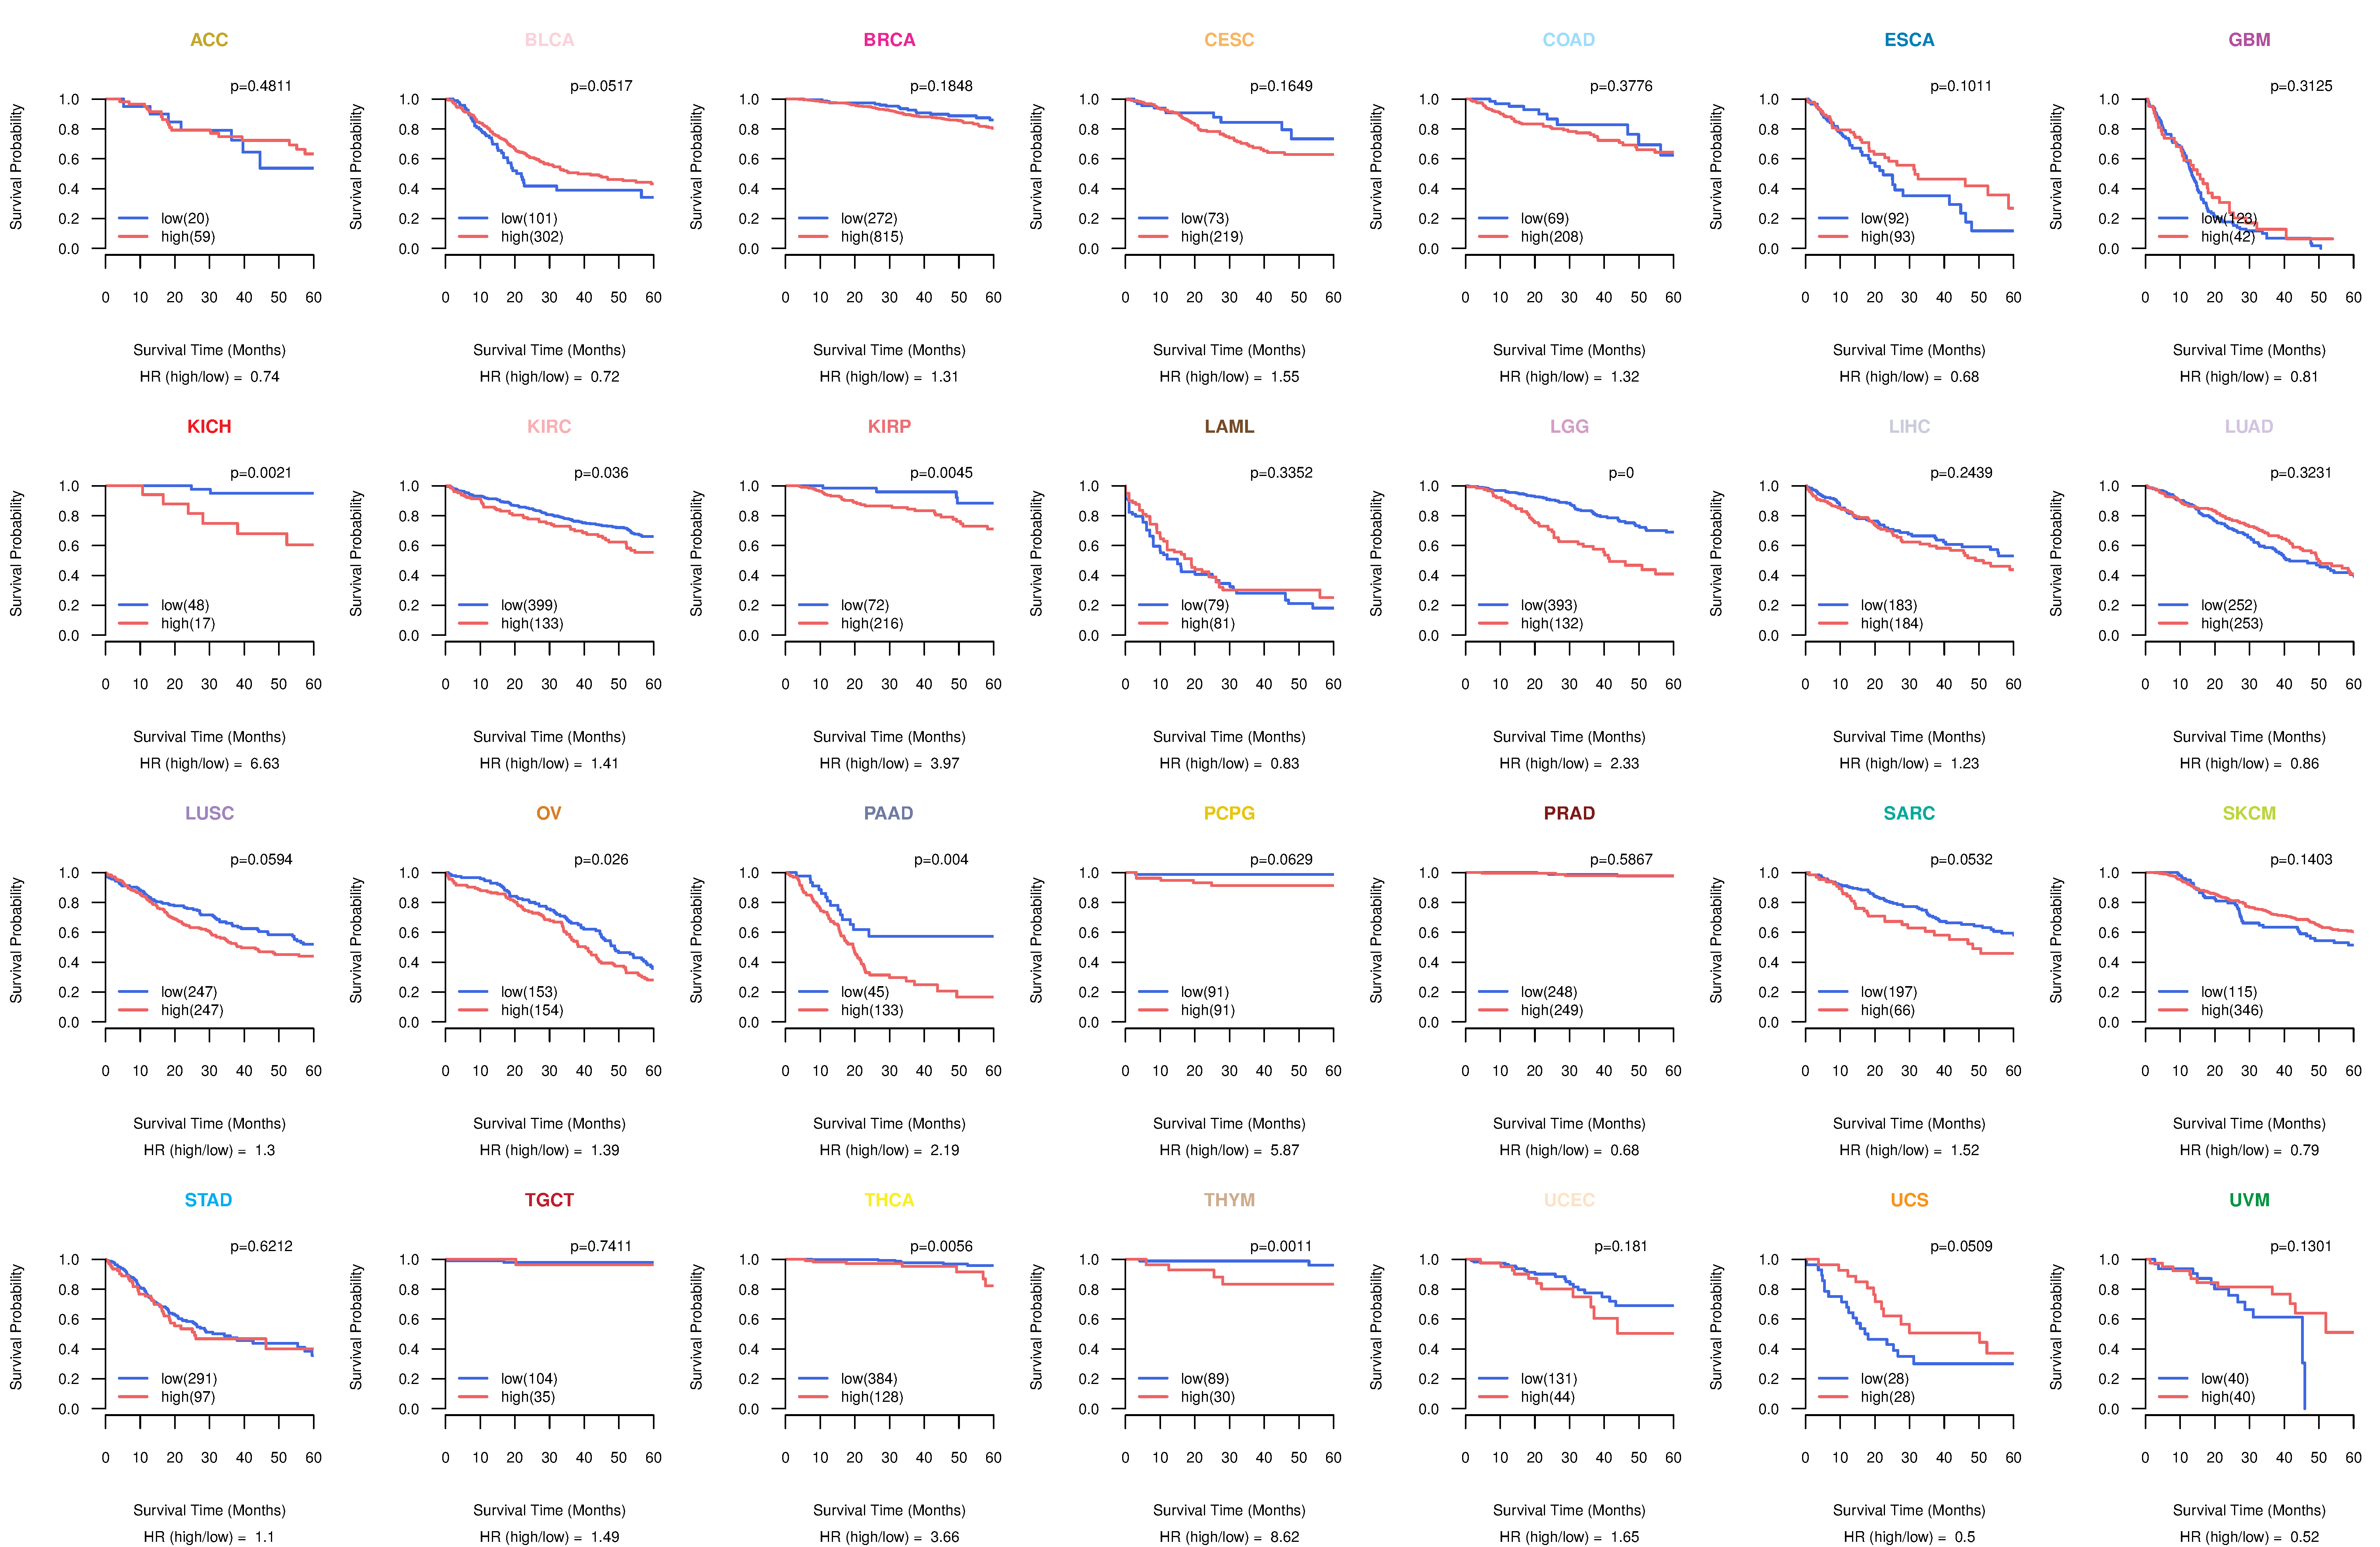
| Kaplan-Meier plots with logrank tests of overall survival (OS) using 28 cancer types (TCGA IlluminaHiSeq_RNASeqV2, pan-cancer normalized log2(norm_counts+1) data, version 2016-08-16) (TCGA clinicalMatrix, phenotype data, version 2016-04-27) * Click on the image to enlarge it in a new window. |
 |
| Kaplan-Meier plots with logrank test of relapse free survival (RFS) using 28 cancer types (TCGA IlluminaHiSeq_RNASeqV2, pan-cancer normalized log2(norm_counts+1) data, version 2016-08-16) (TCGA clinicalMatrix, phenotype data, version 2016-04-27) * Click on the image enlarge it in a new window. |
 |
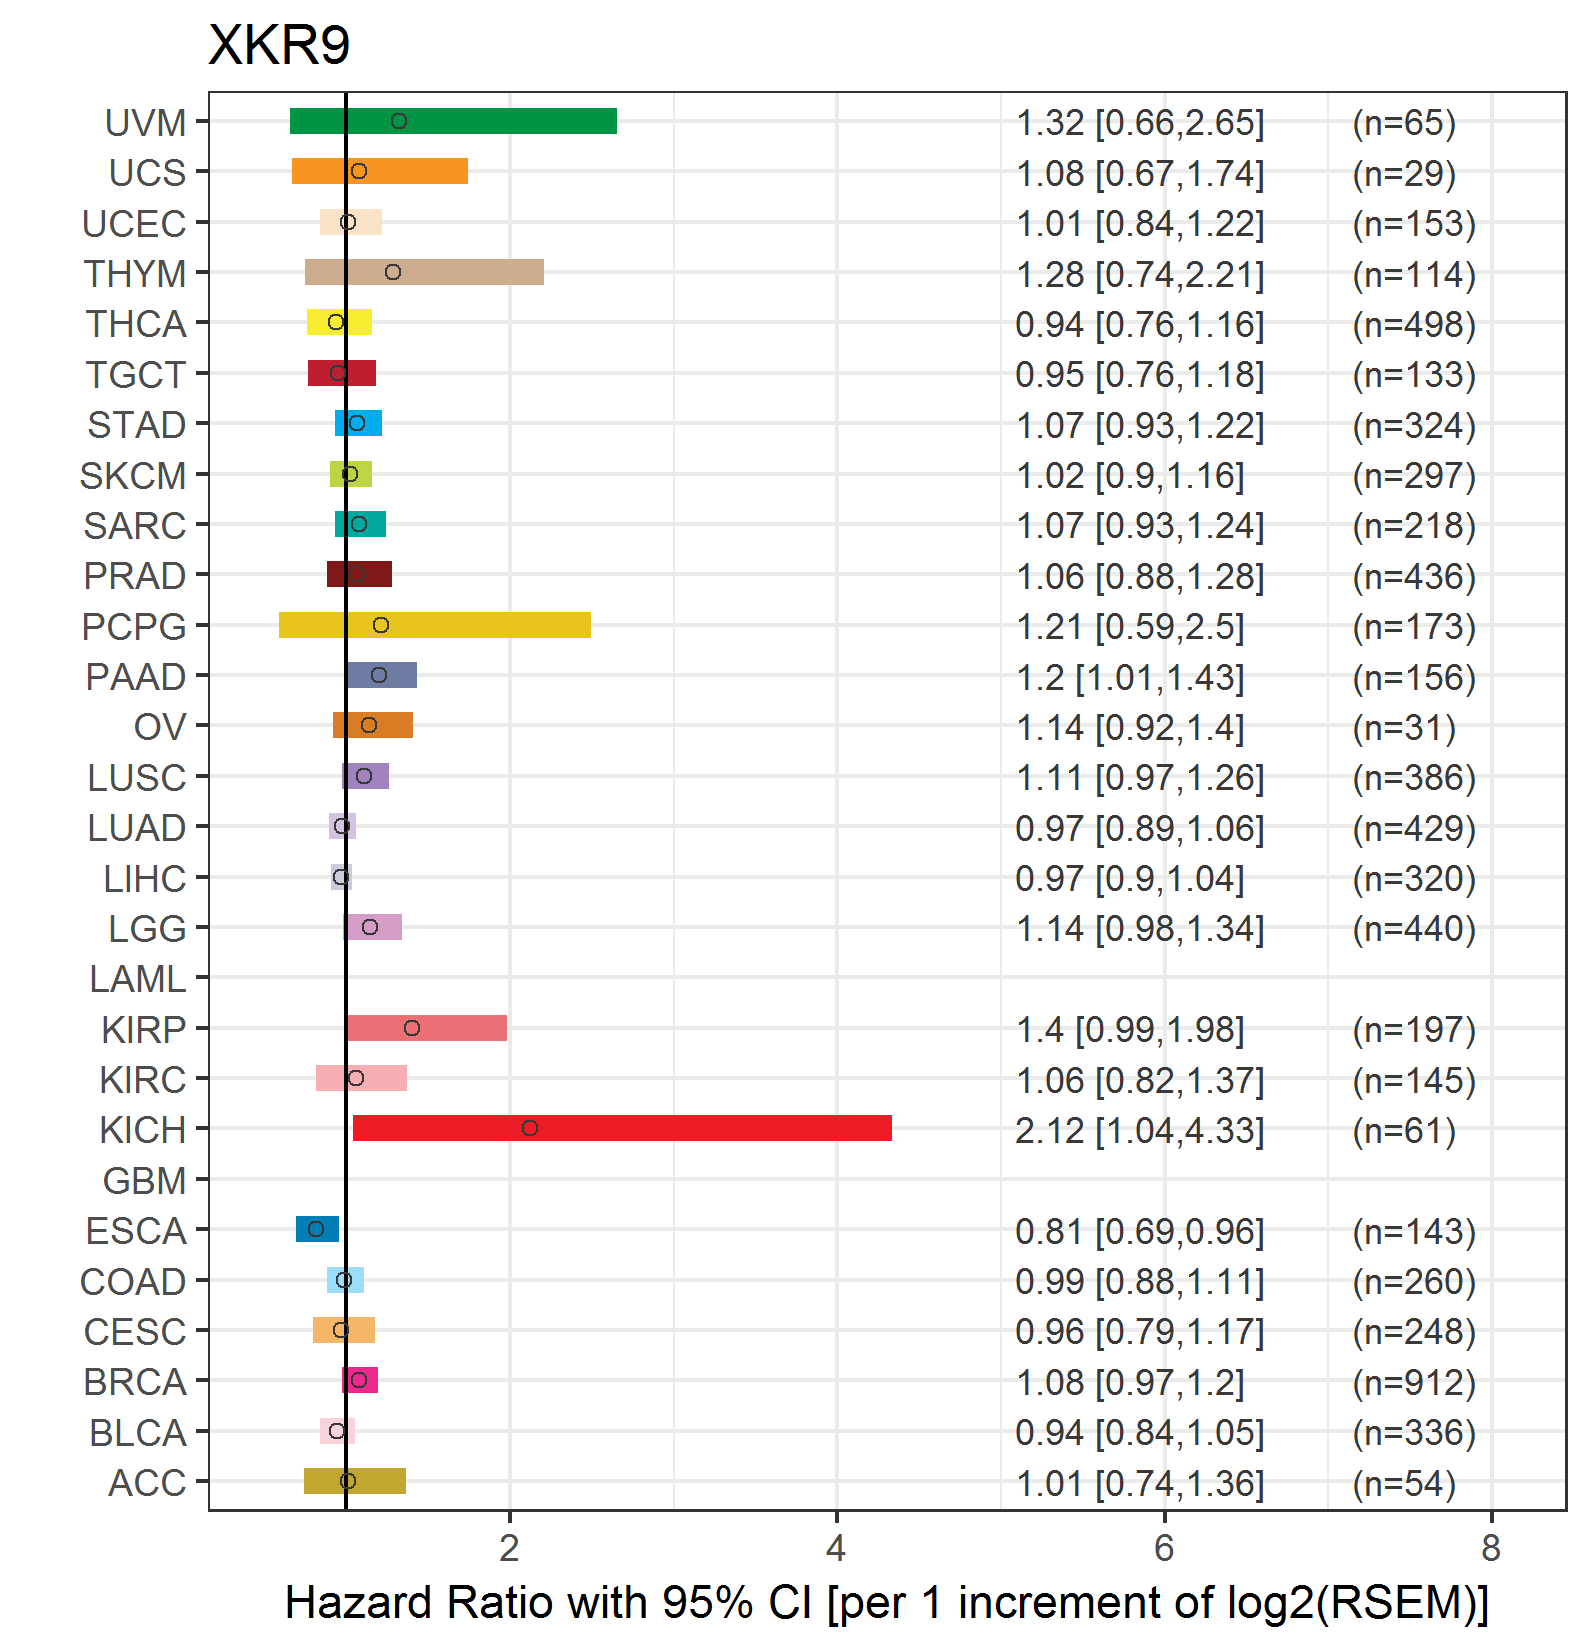
| Forest plot of Cox proportional hazard ratio (HR) and 95% CI of overall survival (OS) using 28 cancer types (TCGA IlluminaHiSeq_RNASeqV2, pan-cancer normalized log2(norm_counts+1) data, version 2016-08-16) (TCGA clinicalMatrix, phenotype data, version 2016-04-27) * Click on the image enlarge it in a new window. |
 |
| Forest plot of Cox proportional hazard ratio (HR) and 95% CI of relapse free survival (RFS) using 28 cancer types (TCGA IlluminaHiSeq_RNASeqV2, pan-cancer normalized log2(norm_counts+1) data, version 2016-08-16) (TCGA clinicalMatrix, phenotype data, version 2016-04-27) * Click on the image enlarge it in a new window. |
 |
| Top |
| TissGeneClin for XKR9 |
| TissGeneDrug for XKR9 |
| Drug information targeting TissGene (DrugBank Version 5.0.6, 2017-04-01) |
| DrugBank ID | Drug name | Drug activity | Drug type | Drug status |
| Top |
| TissGeneDisease for XKR9 |
| Disease information associated with TissGene (DisGeNet, 2016-06-01) |
| Disease ID | Disease name | # pubmeds | Source |
|
Copyright 2016-Present - The University of Texas Health Science Center at Houston (UTHealth) Web File Viewing | How to Report, Fraud, Waste and Abuse | State of Texas | Statewide Search | Texas Homeland Security | Site Policies |