 |
| |
| |
| |
| |
| |
| |
|

| TissGeneSummary for LCN1 |
 Gene summary Gene summary |
| Basic gene information | Gene symbol | LCN1 |
| Gene name | lipocalin 1 | |
| Synonyms | PMFA|TLC|TP|VEGP | |
| Cytomap | UCSC genome browser: 9q34 | |
| Type of gene | protein-coding | |
| RefGenes | NM_001252617.1, NM_001252618.1,NM_001252619.1,NM_002297.3, | |
| Description | VEG proteinVon Ebner gland proteinlipocalin 1 (tear prealbumin)lipocalin-1protein migrating faster than albumintear prealbumin | |
| Modification date | 20141207 | |
| dbXrefs | MIM : 151675 | |
| HGNC : HGNC | ||
| Ensembl : ENSG00000160349 | ||
| HPRD : 01059 | ||
| Vega : OTTHUMG00000020908 | ||
| Protein | UniProt: go to UniProt's Cross Reference DB Table | |
| Expression | CleanEX: HS_LCN1 | |
| BioGPS: 3933 | ||
| Pathway | NCI Pathway Interaction Database: LCN1 | |
| KEGG: LCN1 | ||
| REACTOME: LCN1 | ||
| Pathway Commons: LCN1 | ||
| Context | iHOP: LCN1 | |
| ligand binding site mutation search in PubMed: LCN1 | ||
| UCL Cancer Institute: LCN1 | ||
| Assigned class in TissGDB* | C | |
| Included tissue-specific gene expression resources | TiGER,GTEx | |
| Specific-tissues in normal samples (assigned by TissGDB using HPA, TiGER, and GTEx) | EsophagusEye | |
| Cancer types related to the specific-tissues in cancer samples (assigned by TissGDB using TCGA) | ESCAUVM | |
| Reference showing the relevant tissue of LCN1 | ||
| Description by TissGene annotations | Fused withTSGene | |
| * Class A consists of genes with literature evidence and is part of the cTissGenes. Class B consists of only cTissGenes without additional evidence. The remaining genes belong to Class C. |
| Gene ontology having evidence of Inferred from Direct Assay (IDA) from Entrez |
| GO ID | GO term | PubMed ID |
| Top |
| TissGeneExp for LCN1 |
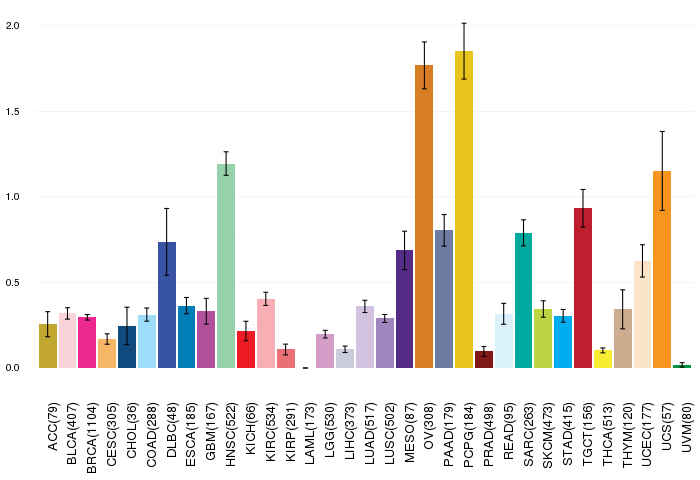
| Gene expressions across 28 cancer types (X-axis: cancer type and Y-axis: log2(norm_counts+1)) (TCGA IlluminaHiSeq_RNASeqV2, pan-cancer normalized log2(norm_counts+1) data, version 2016-08-16) |
 |
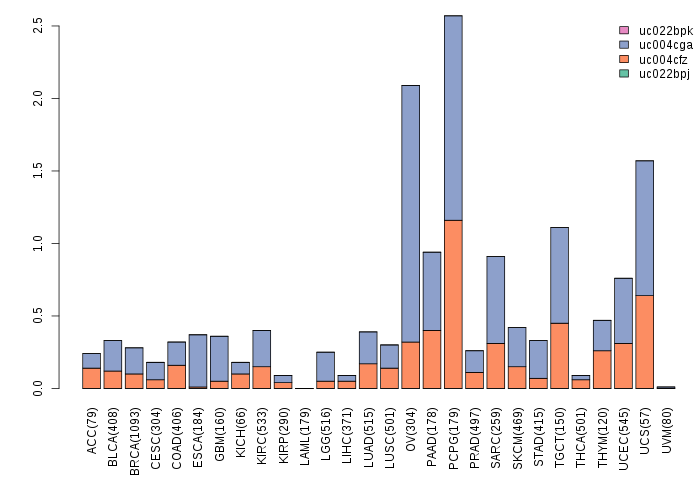
| Gene isoform expressions across 28 cancer types (X-axis: cancer type and Y-axis: log2(norm_counts+1)) (TCGA pan-cancer tcga_rsem_isoform_tpm, version 2016-09-01) |
 |
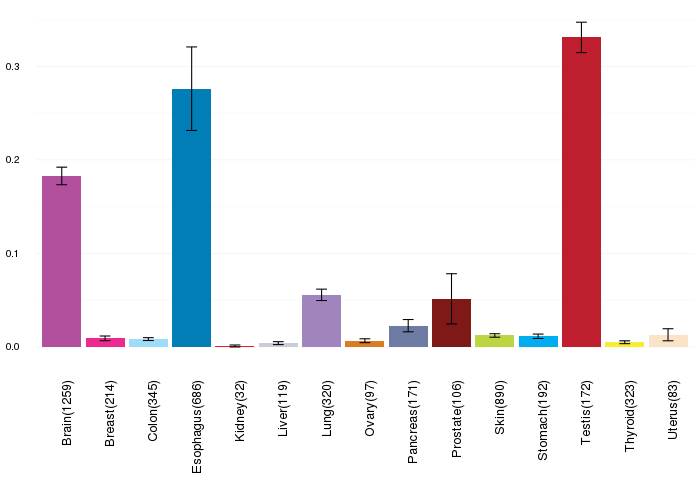
| Gene expressions across normal tissues of GTEx data (GTEx GTEx_Analysis_v6_RNA-seq_RNA-SeQCv1.1.8_gene_rpkm.gct) - Here, we shows the matched tissue types only among our 28 cancer types. |
 |
| Different expressions across 14 cancer types with more than 10 samples between matched tumors and normals (X-axis: cancer type and Y-axis: log2(norm_counts+1)) (TCGA IlluminaHiSeq_RNASeqV2, pan-cancer normalized log2(norm_counts+1) data, version 2016-08-16) |
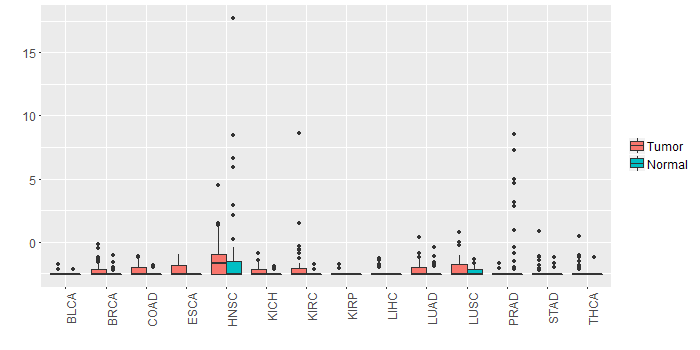 |
| - Significantly differentially expressed cancer types and information. (|Fold change|>1 and FDR<0.05) |
| Cancer type | Mean(exp) in tumor | Mean(exp) in matched normal | Log2FC | P-val. | FDR |
| PRAD | -2.489926932 | -1.452853855 | -1.037073077 | 0.00608 | 0.015483273 |
| Top |
| TissGene-miRNA for LCN1 |
| Significantly anti-correlated miRNAs of TissGene across 28 cancer types (Gene-miRNA relations from TargetScanHuman Relsease 7.1, Conserved_Site_Context_Scores.txt.zip, 06.01.2016) (TCGA IlluminaHiSeq_miRNASeq, log2(RPM+1) data, version 2016-11-21) (TCGA IlluminaHiSeq_RNASeqV2, log2(normalized_count+1) data, version 2016-08-16) (Spearman’s Rank Correlation (p-value<0.05 and coefficient<-0.25)) |
| Cancer type | miRNA id | miRNA accession | P-val. | Coeff. | # samples |
| Top |
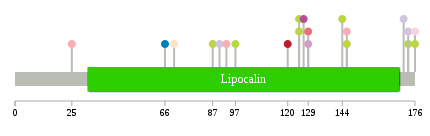
| TissGeneMut for LCN1 |
| TissGeneSNV for LCN1 |
| nsSNV counts per each loci. Different colors of circles represent different cancer types. Circle size denotes number of samples. (TCGA somatic mutation (SNPs and small INDELs) data, version 2016-04-25) * Click on the image to enlarge it in a new window. |
 |
 |
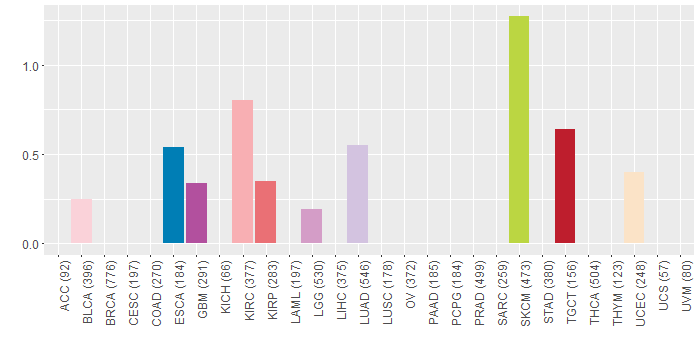
| Somatic nucleotide variants of TissGene across 28 cancer types (X-axis: cancer type and Y-axis: % of mutated samples) The numbers in parentheses are numbers of samples with mutation (nsSNVs). (TCGA somatic mutation (SNPs and small INDELs) data, version 2016-04-25) |
 |
| - nsSNVs sorted by frequency. |
| AAchange | Cancer type | # samples |
| p.R129Q | KIRP | 1 |
| p.E146G | KIRC | 1 |
| p.R129Q | LGG | 1 |
| p.D176N | SKCM | 1 |
| p.G77A | HNSC | 1 |
| p.G93R | KIRC | 1 |
| p.P173T | LUAD | 1 |
| p.P127S | GBM | 1 |
| p.N66Y | ESCA | 1 |
| p.E120D | TGCT | 1 |
| p.G173E | SKCM | 1 |
| p.G125E | SKCM | 1 |
| p.K70E | UCEC | 1 |
| p.E87K | SKCM | 1 |
| p.D176N | BLCA | 1 |
| p.E146K | SKCM | 1 |
| p.G93E | HNSC | 1 |
| p.D90E | LUAD | 1 |
| p.C171R | LUAD | 1 |
| p.W144X | SKCM | 1 |
| p.D25G | KIRC | 1 |
| p.G125R | SKCM | 1 |
| p.A97T | SKCM | 1 |
| Top |
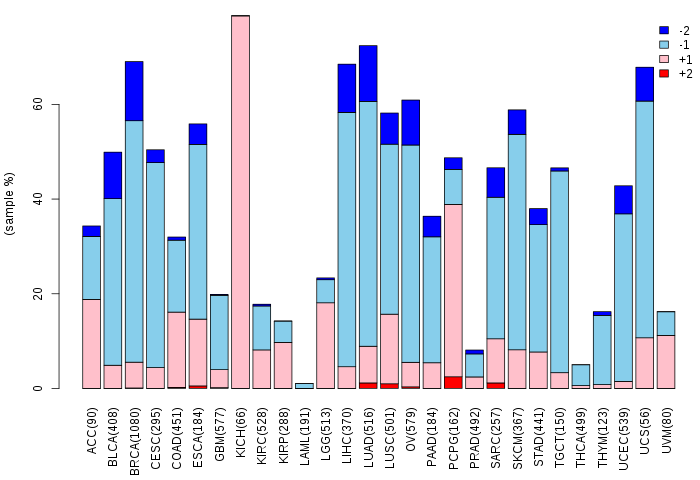
| TissGeneCNV for LCN1 |
| Copy number variations of TissGene across 28 cancer types (X-axis: cancer type and Y-axis: % of CNV samples) (TCGA Gistic2_CopyNumber_Gistic2_all_data_by_genes, Gistic2 copy number data, version 2016-08-16) |
 |
| Top |
| TissGeneFusions for LCN1 |
| Fusion genes including TissGene (ChimerDB 3.0, 2016-12-01 and TCGA fusion Portal 2015-12-01) |
| Database | Src | Cancer type | Sample | Fusion gene | ORF | 5'-gene BP | 3'-gene BP |
| Chimerdb3.0 | ChiTaRs | NA | CD723346 | LCN1-HECA | chr9:138416738 | chr6:139501807 | |
| Chimerdb3.0 | ChiTaRs | NA | CK429413 | LCN1-LYZ | chr9:138414015 | chr12:69746005 | |
| Chimerdb3.0 | ChiTaRs | NA | CK430284 | LCN1-LCN1 | chr9:138418082 | chr9:138417142 |
| Top |
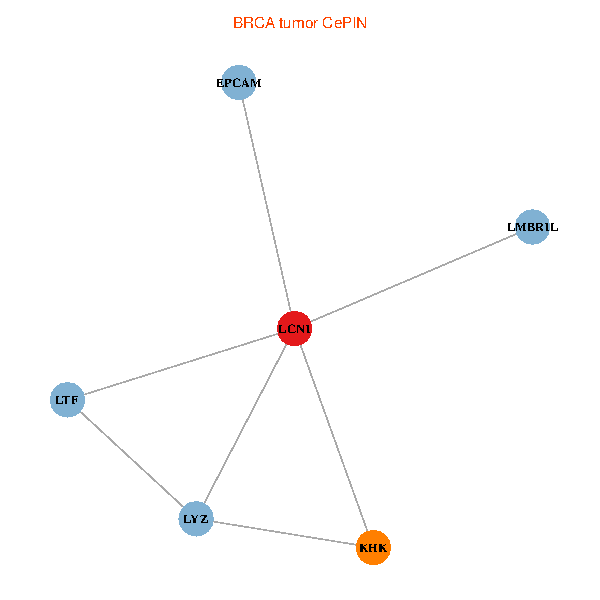
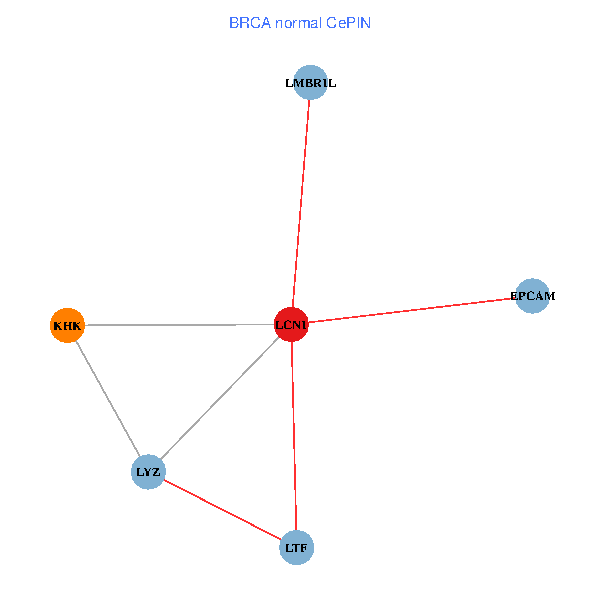
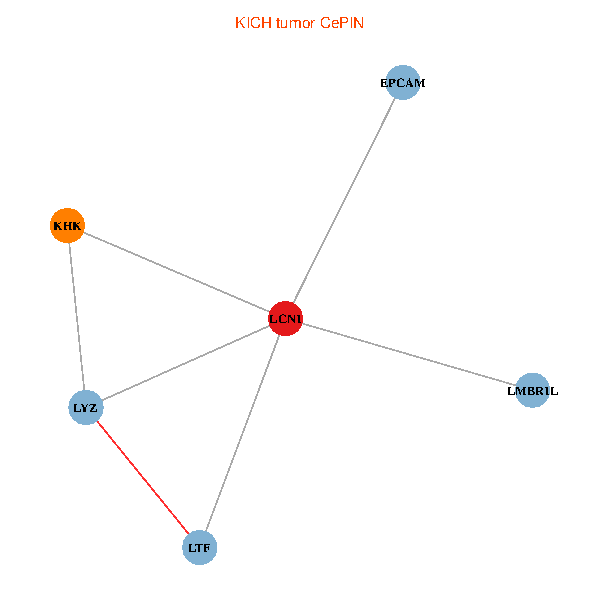
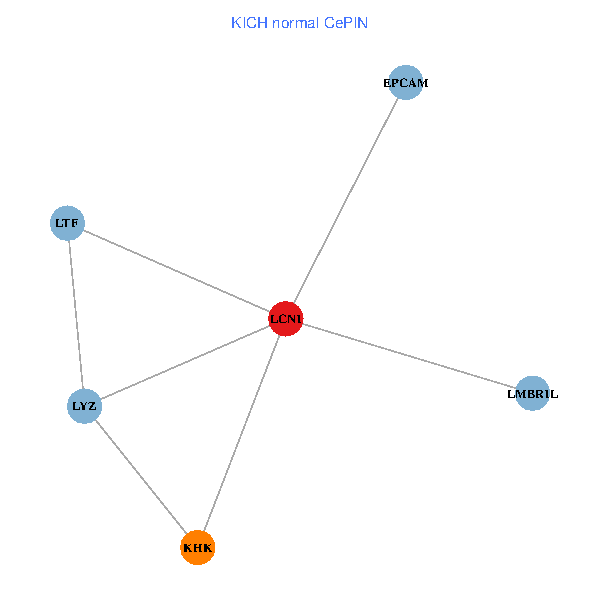
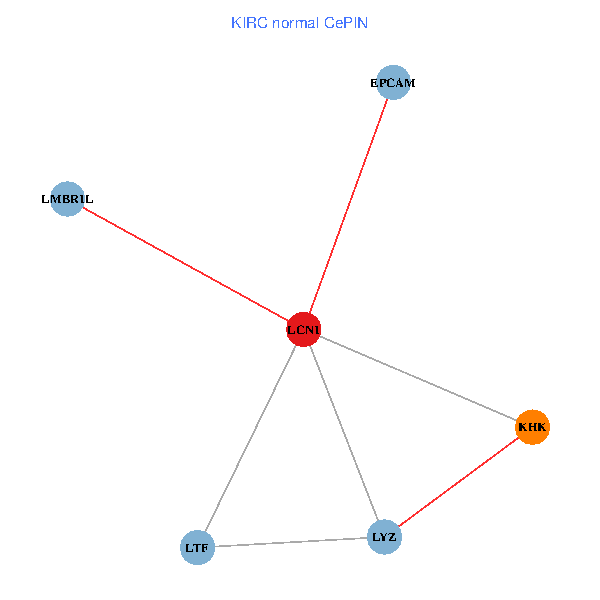
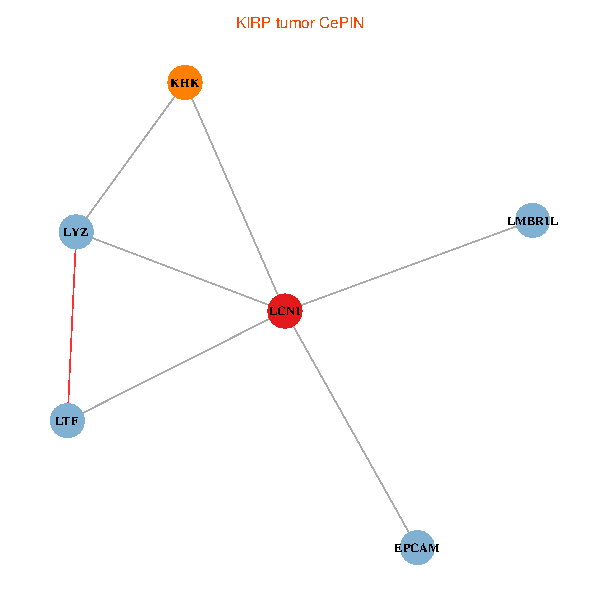
| TissGeneNet for LCN1 |
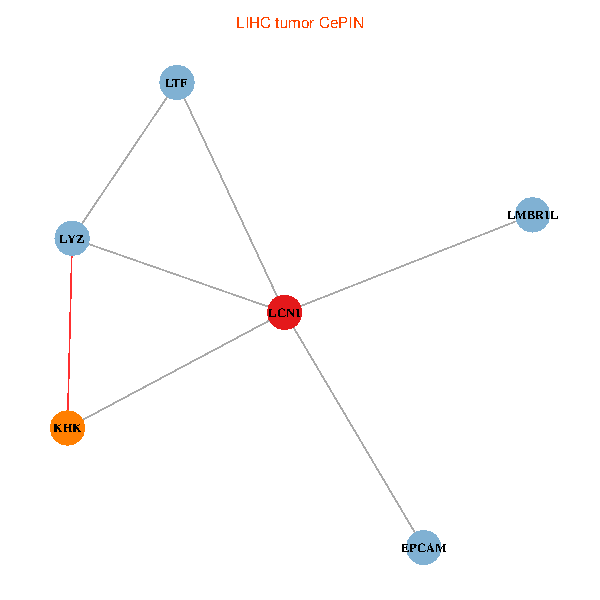
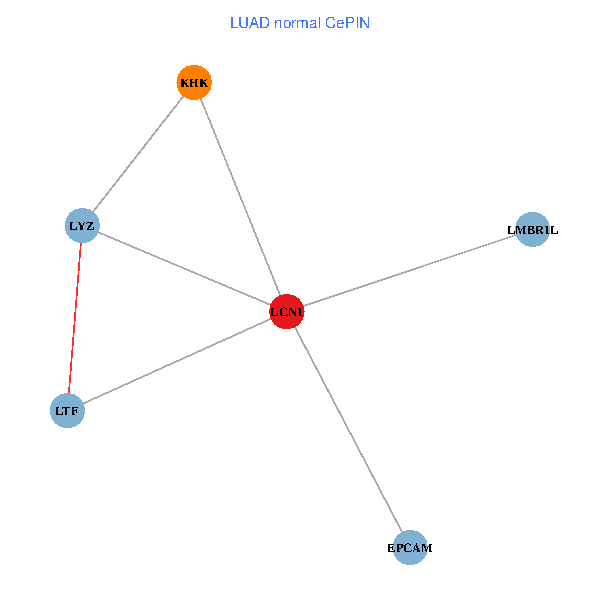
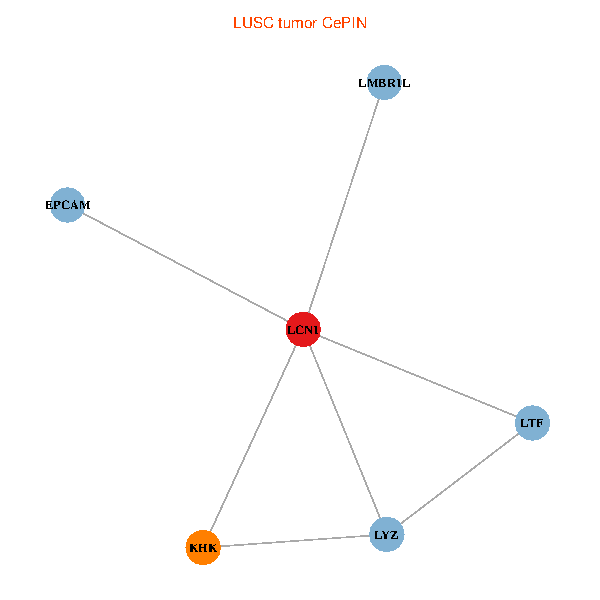
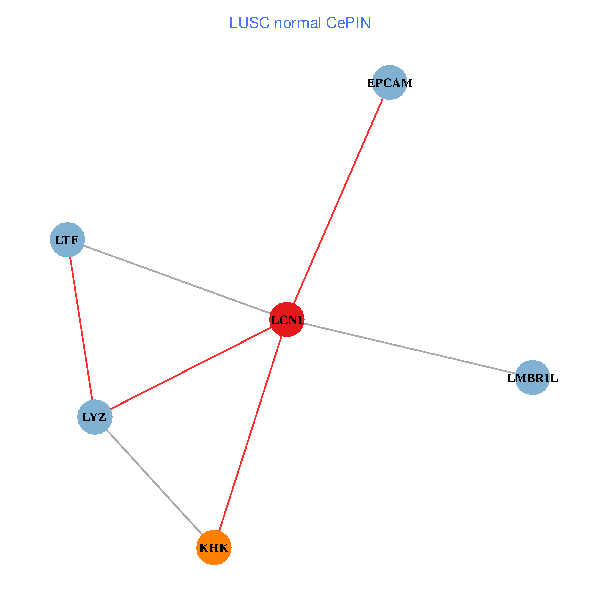
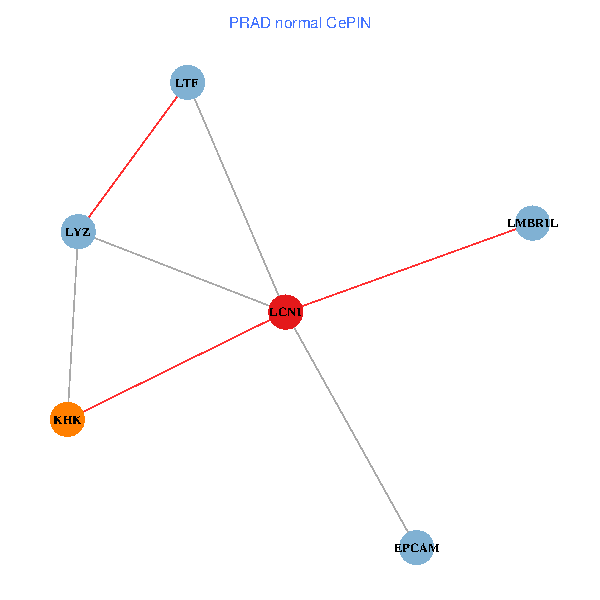
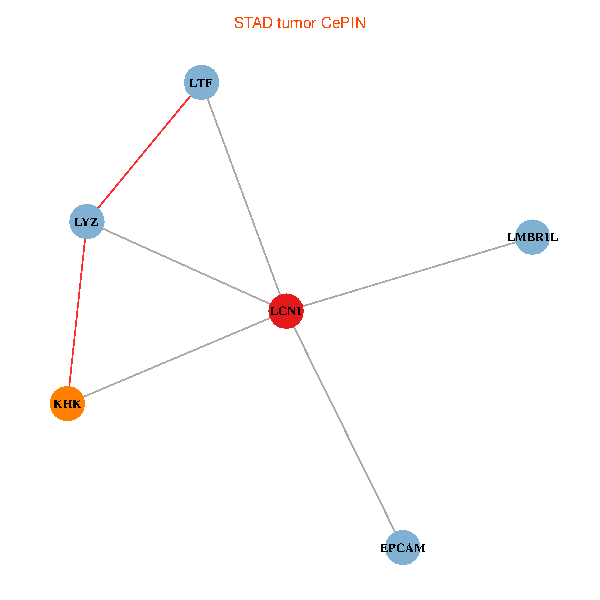
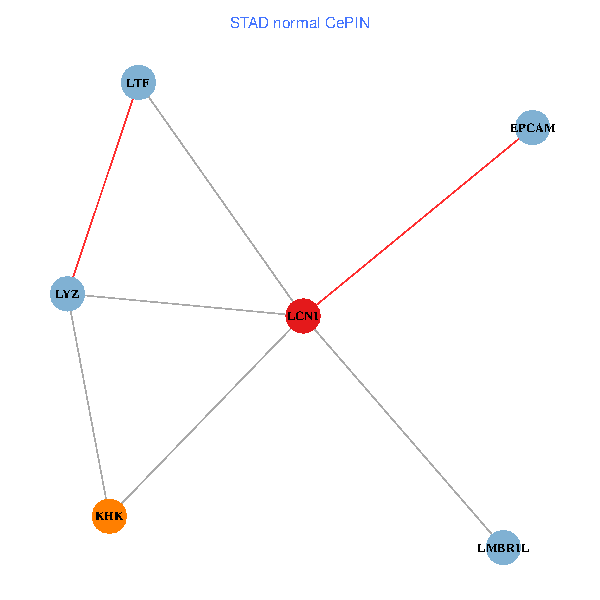
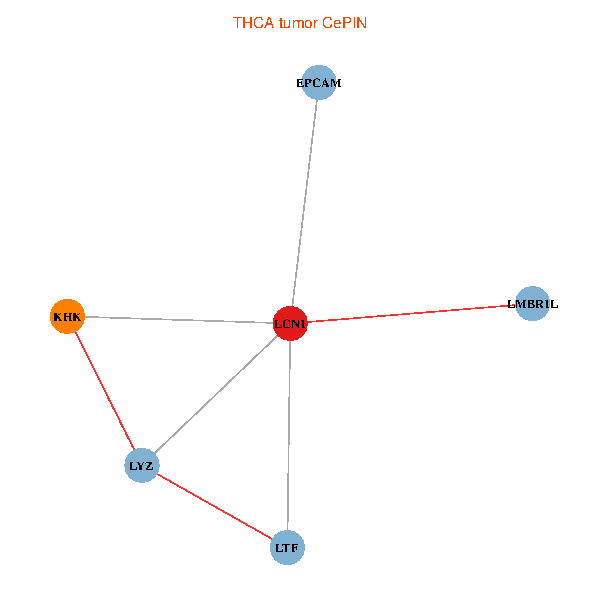
| Co-expressed gene networks based on protein-protein interaction data (CePIN) (TCGA IlluminaHiSeq_RNASeqV2, pan-cancer normalized log2(norm_counts+1) data, version 2016-08-16) (PINA2 ppi data) |
| BRCA (tumor) | BRCA (normal) |
| LCN1, LTF, LYZ, KHK, LMBR1L, EPCAM (tumor) | LCN1, LTF, LYZ, KHK, LMBR1L, EPCAM (normal) |
 |  |
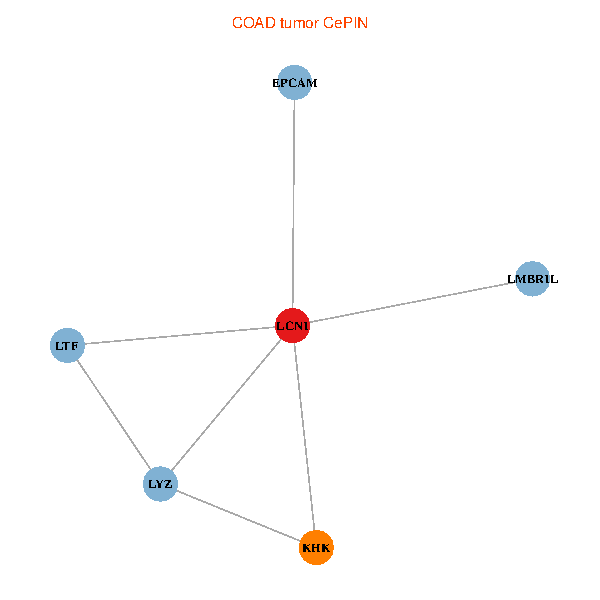
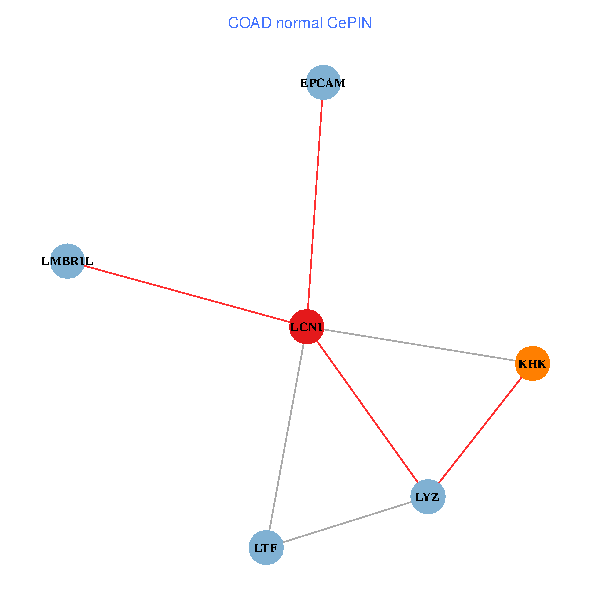
| COAD (tumor) | COAD (normal) |
| LCN1, LTF, LYZ, KHK, LMBR1L, EPCAM (tumor) | LCN1, LTF, LYZ, KHK, LMBR1L, EPCAM (normal) |
 |  |
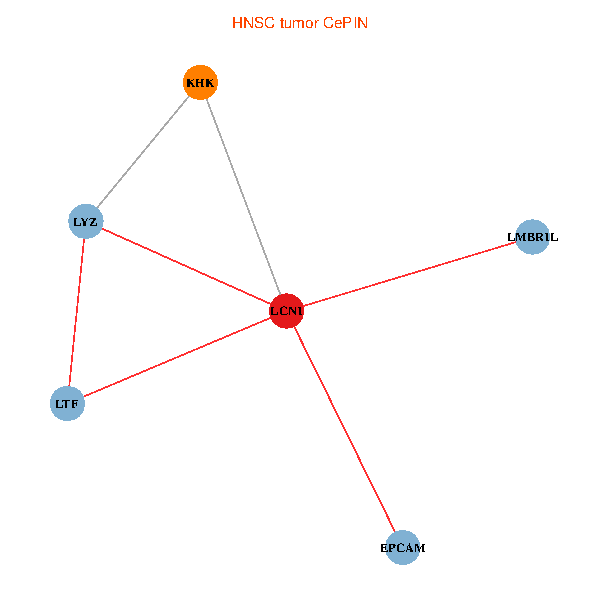
| HNSC (tumor) | HNSC (normal) |
| LCN1, LTF, LYZ, KHK, LMBR1L, EPCAM (tumor) | LCN1, LTF, LYZ, KHK, LMBR1L, EPCAM (normal) |
 |  |
| KICH (tumor) | KICH (normal) |
| LCN1, LTF, LYZ, KHK, LMBR1L, EPCAM (tumor) | LCN1, LTF, LYZ, KHK, LMBR1L, EPCAM (normal) |
 |  |
| KIRC (tumor) | KIRC (normal) |
| LCN1, LTF, LYZ, KHK, LMBR1L, EPCAM (tumor) | LCN1, LTF, LYZ, KHK, LMBR1L, EPCAM (normal) |
 |  |
| KIRP (tumor) | KIRP (normal) |
| LCN1, LTF, LYZ, KHK, LMBR1L, EPCAM (tumor) | LCN1, LTF, LYZ, KHK, LMBR1L, EPCAM (normal) |
 |  |
| LIHC (tumor) | LIHC (normal) |
| LCN1, LTF, LYZ, KHK, LMBR1L, EPCAM (tumor) | LCN1, LTF, LYZ, KHK, LMBR1L, EPCAM (normal) |
 |  |
| LUAD (tumor) | LUAD (normal) |
| LCN1, LTF, LYZ, KHK, LMBR1L, EPCAM (tumor) | LCN1, LTF, LYZ, KHK, LMBR1L, EPCAM (normal) |
 |  |
| LUSC (tumor) | LUSC (normal) |
| LCN1, LTF, LYZ, KHK, LMBR1L, EPCAM (tumor) | LCN1, LTF, LYZ, KHK, LMBR1L, EPCAM (normal) |
 |  |
| PRAD (tumor) | PRAD (normal) |
| LCN1, LTF, LYZ, KHK, LMBR1L, EPCAM (tumor) | LCN1, LTF, LYZ, KHK, LMBR1L, EPCAM (normal) |
 |  |
| STAD (tumor) | STAD (normal) |
| LCN1, LTF, LYZ, KHK, LMBR1L, EPCAM (tumor) | LCN1, LTF, LYZ, KHK, LMBR1L, EPCAM (normal) |
 |  |
| THCA (tumor) | THCA (normal) |
| LCN1, LTF, LYZ, KHK, LMBR1L, EPCAM (tumor) | LCN1, LTF, LYZ, KHK, LMBR1L, EPCAM (normal) |
 |  |
| Top |
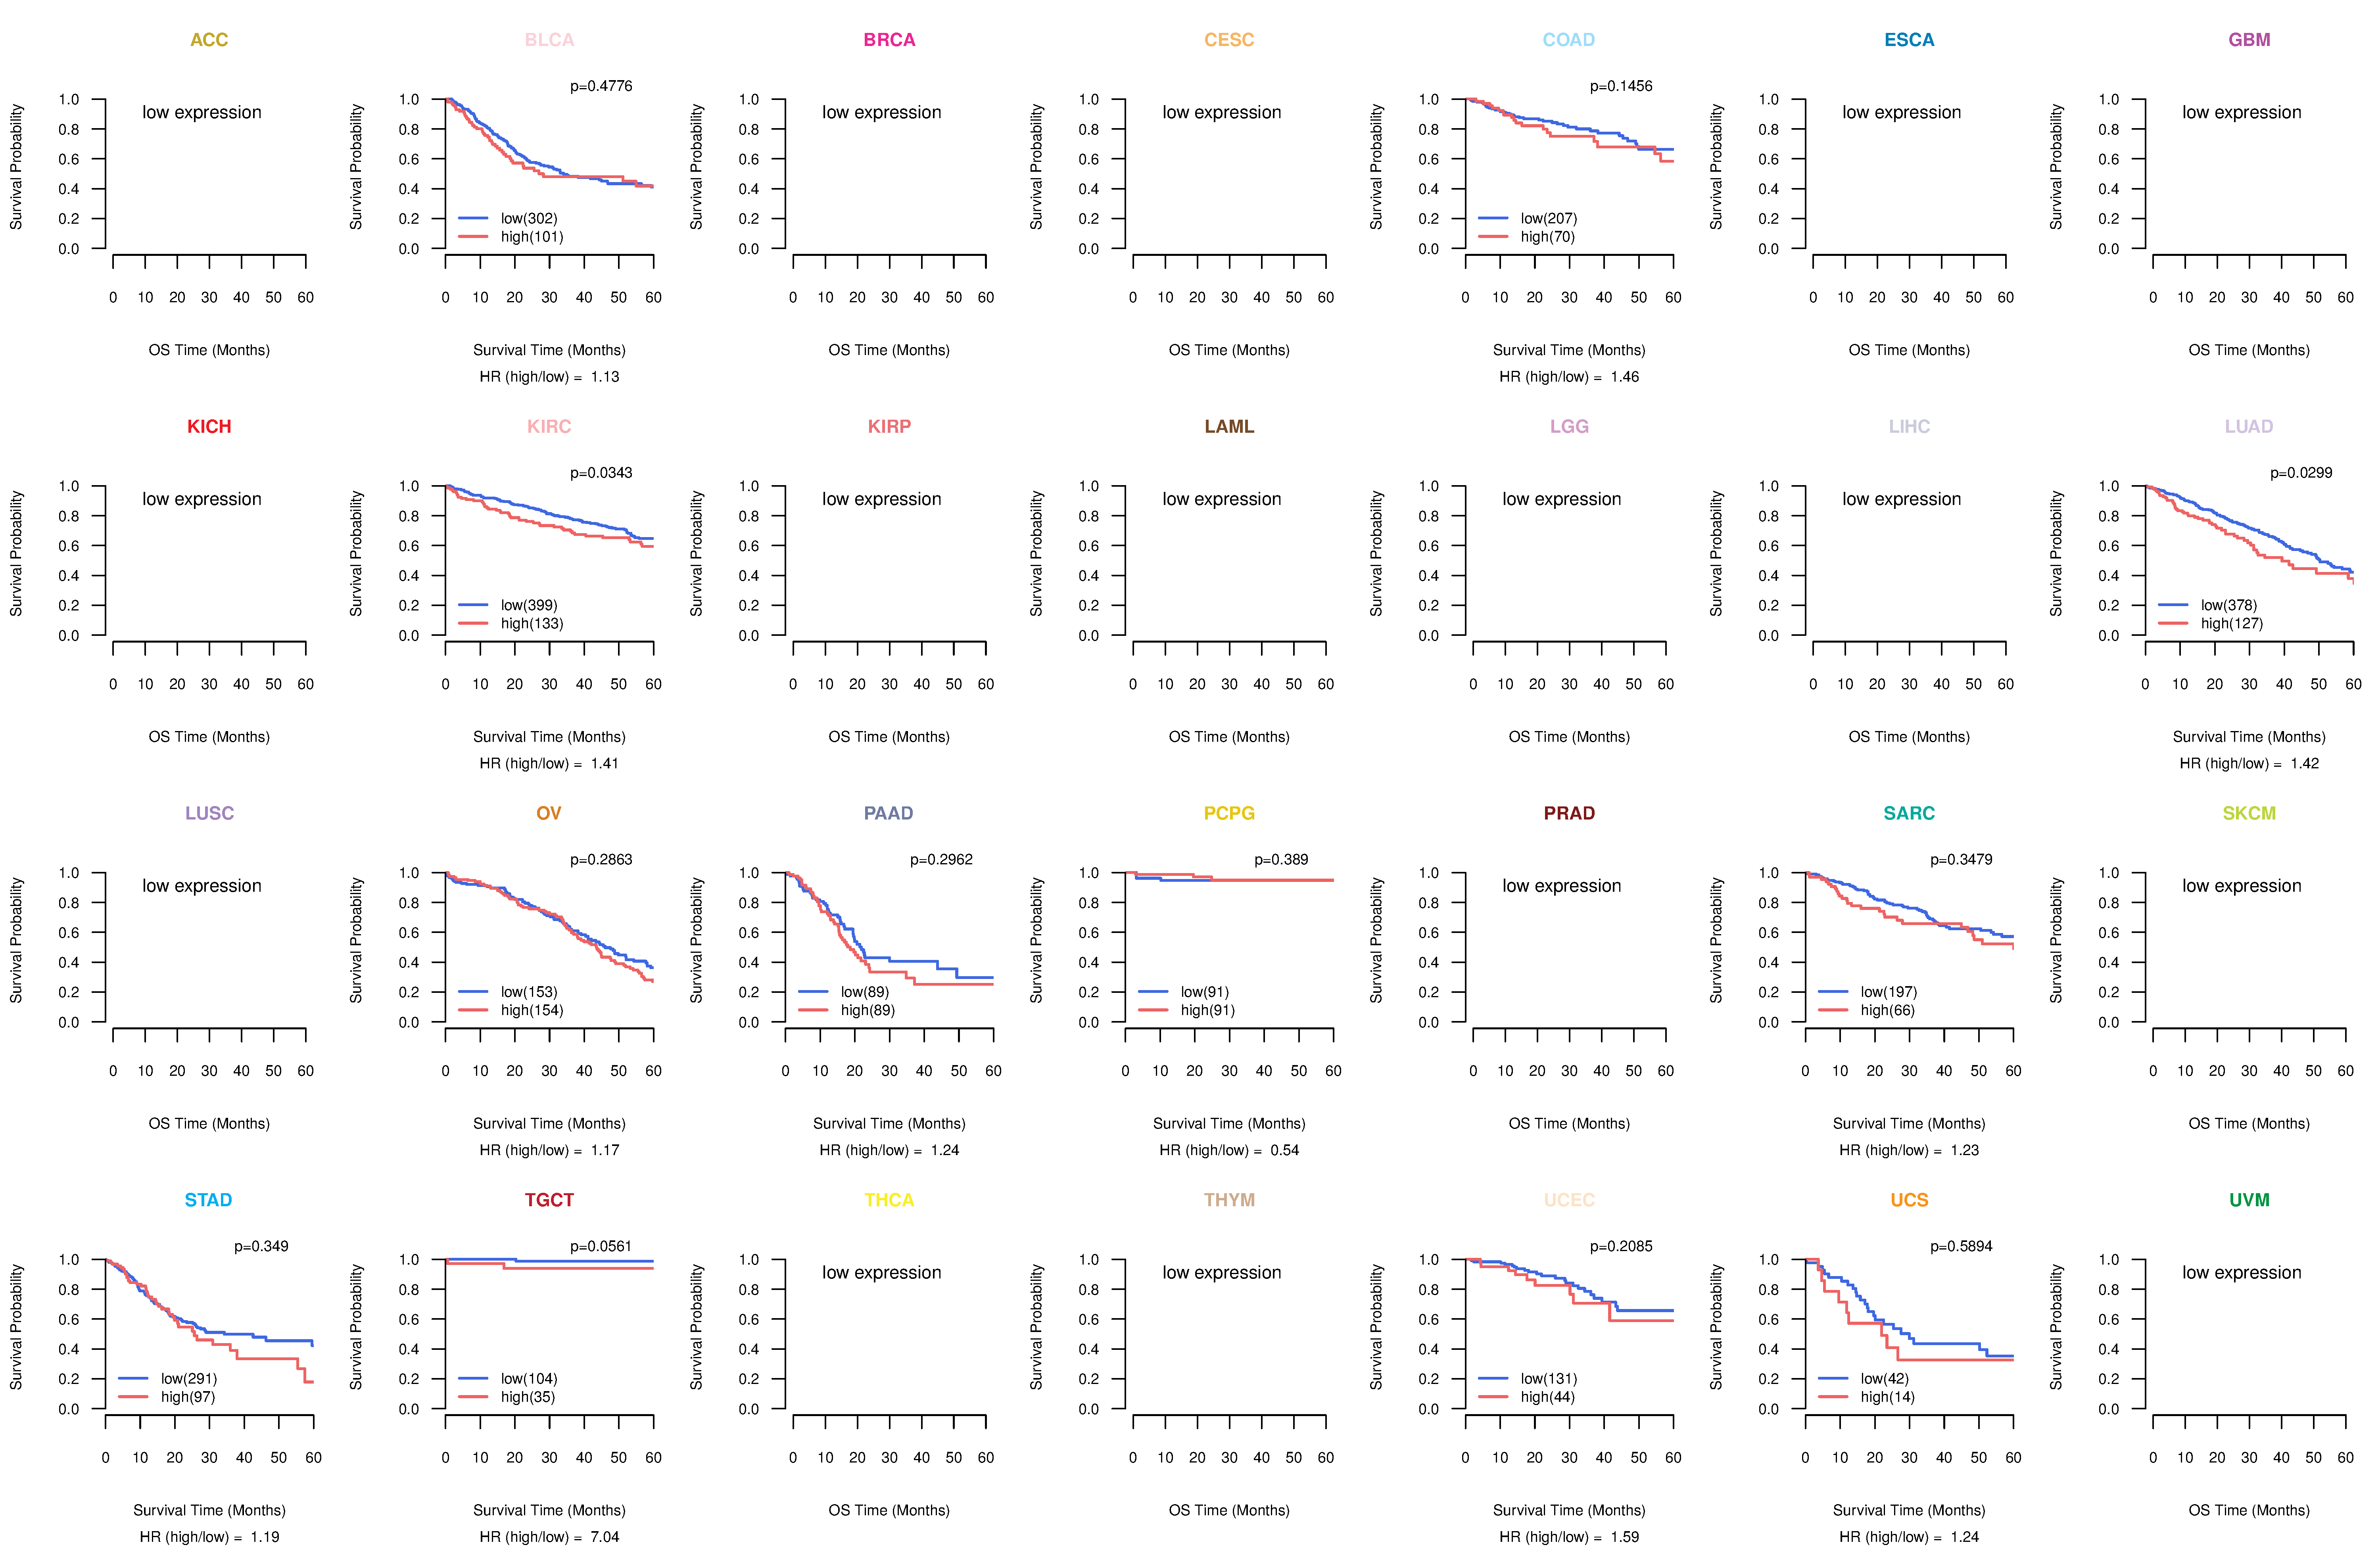
| TissGeneProg for LCN1 |
| Kaplan-Meier plots with logrank tests of overall survival (OS) using 28 cancer types (TCGA IlluminaHiSeq_RNASeqV2, pan-cancer normalized log2(norm_counts+1) data, version 2016-08-16) (TCGA clinicalMatrix, phenotype data, version 2016-04-27) * Click on the image to enlarge it in a new window. |
 |
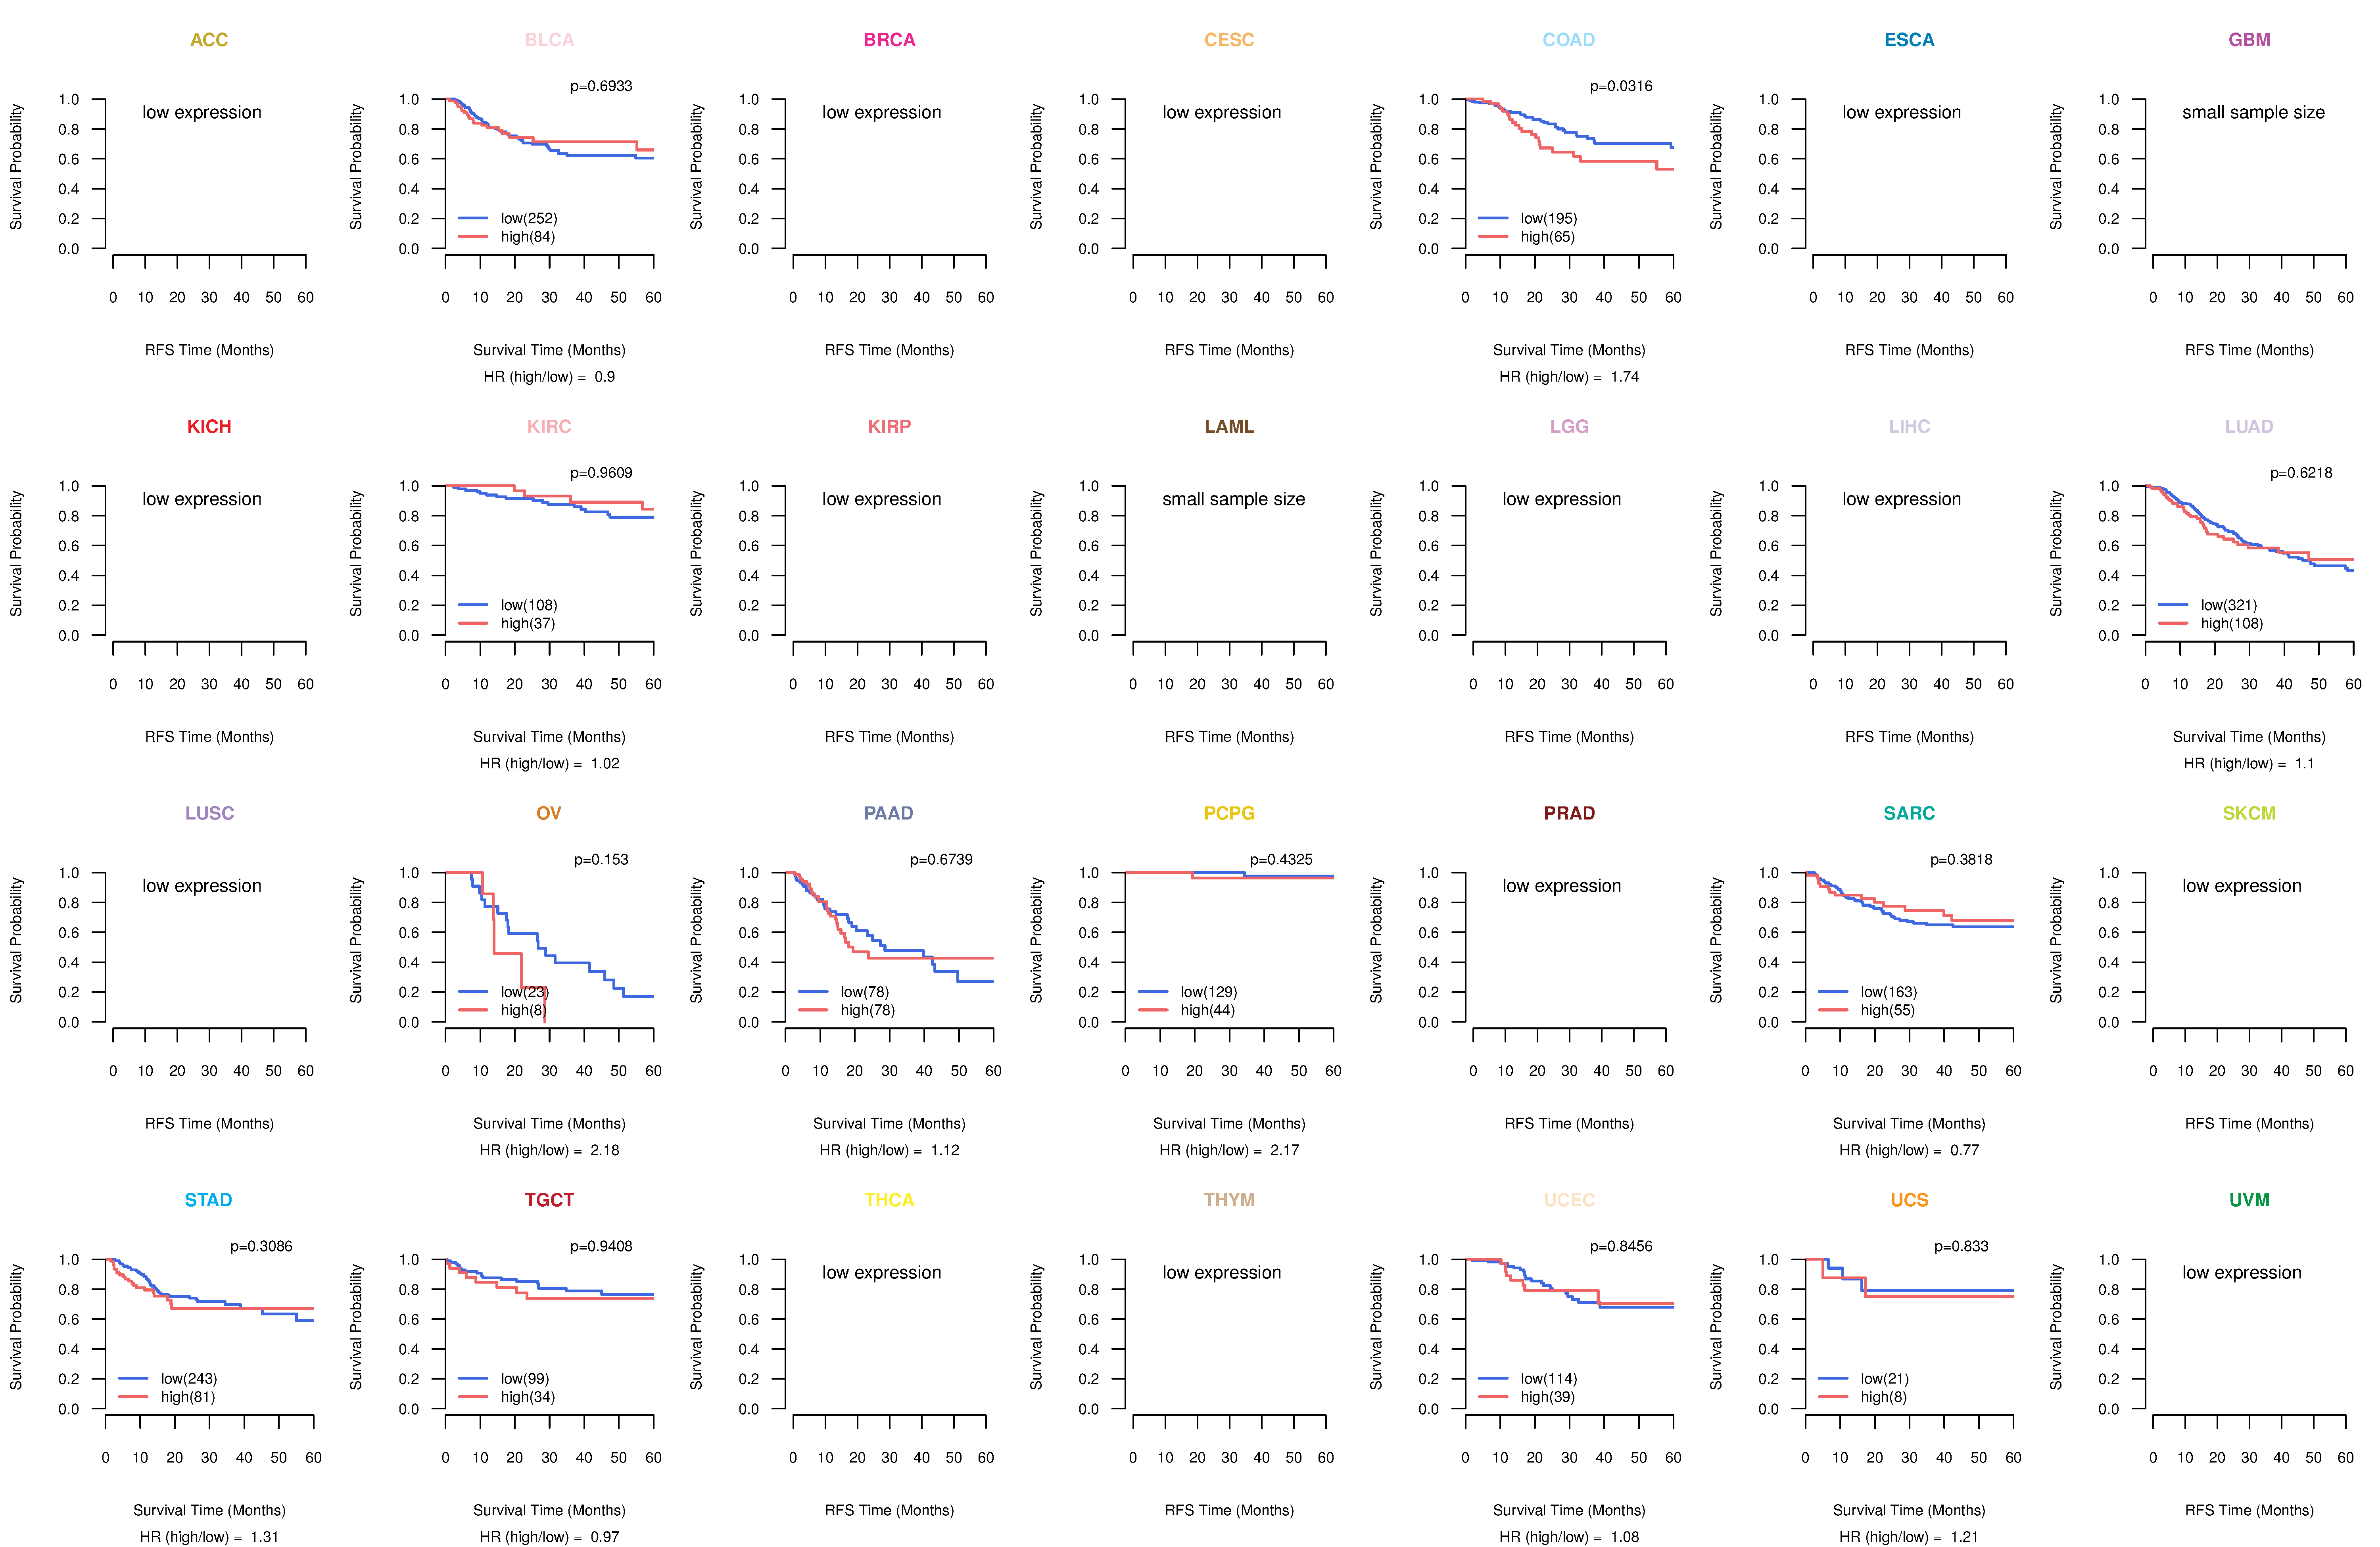
| Kaplan-Meier plots with logrank test of relapse free survival (RFS) using 28 cancer types (TCGA IlluminaHiSeq_RNASeqV2, pan-cancer normalized log2(norm_counts+1) data, version 2016-08-16) (TCGA clinicalMatrix, phenotype data, version 2016-04-27) * Click on the image enlarge it in a new window. |
 |
| Forest plot of Cox proportional hazard ratio (HR) and 95% CI of overall survival (OS) using 28 cancer types (TCGA IlluminaHiSeq_RNASeqV2, pan-cancer normalized log2(norm_counts+1) data, version 2016-08-16) (TCGA clinicalMatrix, phenotype data, version 2016-04-27) * Click on the image enlarge it in a new window. |
 |
| Forest plot of Cox proportional hazard ratio (HR) and 95% CI of relapse free survival (RFS) using 28 cancer types (TCGA IlluminaHiSeq_RNASeqV2, pan-cancer normalized log2(norm_counts+1) data, version 2016-08-16) (TCGA clinicalMatrix, phenotype data, version 2016-04-27) * Click on the image enlarge it in a new window. |
 |
| Top |
| TissGeneClin for LCN1 |
| TissGeneDrug for LCN1 |
| Drug information targeting TissGene (DrugBank Version 5.0.6, 2017-04-01) |
| DrugBank ID | Drug name | Drug activity | Drug type | Drug status |
| Top |
| TissGeneDisease for LCN1 |
| Disease information associated with TissGene (DisGeNet, 2016-06-01) |
| Disease ID | Disease name | # pubmeds | Source |
| umls:C0002395 | Alzheimer's Disease | 1 | GAD |
| umls:C0006272 | Bronchiolitis Obliterans | 1 | BeFree |
| umls:C0007138 | Carcinoma, Transitional Cell | 1 | BeFree |
| umls:C0015230 | Exanthema | 1 | BeFree |
| umls:C0026946 | Mycoses | 1 | BeFree |
| umls:C0206664 | Teratocarcinoma | 1 | BeFree |
| umls:C0278488 | Carcinoma breast stage IV | 1 | BeFree |
| umls:C0677898 | invasive cancer | 1 | BeFree |
| umls:C0848332 | Spots on skin | 1 | BeFree |
| umls:C1527336 | Sjogren's Syndrome | 1 | LHGDN |
|
Copyright 2016-Present - The University of Texas Health Science Center at Houston (UTHealth) Web File Viewing | How to Report, Fraud, Waste and Abuse | State of Texas | Statewide Search | Texas Homeland Security | Site Policies |