 |
| |
| |
| |
| |
| |
| |
|

| TissGeneSummary for LDHC |
 Gene summary Gene summary |
| Basic gene information | Gene symbol | LDHC |
| Gene name | lactate dehydrogenase C | |
| Synonyms | CT32|LDH3|LDHX | |
| Cytomap | UCSC genome browser: 11p15.1 | |
| Type of gene | protein-coding | |
| RefGenes | NM_002301.4, NM_017448.3, | |
| Description | L-lactate dehydrogenase C chainLDH testis subunitLDH-CLDH-Xcancer/testis antigen 32lactate dehydrogenase C4lactate dehydrogenase c variant 1lactate dehydrogenase c variant 3lactate dehydrogenase c variant 4 | |
| Modification date | 20141207 | |
| dbXrefs | MIM : 150150 | |
| HGNC : HGNC | ||
| Ensembl : ENSG00000166796 | ||
| HPRD : 01027 | ||
| Vega : OTTHUMG00000167722 | ||
| Protein | UniProt: go to UniProt's Cross Reference DB Table | |
| Expression | CleanEX: HS_LDHC | |
| BioGPS: 3948 | ||
| Pathway | NCI Pathway Interaction Database: LDHC | |
| KEGG: LDHC | ||
| REACTOME: LDHC | ||
| Pathway Commons: LDHC | ||
| Context | iHOP: LDHC | |
| ligand binding site mutation search in PubMed: LDHC | ||
| UCL Cancer Institute: LDHC | ||
| Assigned class in TissGDB* | A | |
| Included tissue-specific gene expression resources | HPA,TiGER,GTEx | |
| Specific-tissues in normal samples (assigned by TissGDB using HPA, TiGER, and GTEx) | Testis | |
| Cancer types related to the specific-tissues in cancer samples (assigned by TissGDB using TCGA) | TGCT | |
| Reference showing the relevant tissue of LDHC | LDHC: the ultimate testis-specific gene. Goldberg E, Eddy EM, Duan C, Odet F. J Androl. 2010 Jan-Feb;31(1):86-94. doi: 10.2164/jandrol.109.008367. Epub 2009 Oct 29. Review. (pmid:19875487) go to article | |
| Description by TissGene annotations | ||
| * Class A consists of genes with literature evidence and is part of the cTissGenes. Class B consists of only cTissGenes without additional evidence. The remaining genes belong to Class C. |
| Gene ontology having evidence of Inferred from Direct Assay (IDA) from Entrez |
| GO ID | GO term | PubMed ID |
| Top |
| TissGeneExp for LDHC |
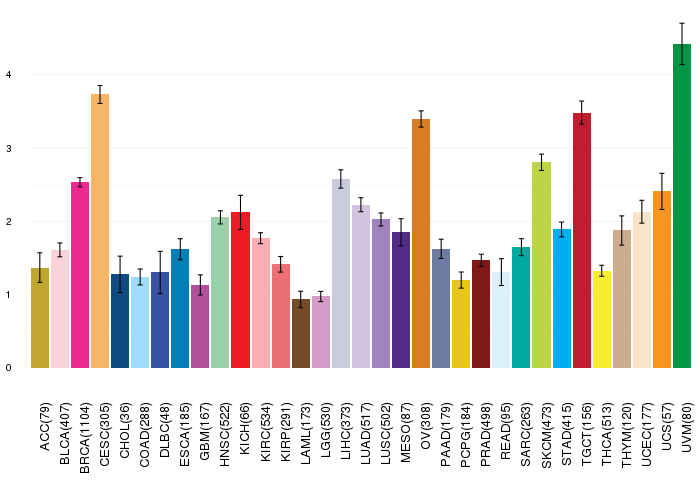
| Gene expressions across 28 cancer types (X-axis: cancer type and Y-axis: log2(norm_counts+1)) (TCGA IlluminaHiSeq_RNASeqV2, pan-cancer normalized log2(norm_counts+1) data, version 2016-08-16) |
 |
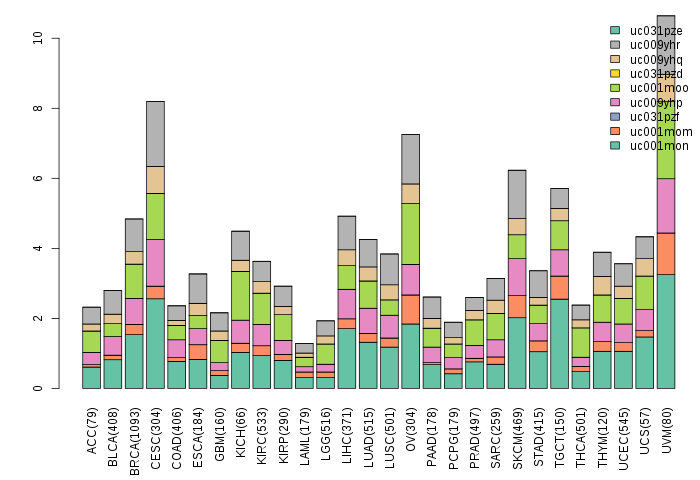
| Gene isoform expressions across 28 cancer types (X-axis: cancer type and Y-axis: log2(norm_counts+1)) (TCGA pan-cancer tcga_rsem_isoform_tpm, version 2016-09-01) |
 |
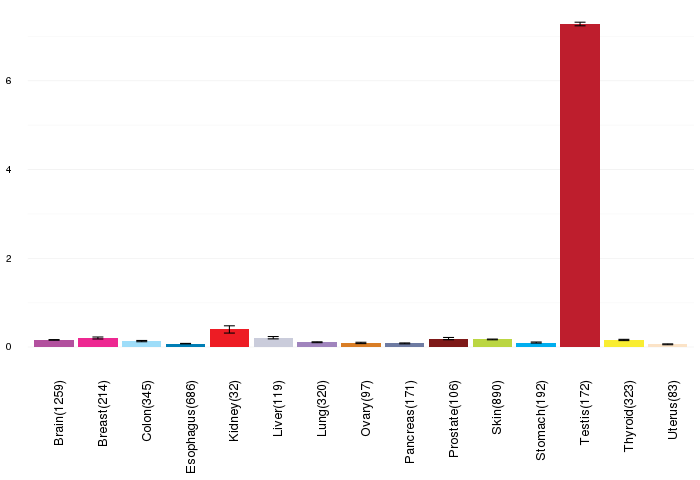
| Gene expressions across normal tissues of GTEx data (GTEx GTEx_Analysis_v6_RNA-seq_RNA-SeQCv1.1.8_gene_rpkm.gct) - Here, we shows the matched tissue types only among our 28 cancer types. |
 |
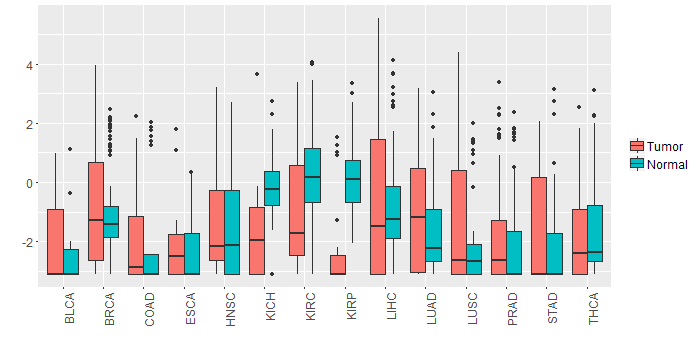
| Different expressions across 14 cancer types with more than 10 samples between matched tumors and normals (X-axis: cancer type and Y-axis: log2(norm_counts+1)) (TCGA IlluminaHiSeq_RNASeqV2, pan-cancer normalized log2(norm_counts+1) data, version 2016-08-16) |
 |
| - Significantly differentially expressed cancer types and information. (|Fold change|>1 and FDR<0.05) |
| Cancer type | Mean(exp) in tumor | Mean(exp) in matched normal | Log2FC | P-val. | FDR |
| KIRC | -1.121501758 | 0.426280186 | -1.547781944 | 2.54E-07 | 6.85E-07 |
| KIRP | -2.326294814 | 0.205108311 | -2.531403125 | 2.73E-10 | 2.89E-09 |
| KICH | -1.714084314 | -0.111072314 | -1.603012 | 0.000151 | 0.00037948 |
| Top |
| TissGene-miRNA for LDHC |
| Significantly anti-correlated miRNAs of TissGene across 28 cancer types (Gene-miRNA relations from TargetScanHuman Relsease 7.1, Conserved_Site_Context_Scores.txt.zip, 06.01.2016) (TCGA IlluminaHiSeq_miRNASeq, log2(RPM+1) data, version 2016-11-21) (TCGA IlluminaHiSeq_RNASeqV2, log2(normalized_count+1) data, version 2016-08-16) (Spearman’s Rank Correlation (p-value<0.05 and coefficient<-0.25)) |
| Cancer type | miRNA id | miRNA accession | P-val. | Coeff. | # samples |
| Top |
| TissGeneMut for LDHC |
| TissGeneSNV for LDHC |
| nsSNV counts per each loci. Different colors of circles represent different cancer types. Circle size denotes number of samples. (TCGA somatic mutation (SNPs and small INDELs) data, version 2016-04-25) * Click on the image to enlarge it in a new window. |
 |
 |
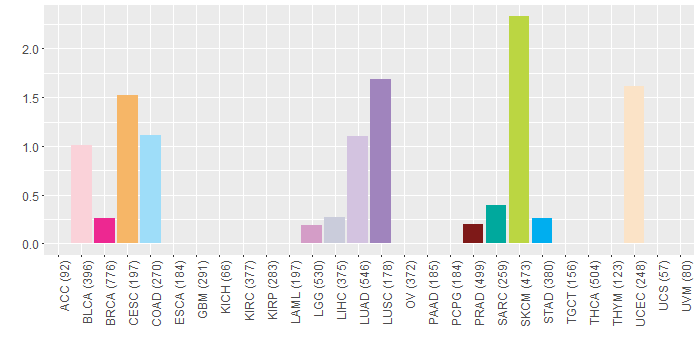
| Somatic nucleotide variants of TissGene across 28 cancer types (X-axis: cancer type and Y-axis: % of mutated samples) The numbers in parentheses are numbers of samples with mutation (nsSNVs). (TCGA somatic mutation (SNPs and small INDELs) data, version 2016-04-25) |
 |
| - nsSNVs sorted by frequency. |
| AAchange | Cancer type | # samples |
| p.R157C | SKCM | 2 |
| p.P292S | SKCM | 1 |
| p.L330V | BLCA | 1 |
| p.D52N | UCEC | 1 |
| p.W227* | SKCM | 1 |
| p.T220M | PRAD | 1 |
| p.N88S | SKCM | 1 |
| p.V304L | SARC | 1 |
| p.N18K | LUAD | 1 |
| p.E6Q | BRCA | 1 |
| p.A108D | COAD | 1 |
| p.P122S | SKCM | 1 |
| p.S310F | SKCM | 1 |
| p.K265I | SKCM | 1 |
| p.F71L | READ | 1 |
| p.R157C | HNSC | 1 |
| p.P129T | HNSC | 1 |
| p.S119L | CESC | 1 |
| p.L143F | LUAD | 1 |
| p.Y247H | CESC | 1 |
| p.A168G | COAD | 1 |
| p.K76N | STAD | 1 |
| p.S319I | HNSC | 1 |
| p.G152S | LGG | 1 |
| p.S249F | LUSC | 1 |
| p.P129N | HNSC | 1 |
| p.W227L | LUAD | 1 |
| p.R297Q | BLCA | 1 |
| p.S119L | SKCM | 1 |
| p.R90K | BLCA | 1 |
| p.R106C | SKCM | 1 |
| p.E192K | BRCA | 1 |
| p.E10D | BLCA | 1 |
| p.P129H | HNSC | 1 |
| p.S151G | LUSC | 1 |
| p.D16N | CESC | 1 |
| p.L289I | UCEC | 1 |
| p.H271R | LIHC | 1 |
| p.D43V | LUAD | 1 |
| p.K217E | UCEC | 1 |
| p.K177R | SKCM | 1 |
| p.S2L | UCEC | 1 |
| p.L65R | LUAD | 1 |
| p.R171H | LUSC | 1 |
| p.R269K | COAD | 1 |
| p.R112C | LUAD | 1 |
| Top |
| TissGeneCNV for LDHC |
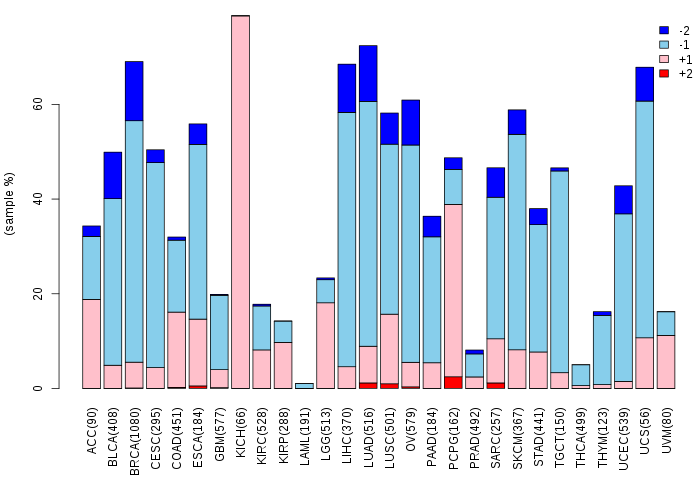
| Copy number variations of TissGene across 28 cancer types (X-axis: cancer type and Y-axis: % of CNV samples) (TCGA Gistic2_CopyNumber_Gistic2_all_data_by_genes, Gistic2 copy number data, version 2016-08-16) |
 |
| Top |
| TissGeneFusions for LDHC |
| Fusion genes including TissGene (ChimerDB 3.0, 2016-12-01 and TCGA fusion Portal 2015-12-01) |
| Database | Src | Cancer type | Sample | Fusion gene | ORF | 5'-gene BP | 3'-gene BP |
| Top |
| TissGeneNet for LDHC |
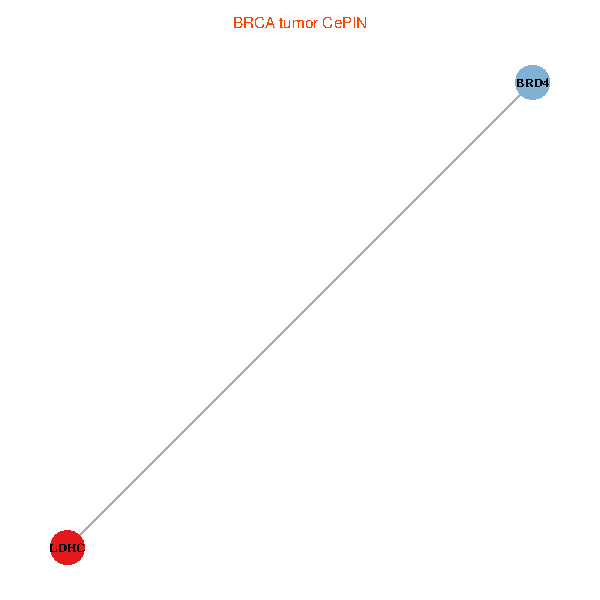
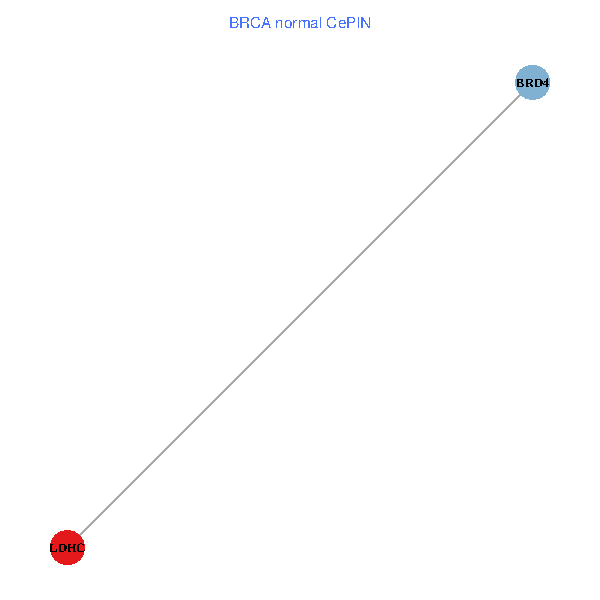
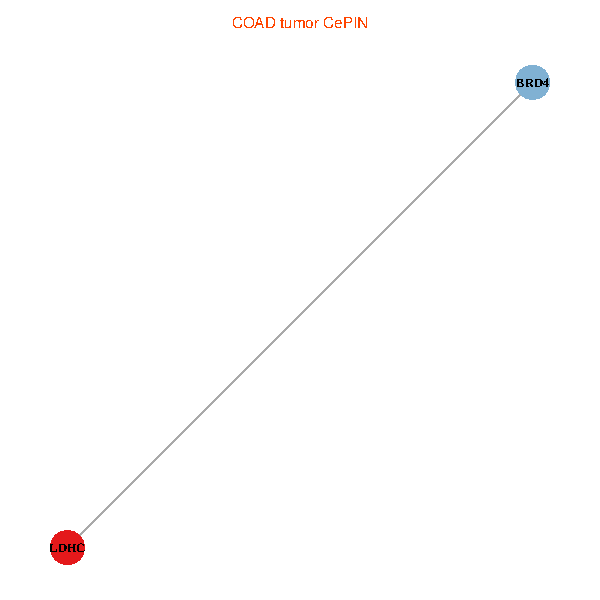
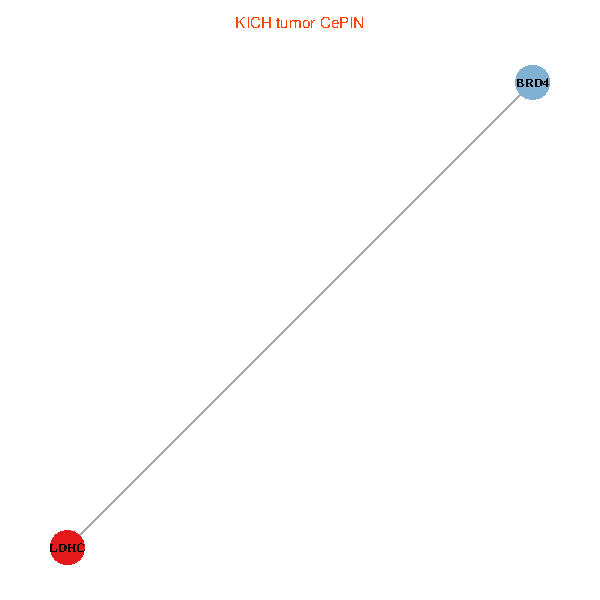
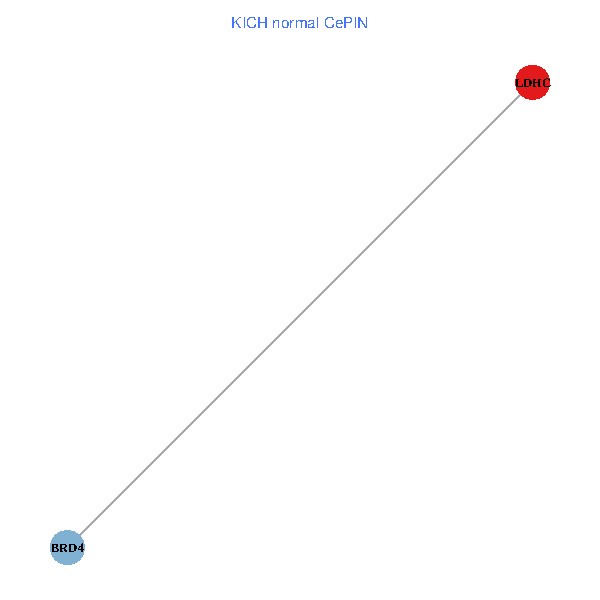
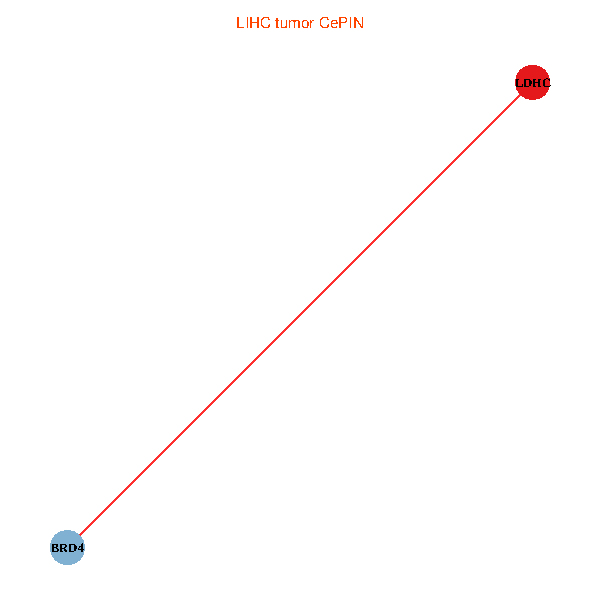
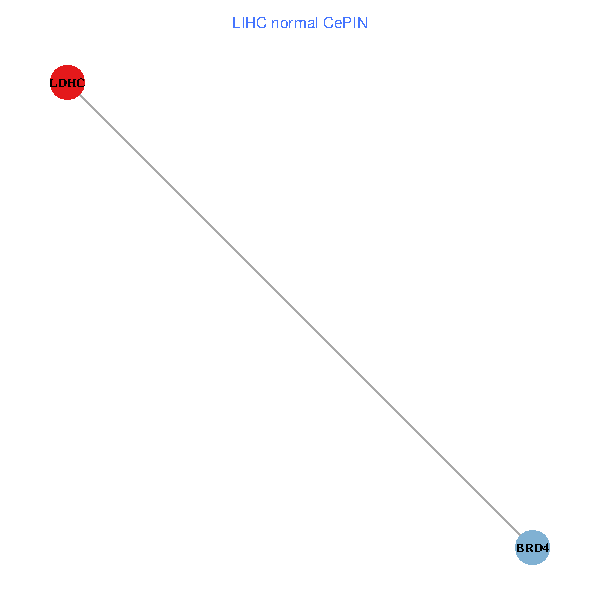
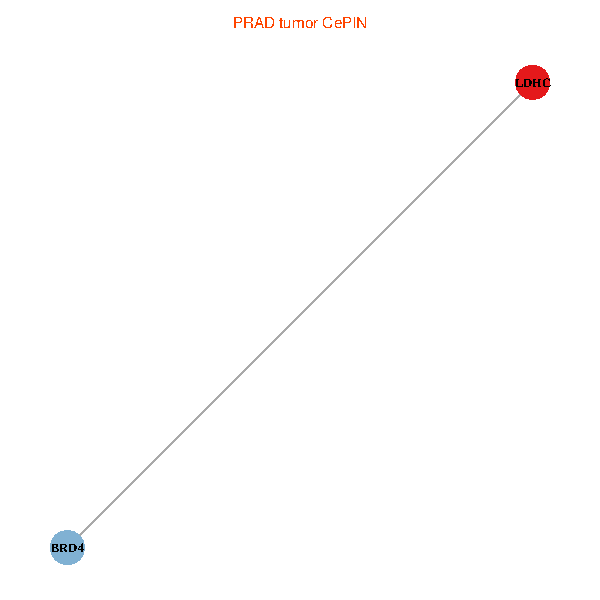
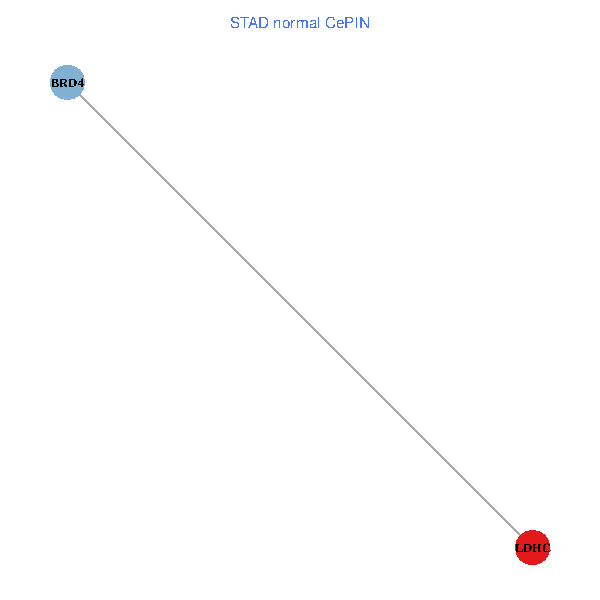
| Co-expressed gene networks based on protein-protein interaction data (CePIN) (TCGA IlluminaHiSeq_RNASeqV2, pan-cancer normalized log2(norm_counts+1) data, version 2016-08-16) (PINA2 ppi data) |
| BRCA (tumor) | BRCA (normal) |
| LDHC, BRD4 (tumor) | LDHC, BRD4 (normal) |
 |  |
| COAD (tumor) | COAD (normal) |
| LDHC, BRD4 (tumor) | LDHC, BRD4 (normal) |
 |  |
| HNSC (tumor) | HNSC (normal) |
| LDHC, BRD4 (tumor) | LDHC, BRD4 (normal) |
 |  |
| KICH (tumor) | KICH (normal) |
| LDHC, BRD4 (tumor) | LDHC, BRD4 (normal) |
 |  |
| KIRC (tumor) | KIRC (normal) |
| LDHC, BRD4 (tumor) | LDHC, BRD4 (normal) |
 |  |
| KIRP (tumor) | KIRP (normal) |
| LDHC, BRD4 (tumor) | LDHC, BRD4 (normal) |
 |  |
| LIHC (tumor) | LIHC (normal) |
| LDHC, BRD4 (tumor) | LDHC, BRD4 (normal) |
 |  |
| LUAD (tumor) | LUAD (normal) |
| LDHC, BRD4 (tumor) | LDHC, BRD4 (normal) |
 |  |
| LUSC (tumor) | LUSC (normal) |
| LDHC, BRD4 (tumor) | LDHC, BRD4 (normal) |
 |  |
| PRAD (tumor) | PRAD (normal) |
| LDHC, BRD4 (tumor) | LDHC, BRD4 (normal) |
 |  |
| STAD (tumor) | STAD (normal) |
| LDHC, BRD4 (tumor) | LDHC, BRD4 (normal) |
 |  |
| THCA (tumor) | THCA (normal) |
| LDHC, BRD4 (tumor) | LDHC, BRD4 (normal) |
 |  |
| Top |
| TissGeneProg for LDHC |
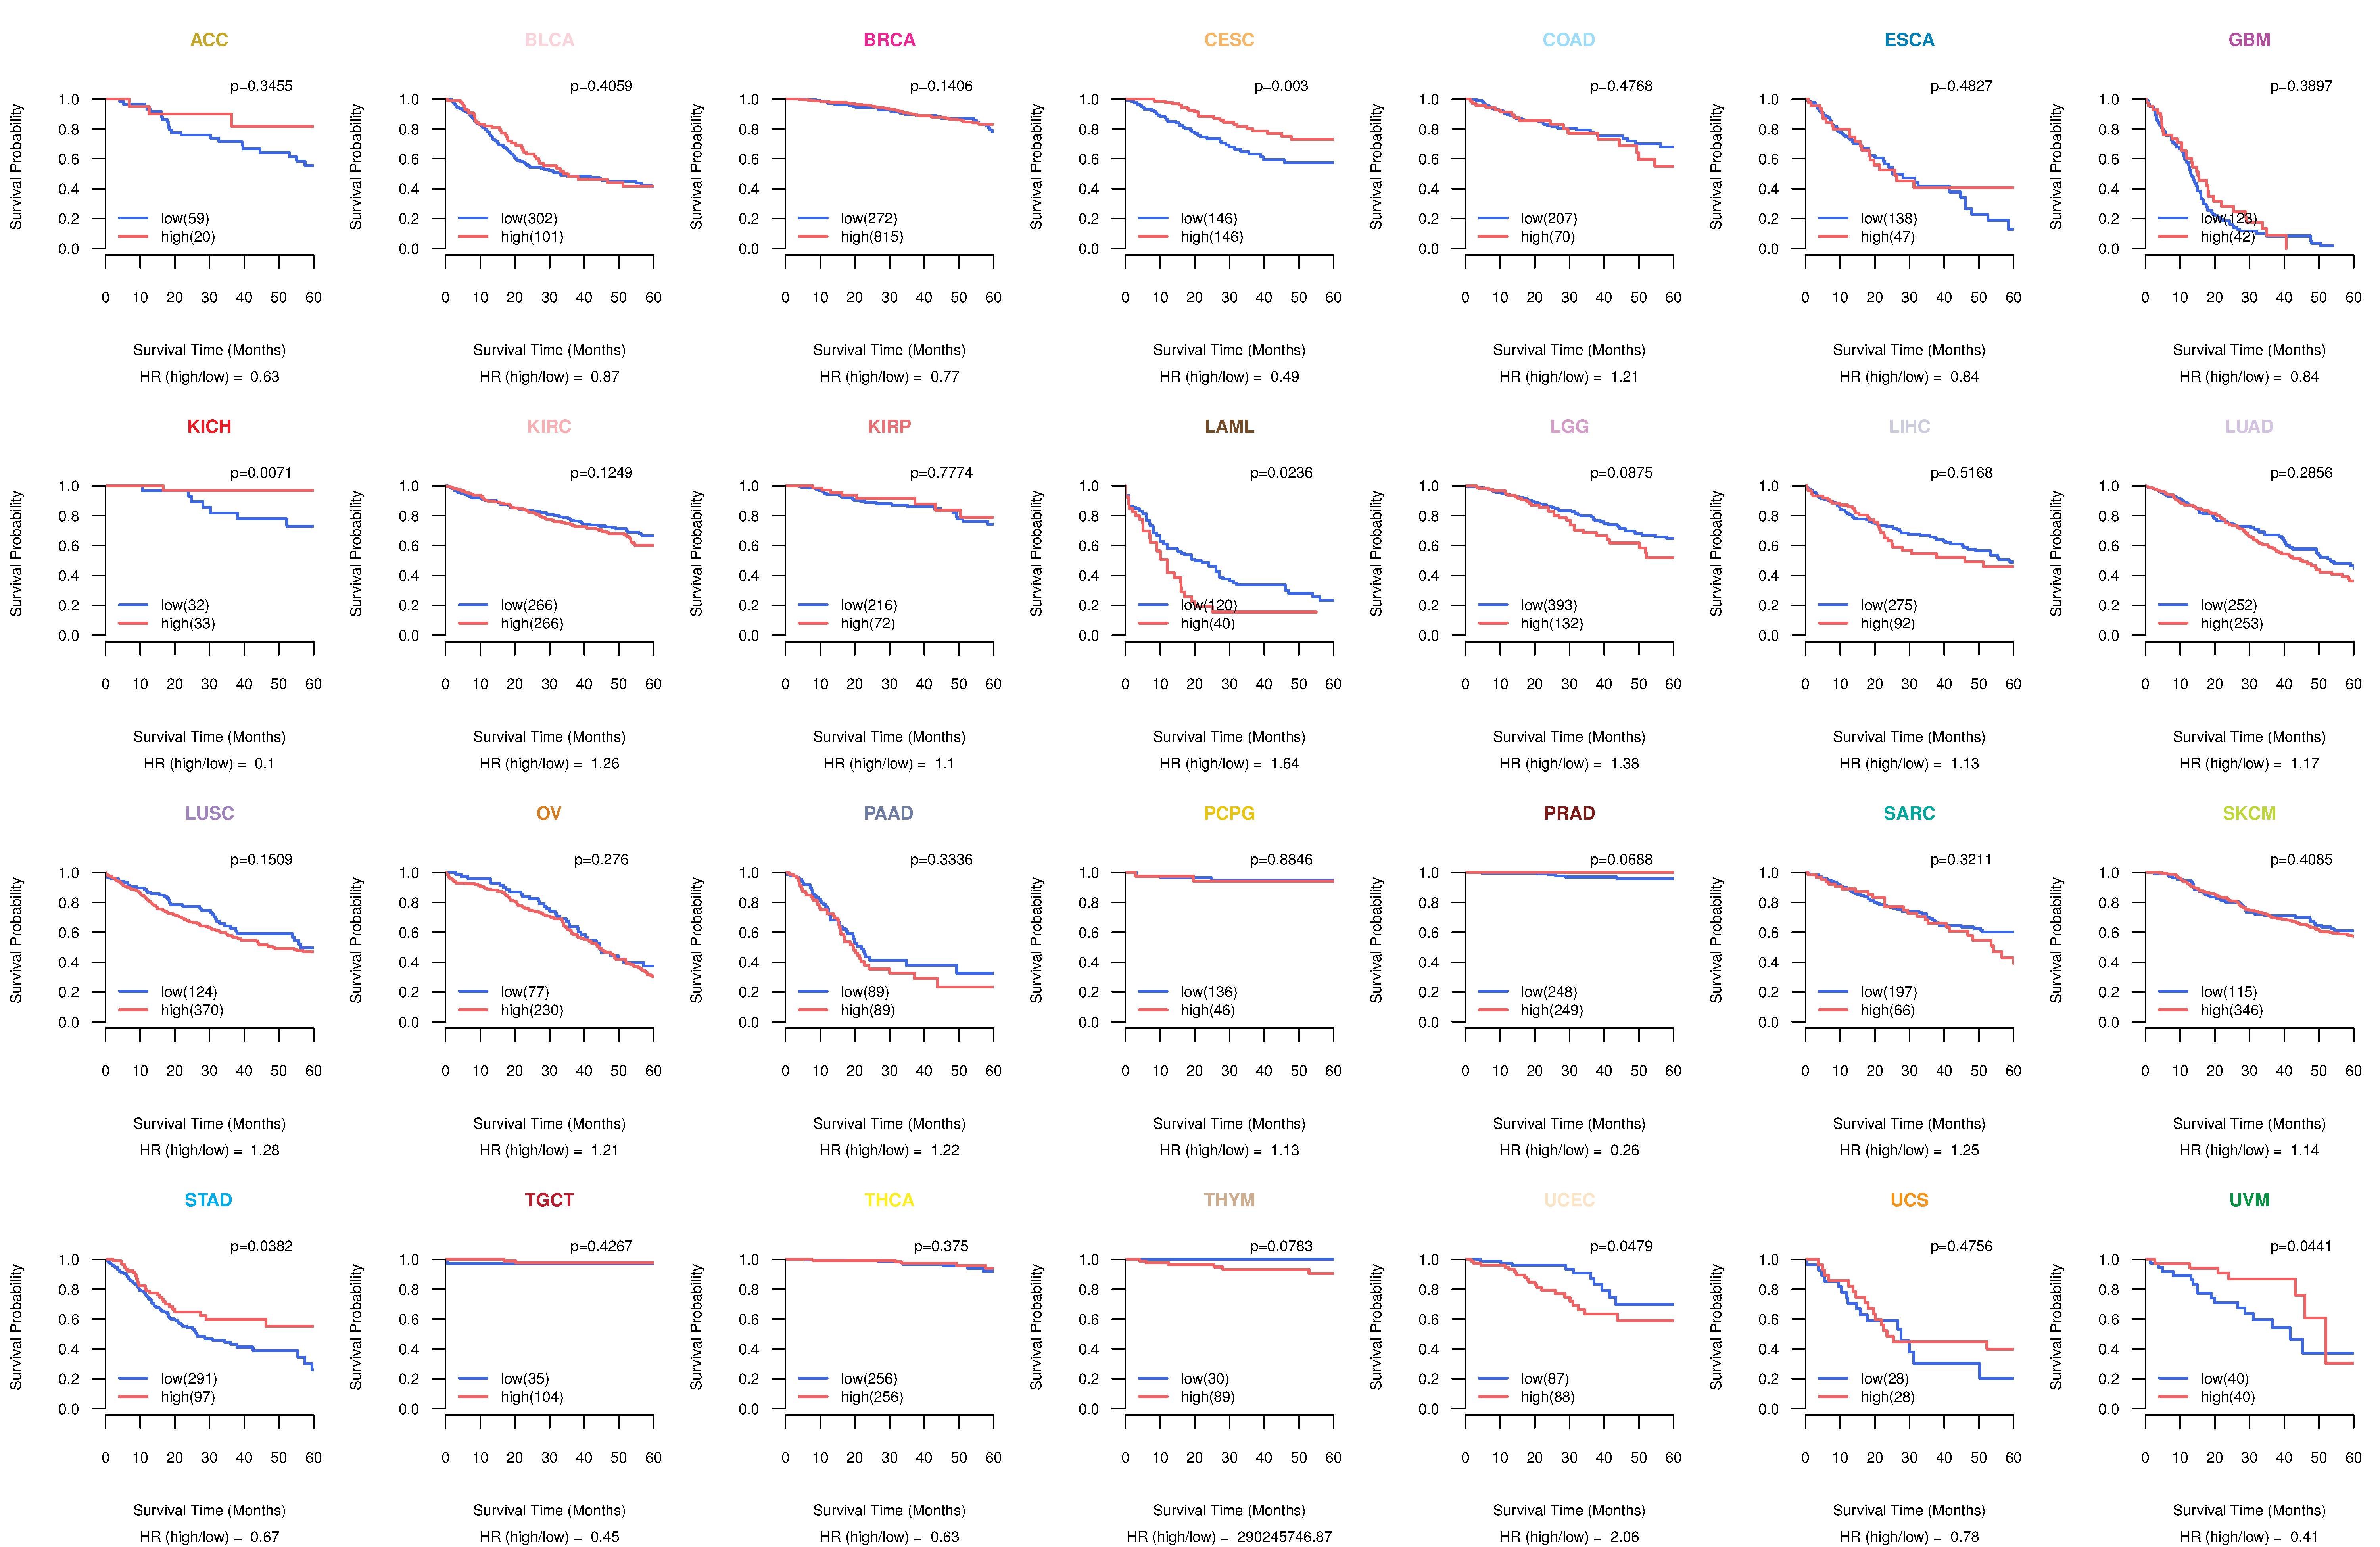
| Kaplan-Meier plots with logrank tests of overall survival (OS) using 28 cancer types (TCGA IlluminaHiSeq_RNASeqV2, pan-cancer normalized log2(norm_counts+1) data, version 2016-08-16) (TCGA clinicalMatrix, phenotype data, version 2016-04-27) * Click on the image to enlarge it in a new window. |
 |
| Kaplan-Meier plots with logrank test of relapse free survival (RFS) using 28 cancer types (TCGA IlluminaHiSeq_RNASeqV2, pan-cancer normalized log2(norm_counts+1) data, version 2016-08-16) (TCGA clinicalMatrix, phenotype data, version 2016-04-27) * Click on the image enlarge it in a new window. |
 |
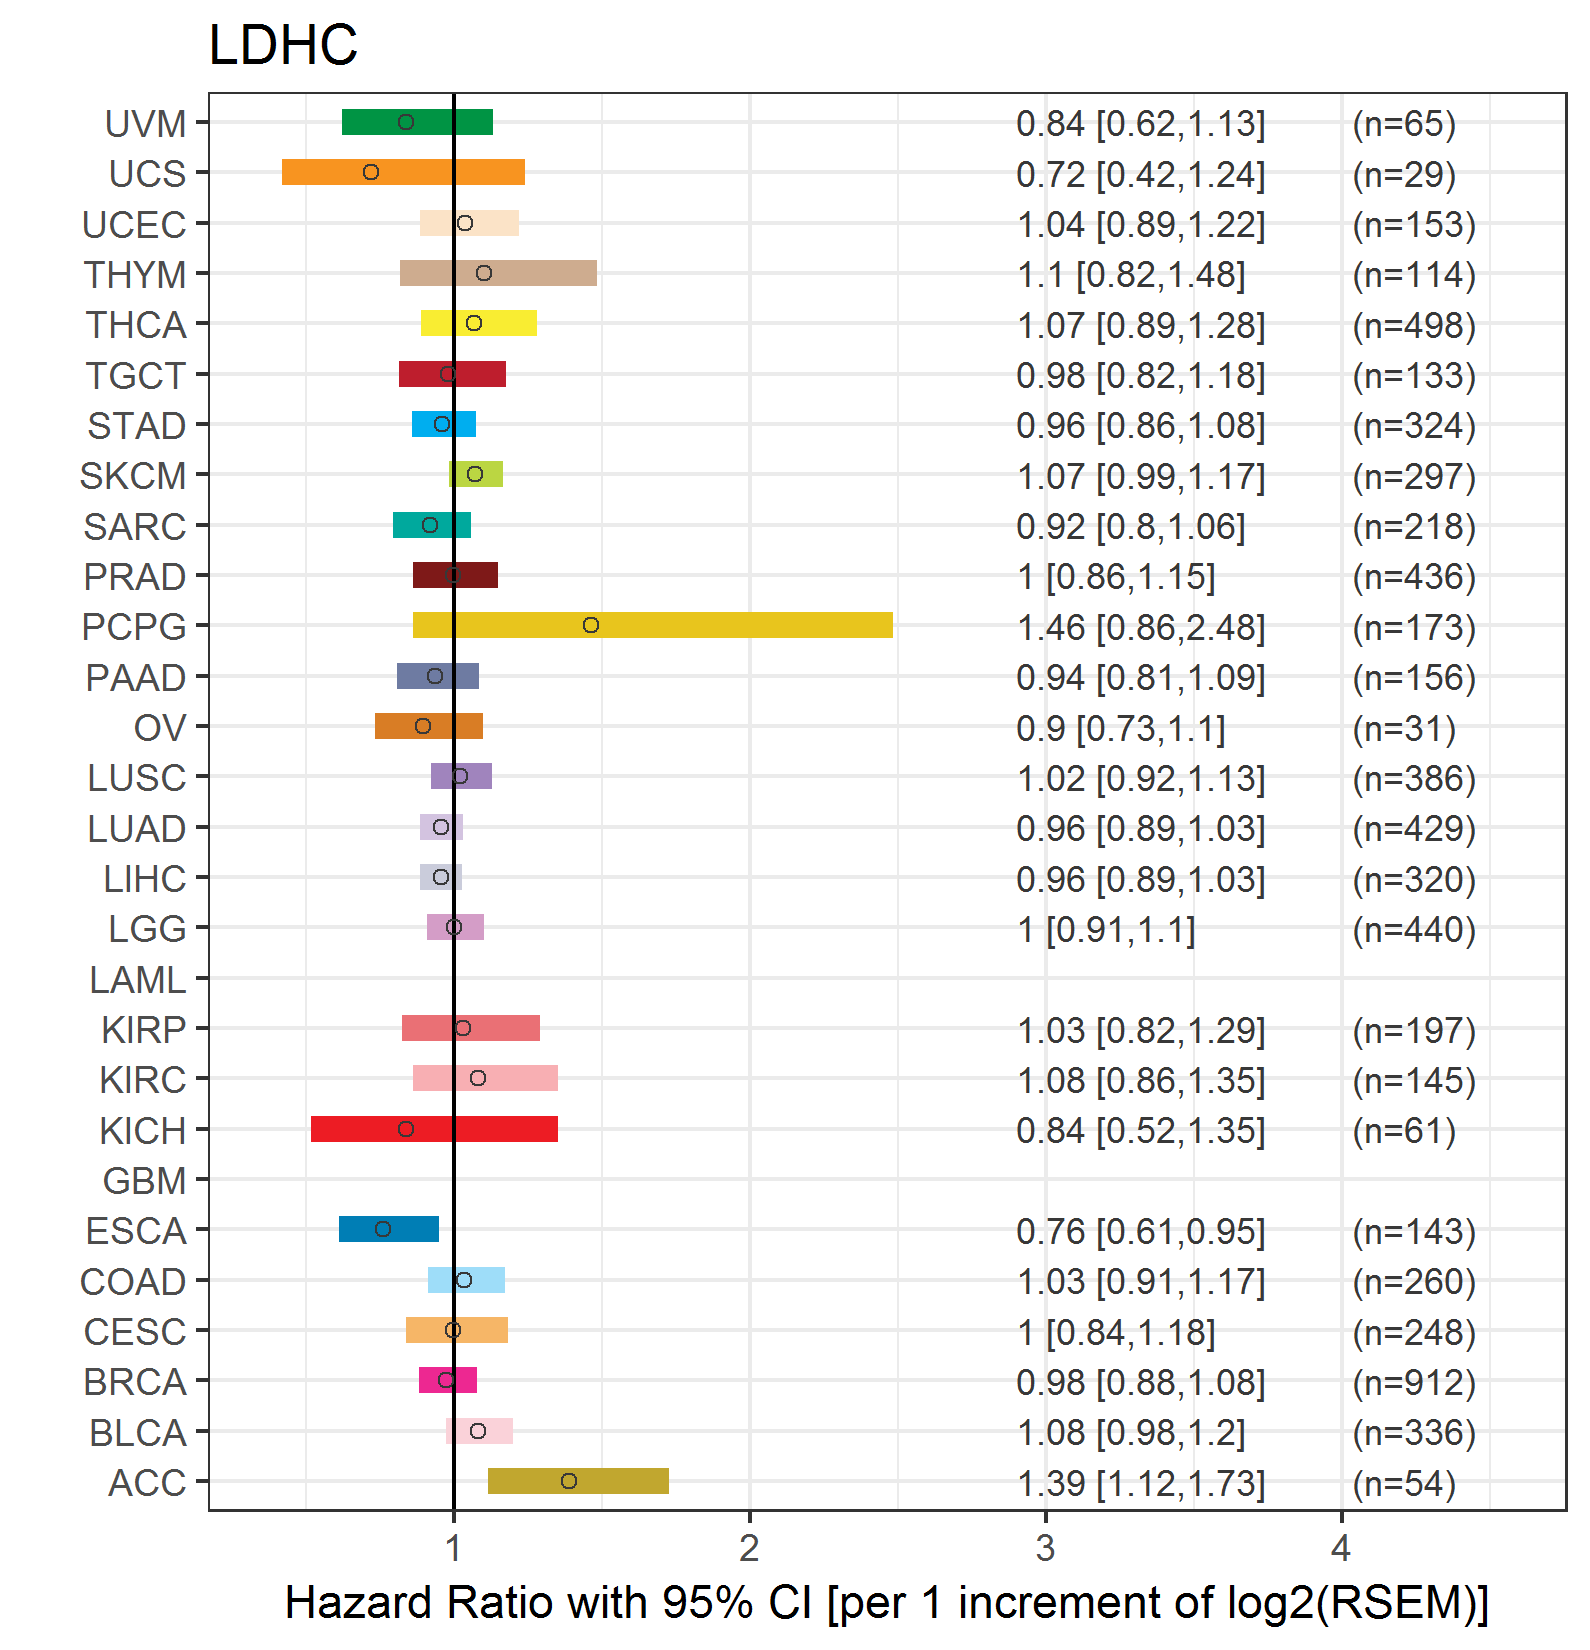
| Forest plot of Cox proportional hazard ratio (HR) and 95% CI of overall survival (OS) using 28 cancer types (TCGA IlluminaHiSeq_RNASeqV2, pan-cancer normalized log2(norm_counts+1) data, version 2016-08-16) (TCGA clinicalMatrix, phenotype data, version 2016-04-27) * Click on the image enlarge it in a new window. |
 |
| Forest plot of Cox proportional hazard ratio (HR) and 95% CI of relapse free survival (RFS) using 28 cancer types (TCGA IlluminaHiSeq_RNASeqV2, pan-cancer normalized log2(norm_counts+1) data, version 2016-08-16) (TCGA clinicalMatrix, phenotype data, version 2016-04-27) * Click on the image enlarge it in a new window. |
 |
| Top |
| TissGeneClin for LDHC |
| TissGeneDrug for LDHC |
| Drug information targeting TissGene (DrugBank Version 5.0.6, 2017-04-01) |
| DrugBank ID | Drug name | Drug activity | Drug type | Drug status |
| Top |
| TissGeneDisease for LDHC |
| Disease information associated with TissGene (DisGeNet, 2016-06-01) |
| Disease ID | Disease name | # pubmeds | Source |
| umls:C0021364 | Male infertility | 2 | CTD_human |
| umls:C0007131 | Non-Small Cell Lung Carcinoma | 1 | BeFree |
| umls:C0024115 | Lung diseases | 1 | CTD_human |
| umls:C0028960 | Oligospermia | 1 | BeFree |
| umls:C0040028 | Thrombocythemia, Essential | 1 | LHGDN |
| umls:C0041296 | Tuberculosis | 1 | LHGDN |
| umls:C0596263 | Carcinogenesis | 1 | BeFree |
|
Copyright 2016-Present - The University of Texas Health Science Center at Houston (UTHealth) Web File Viewing | How to Report, Fraud, Waste and Abuse | State of Texas | Statewide Search | Texas Homeland Security | Site Policies |