 |
| |
| |
| |
| |
| |
| |
|

| TissGeneSummary for LECT2 |
 Gene summary Gene summary |
| Basic gene information | Gene symbol | LECT2 |
| Gene name | leukocyte cell-derived chemotaxin 2 | |
| Synonyms | chm-II|chm2 | |
| Cytomap | UCSC genome browser: 5q31.1 | |
| Type of gene | protein-coding | |
| RefGenes | NM_002302.2, | |
| Description | chondromodulin-IIleukocyte cell-derived chemotaxin-2 | |
| Modification date | 20141207 | |
| dbXrefs | MIM : 602882 | |
| HGNC : HGNC | ||
| Ensembl : ENSG00000145826 | ||
| HPRD : 04196 | ||
| Vega : OTTHUMG00000129146 | ||
| Protein | UniProt: go to UniProt's Cross Reference DB Table | |
| Expression | CleanEX: HS_LECT2 | |
| BioGPS: 3950 | ||
| Pathway | NCI Pathway Interaction Database: LECT2 | |
| KEGG: LECT2 | ||
| REACTOME: LECT2 | ||
| Pathway Commons: LECT2 | ||
| Context | iHOP: LECT2 | |
| ligand binding site mutation search in PubMed: LECT2 | ||
| UCL Cancer Institute: LECT2 | ||
| Assigned class in TissGDB* | A | |
| Included tissue-specific gene expression resources | HPA,TiGER,GTEx | |
| Specific-tissues in normal samples (assigned by TissGDB using HPA, TiGER, and GTEx) | Liver | |
| Cancer types related to the specific-tissues in cancer samples (assigned by TissGDB using TCGA) | LIHC | |
| Reference showing the relevant tissue of LECT2 | Functional diets modulate the acute phase protein response in Oncorhynchus mykiss subjected to chronic stress and challenged with Vibrio anguillarum. Castro-Osses D, Carrera-Naipil C, Gallardo-Escárate C, Gonçalves AT. Fish Shellfish Immunol. 2017 Jul;66:62-70. doi: 10.1016/j.fsi.2017.05.001. Epub 2017 May 2. (pmid:28476670) go to article | |
| Description by TissGene annotations | TissgsKTS CNV lost TissGeneKTS | |
| * Class A consists of genes with literature evidence and is part of the cTissGenes. Class B consists of only cTissGenes without additional evidence. The remaining genes belong to Class C. |
| Gene ontology having evidence of Inferred from Direct Assay (IDA) from Entrez |
| GO ID | GO term | PubMed ID |
| Top |
| TissGeneExp for LECT2 |
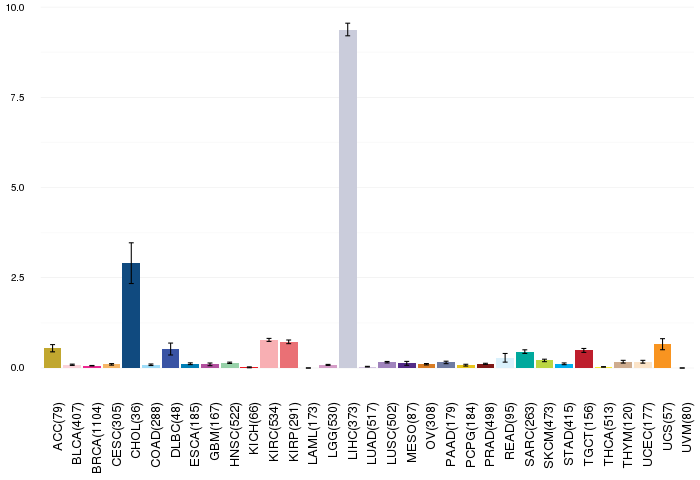
| Gene expressions across 28 cancer types (X-axis: cancer type and Y-axis: log2(norm_counts+1)) (TCGA IlluminaHiSeq_RNASeqV2, pan-cancer normalized log2(norm_counts+1) data, version 2016-08-16) |
 |
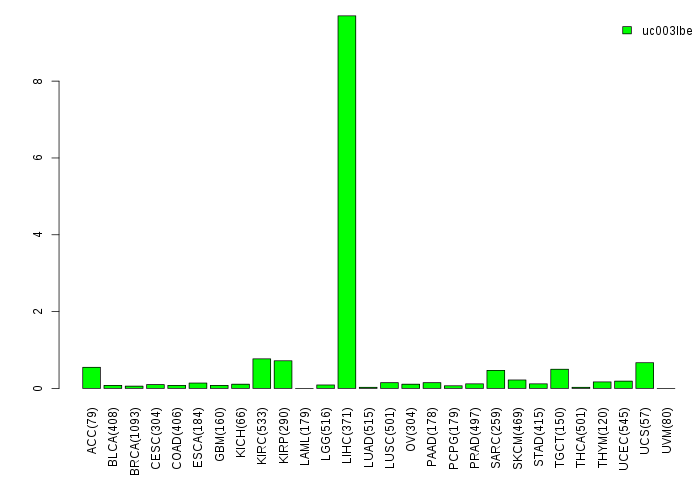
| Gene isoform expressions across 28 cancer types (X-axis: cancer type and Y-axis: log2(norm_counts+1)) (TCGA pan-cancer tcga_rsem_isoform_tpm, version 2016-09-01) |
 |
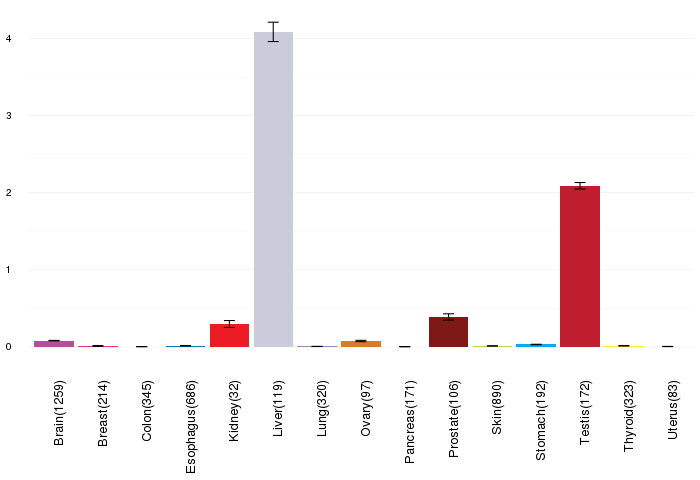
| Gene expressions across normal tissues of GTEx data (GTEx GTEx_Analysis_v6_RNA-seq_RNA-SeQCv1.1.8_gene_rpkm.gct) - Here, we shows the matched tissue types only among our 28 cancer types. |
 |
| Different expressions across 14 cancer types with more than 10 samples between matched tumors and normals (X-axis: cancer type and Y-axis: log2(norm_counts+1)) (TCGA IlluminaHiSeq_RNASeqV2, pan-cancer normalized log2(norm_counts+1) data, version 2016-08-16) |
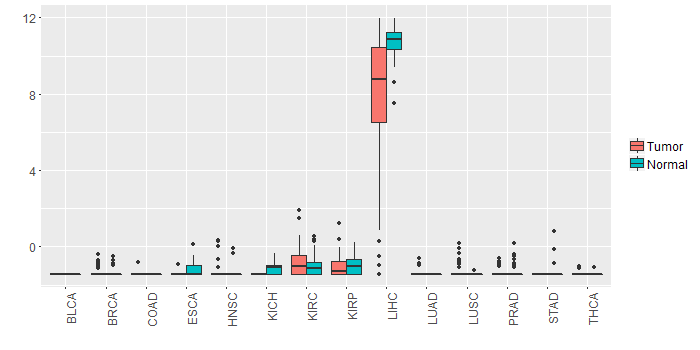 |
| - Significantly differentially expressed cancer types and information. (|Fold change|>1 and FDR<0.05) |
| Cancer type | Mean(exp) in tumor | Mean(exp) in matched normal | Log2FC | P-val. | FDR |
| LIHC | 7.638506471 | 10.72074047 | -3.082234 | 3.53E-07 | 2.14E-06 |
| Top |
| TissGene-miRNA for LECT2 |
| Significantly anti-correlated miRNAs of TissGene across 28 cancer types (Gene-miRNA relations from TargetScanHuman Relsease 7.1, Conserved_Site_Context_Scores.txt.zip, 06.01.2016) (TCGA IlluminaHiSeq_miRNASeq, log2(RPM+1) data, version 2016-11-21) (TCGA IlluminaHiSeq_RNASeqV2, log2(normalized_count+1) data, version 2016-08-16) (Spearman’s Rank Correlation (p-value<0.05 and coefficient<-0.25)) |
| Cancer type | miRNA id | miRNA accession | P-val. | Coeff. | # samples |
| Top |
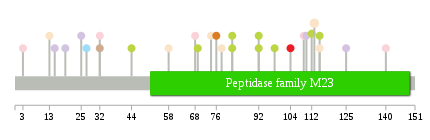
| TissGeneMut for LECT2 |
| TissGeneSNV for LECT2 |
| nsSNV counts per each loci. Different colors of circles represent different cancer types. Circle size denotes number of samples. (TCGA somatic mutation (SNPs and small INDELs) data, version 2016-04-25) * Click on the image to enlarge it in a new window. |
 |
 |
| Somatic nucleotide variants of TissGene across 28 cancer types (X-axis: cancer type and Y-axis: % of mutated samples) The numbers in parentheses are numbers of samples with mutation (nsSNVs). (TCGA somatic mutation (SNPs and small INDELs) data, version 2016-04-25) |
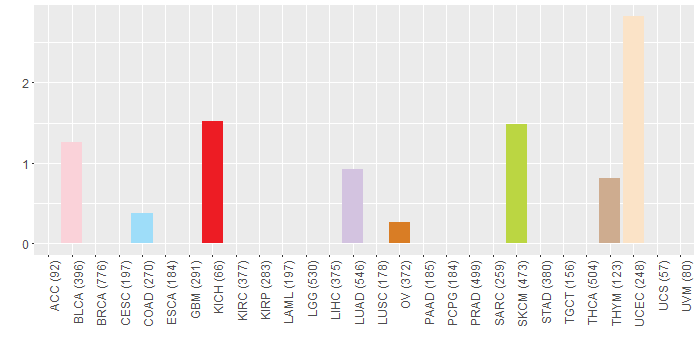 |
| - nsSNVs sorted by frequency. |
| AAchange | Cancer type | # samples |
| p.P113H | UCEC | 2 |
| p.A68P | BLCA | 1 |
| p.G19V | LUAD | 1 |
| p.Q82* | SKCM | 1 |
| p.G112D | SKCM | 1 |
| p.R92* | SKCM | 1 |
| p.K109N | BLCA | 1 |
| p.K115E | SKCM | 1 |
| p.P69L | SKCM | 1 |
| p.C25Y | HNSC | 1 |
| p.C25Y | LUAD | 1 |
| p.E32D | BLCA | 1 |
| p.T15I | LUAD | 1 |
| p.I58S | UCEC | 1 |
| p.Q82X | SKCM | 1 |
| p.I13F | UCEC | 1 |
| p.G76R | OV | 1 |
| p.Y104C | KICH | 1 |
| p.G27V | COAD | 1 |
| p.E78D | UCEC | 1 |
| p.Y110N | LUAD | 1 |
| p.Y44F | SKCM | 1 |
| p.S3C | BLCA | 1 |
| p.F98Y | SKCM | 1 |
| p.K115T | UCEC | 1 |
| p.E140K | BLCA | 1 |
| p.K84N | HNSC | 1 |
| p.E32K | THYM | 1 |
| p.P125H | LUAD | 1 |
| p.Q74P | UCEC | 1 |
| p.R92X | SKCM | 1 |
| Top |
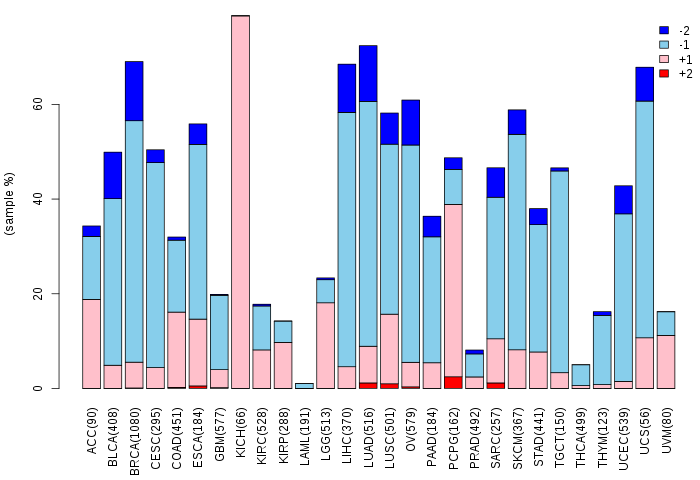
| TissGeneCNV for LECT2 |
| Copy number variations of TissGene across 28 cancer types (X-axis: cancer type and Y-axis: % of CNV samples) (TCGA Gistic2_CopyNumber_Gistic2_all_data_by_genes, Gistic2 copy number data, version 2016-08-16) |
 |
| Top |
| TissGeneFusions for LECT2 |
| Fusion genes including TissGene (ChimerDB 3.0, 2016-12-01 and TCGA fusion Portal 2015-12-01) |
| Database | Src | Cancer type | Sample | Fusion gene | ORF | 5'-gene BP | 3'-gene BP |
| Top |
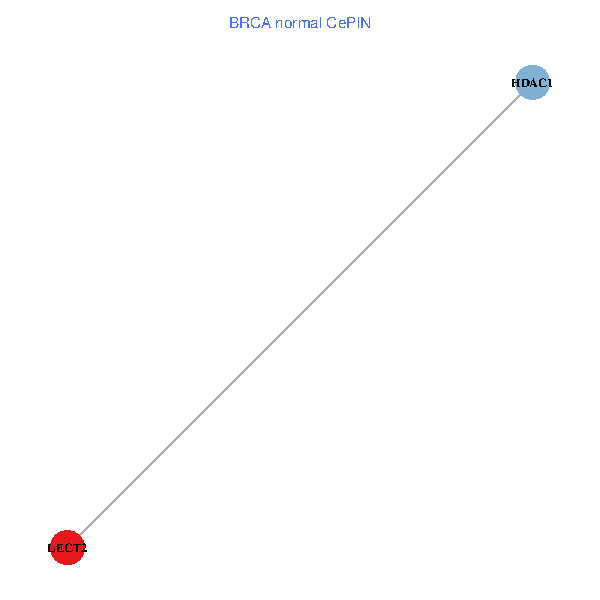
| TissGeneNet for LECT2 |
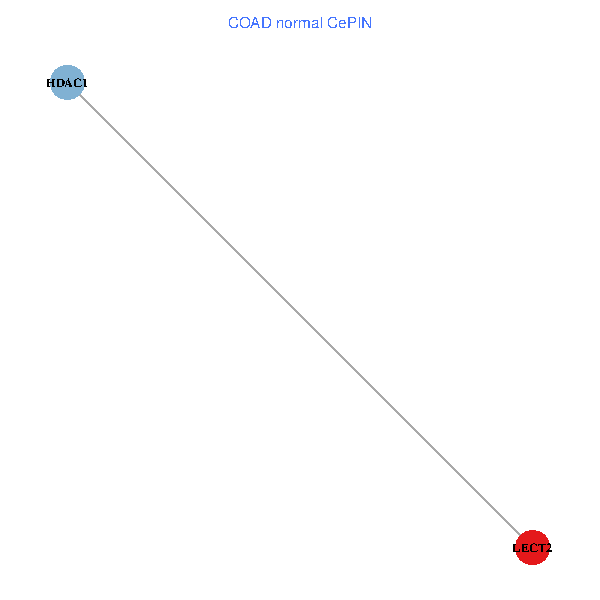
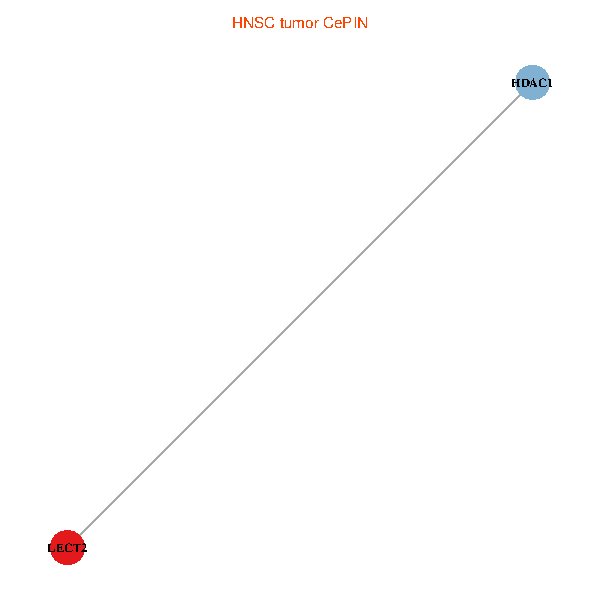
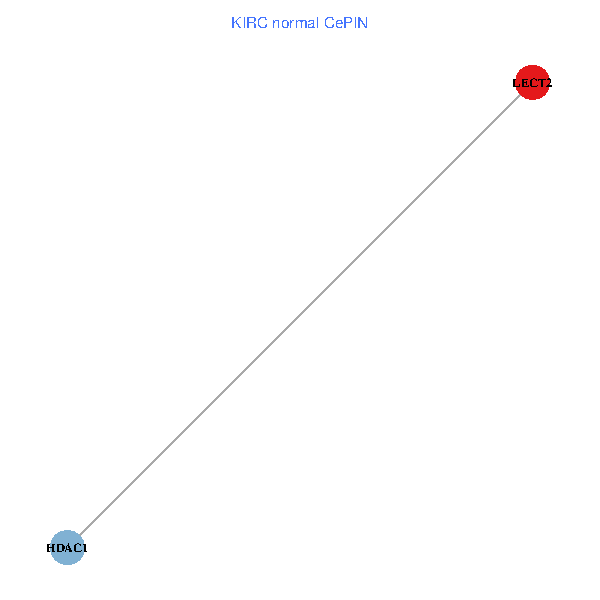
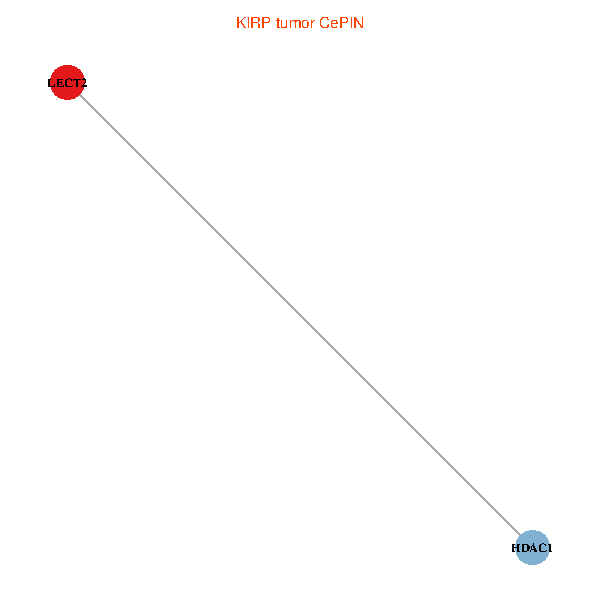
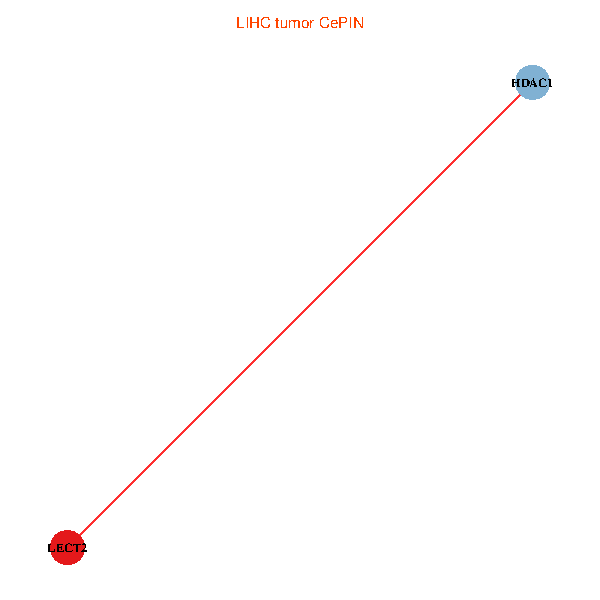
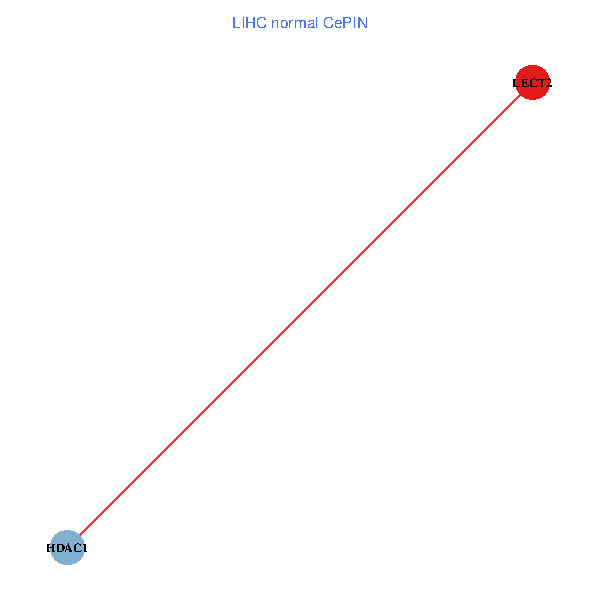
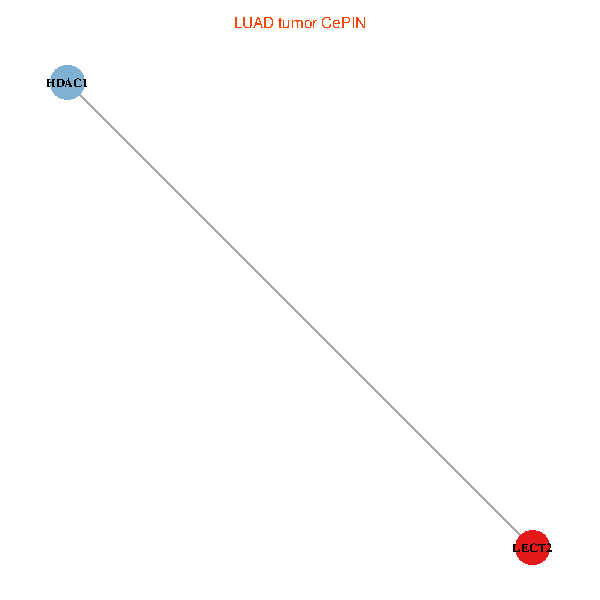
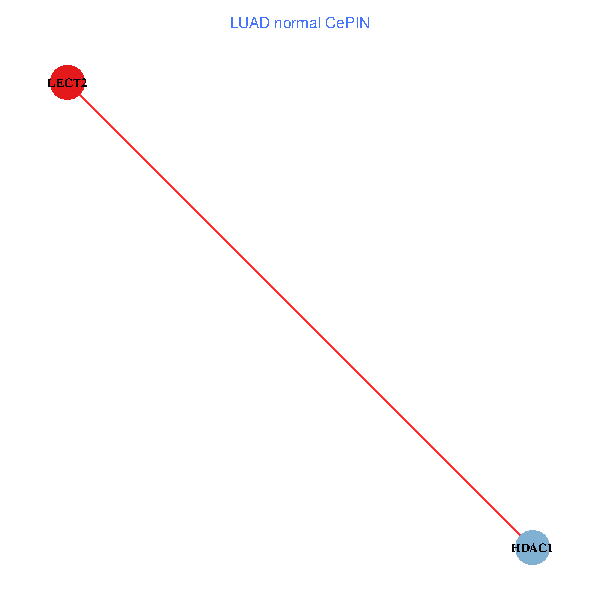
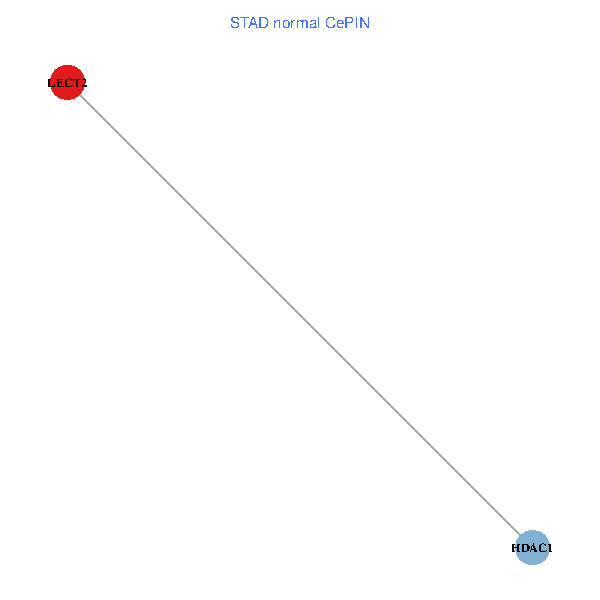
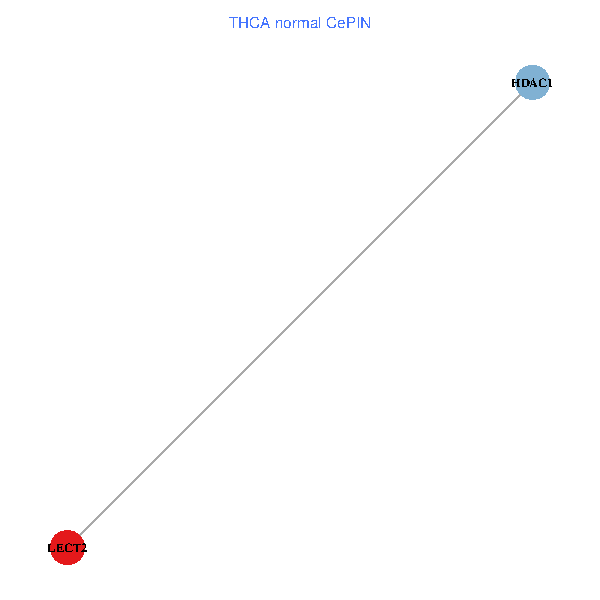
| Co-expressed gene networks based on protein-protein interaction data (CePIN) (TCGA IlluminaHiSeq_RNASeqV2, pan-cancer normalized log2(norm_counts+1) data, version 2016-08-16) (PINA2 ppi data) |
| BRCA (tumor) | BRCA (normal) |
| LECT2, HDAC1 (tumor) | LECT2, HDAC1 (normal) |
 |  |
| COAD (tumor) | COAD (normal) |
| LECT2, HDAC1 (tumor) | LECT2, HDAC1 (normal) |
 |  |
| HNSC (tumor) | HNSC (normal) |
| LECT2, HDAC1 (tumor) | LECT2, HDAC1 (normal) |
 |  |
| KICH (tumor) | KICH (normal) |
| LECT2, HDAC1 (tumor) | LECT2, HDAC1 (normal) |
 |  |
| KIRC (tumor) | KIRC (normal) |
| LECT2, HDAC1 (tumor) | LECT2, HDAC1 (normal) |
 |  |
| KIRP (tumor) | KIRP (normal) |
| LECT2, HDAC1 (tumor) | LECT2, HDAC1 (normal) |
 |  |
| LIHC (tumor) | LIHC (normal) |
| LECT2, HDAC1 (tumor) | LECT2, HDAC1 (normal) |
 |  |
| LUAD (tumor) | LUAD (normal) |
| LECT2, HDAC1 (tumor) | LECT2, HDAC1 (normal) |
 |  |
| LUSC (tumor) | LUSC (normal) |
| LECT2, HDAC1 (tumor) | LECT2, HDAC1 (normal) |
 |  |
| PRAD (tumor) | PRAD (normal) |
| LECT2, HDAC1 (tumor) | LECT2, HDAC1 (normal) |
 |  |
| STAD (tumor) | STAD (normal) |
| LECT2, HDAC1 (tumor) | LECT2, HDAC1 (normal) |
 |  |
| THCA (tumor) | THCA (normal) |
| LECT2, HDAC1 (tumor) | LECT2, HDAC1 (normal) |
 |  |
| Top |
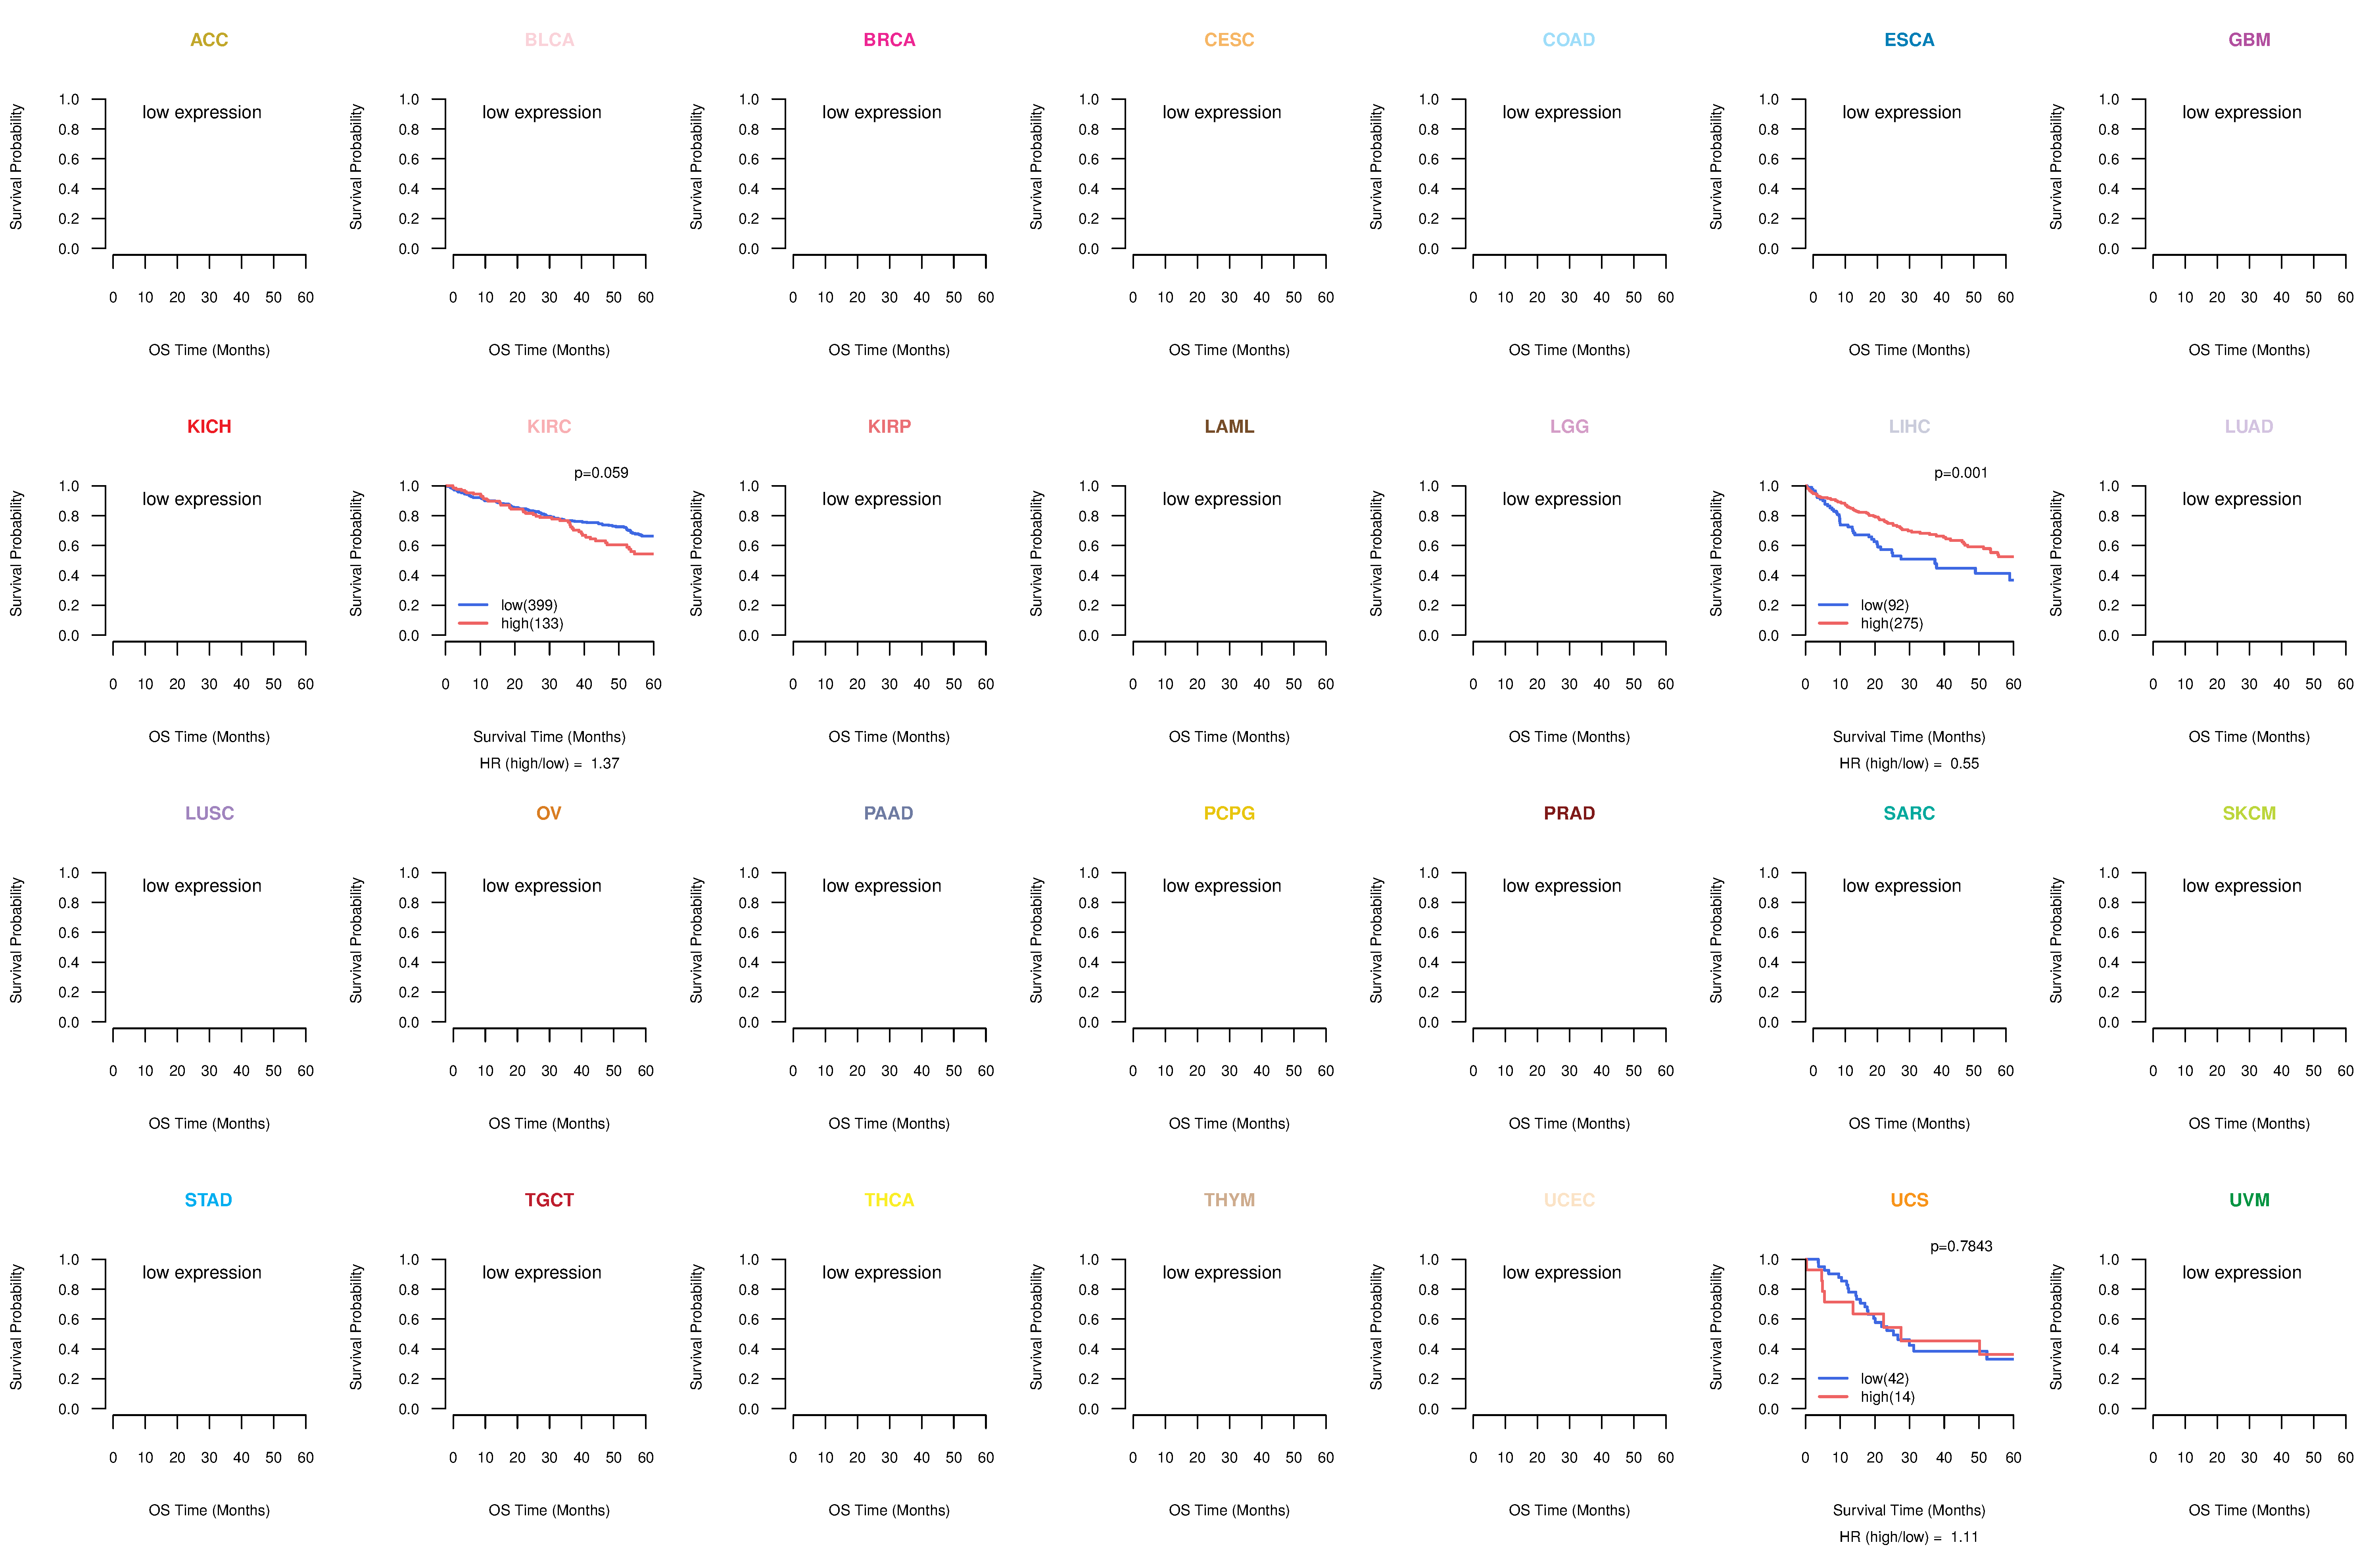
| TissGeneProg for LECT2 |
| Kaplan-Meier plots with logrank tests of overall survival (OS) using 28 cancer types (TCGA IlluminaHiSeq_RNASeqV2, pan-cancer normalized log2(norm_counts+1) data, version 2016-08-16) (TCGA clinicalMatrix, phenotype data, version 2016-04-27) * Click on the image to enlarge it in a new window. |
 |
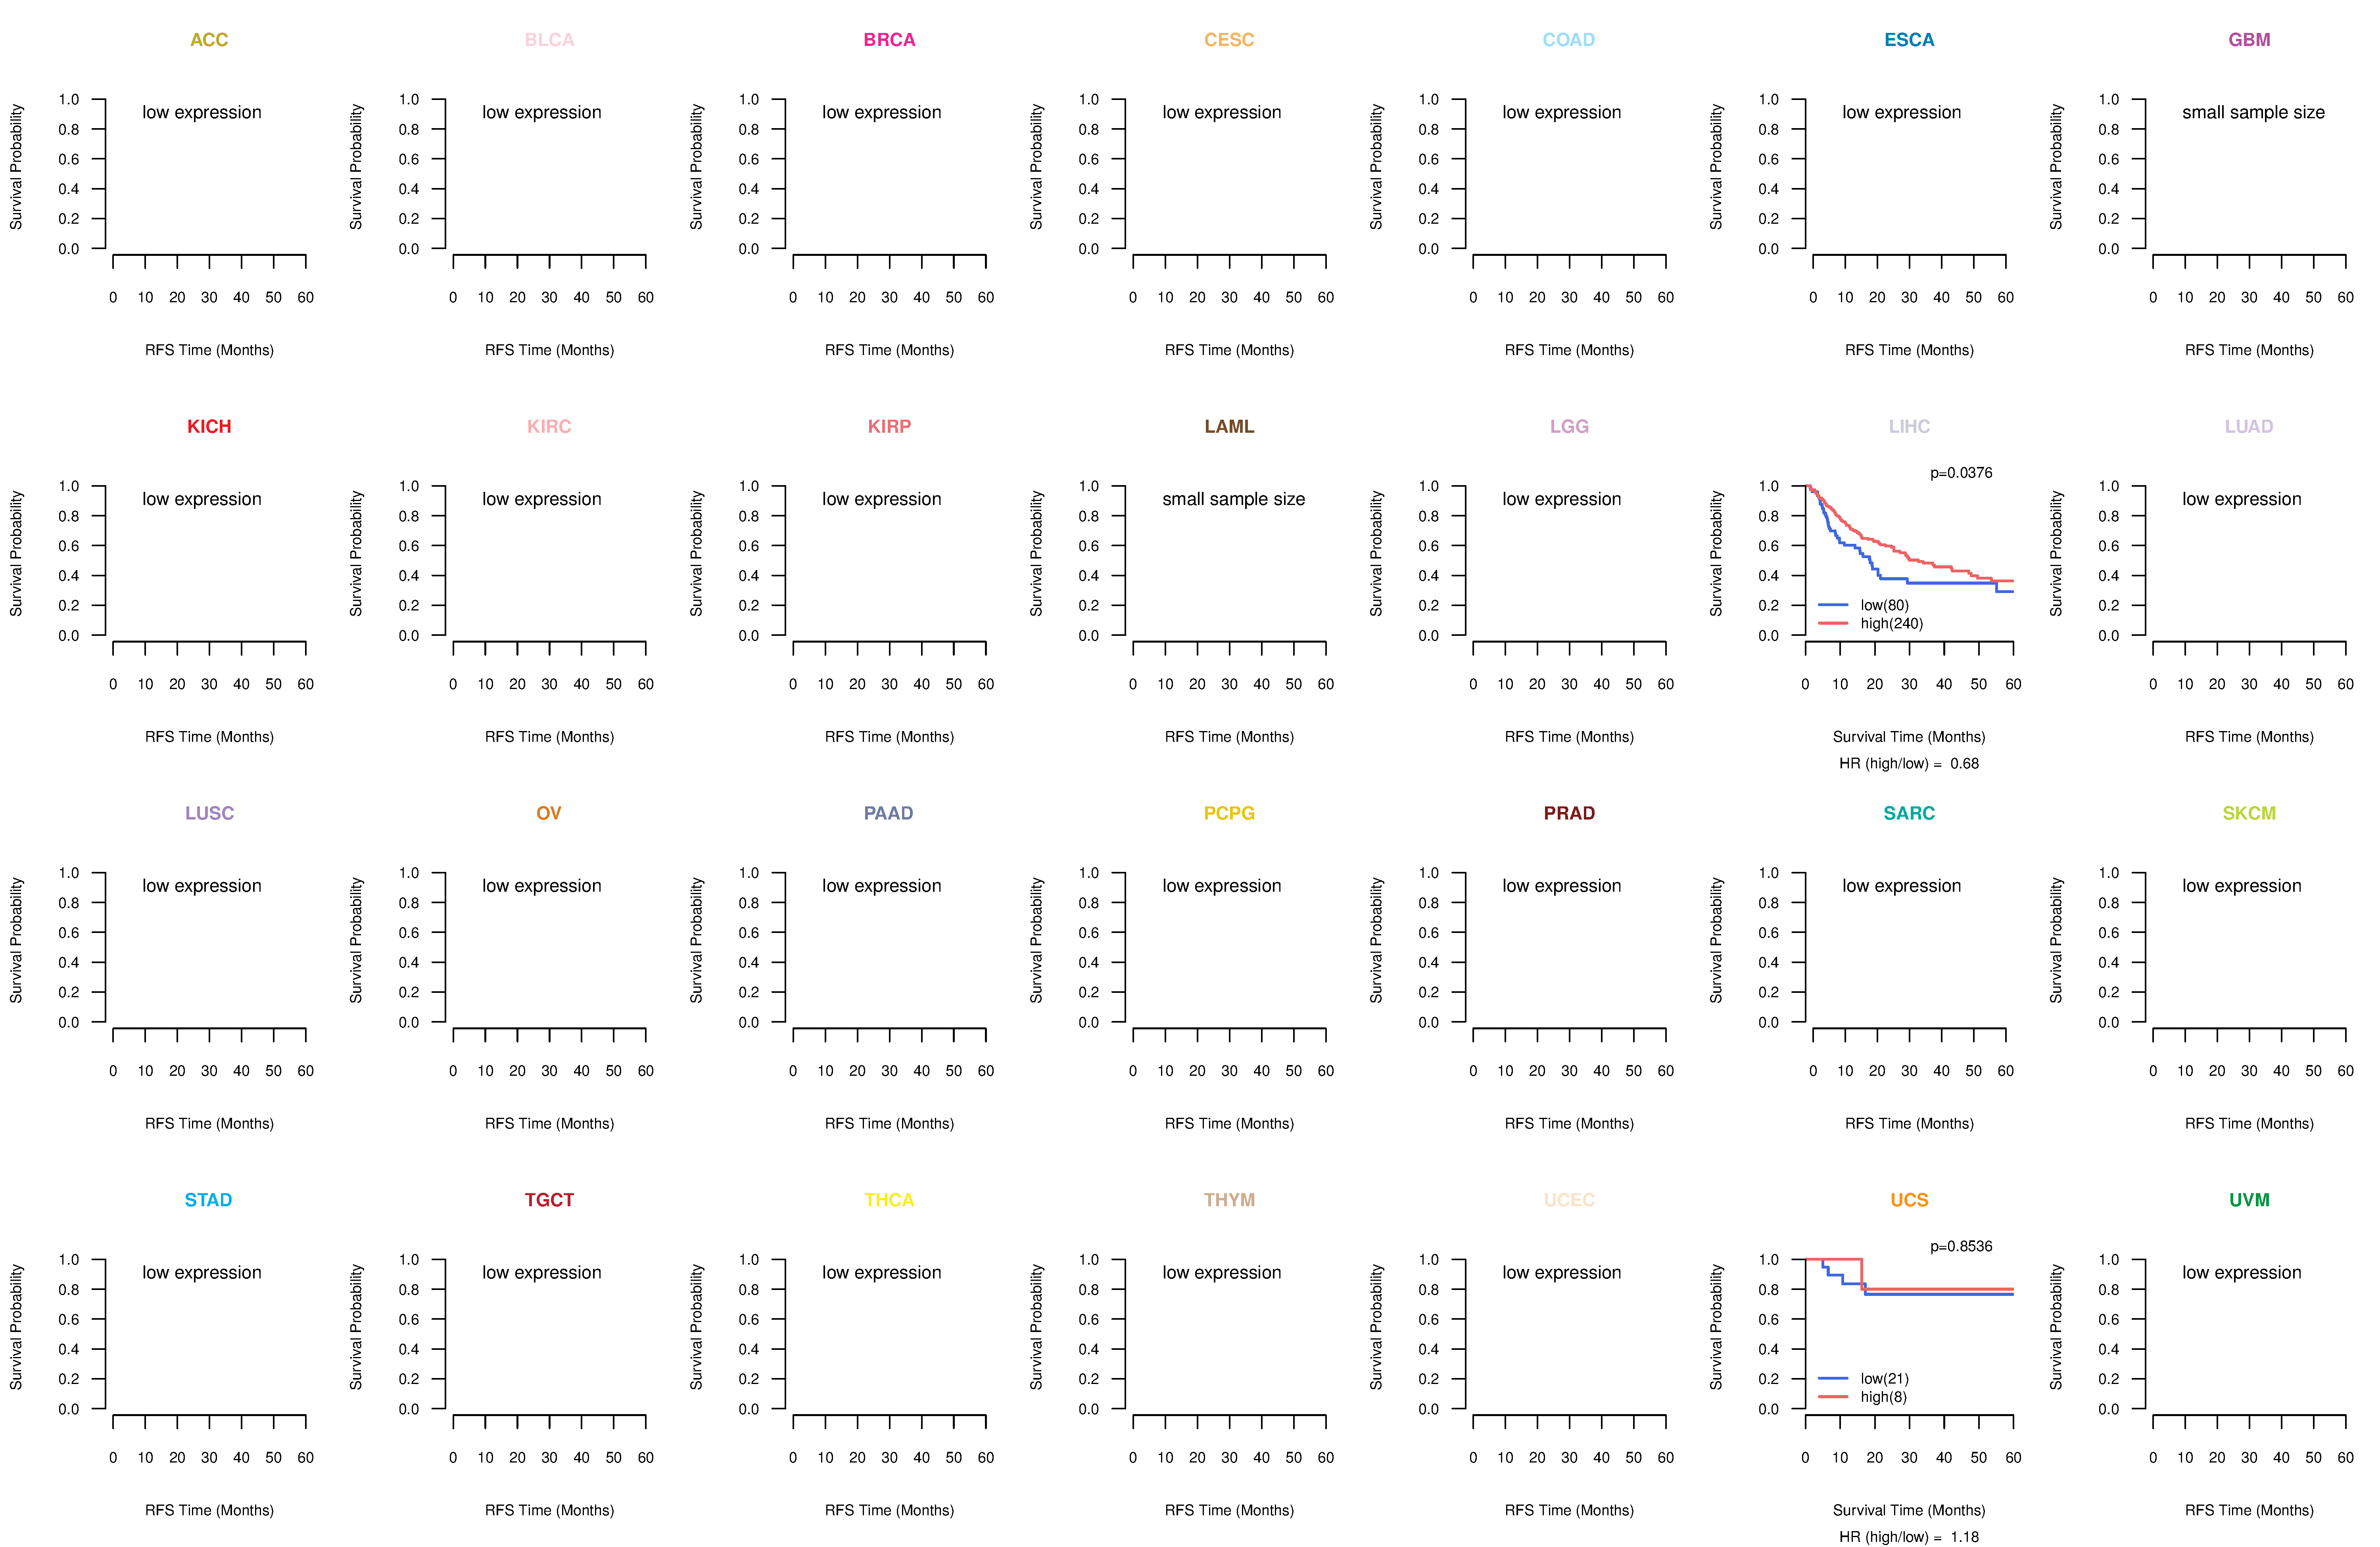
| Kaplan-Meier plots with logrank test of relapse free survival (RFS) using 28 cancer types (TCGA IlluminaHiSeq_RNASeqV2, pan-cancer normalized log2(norm_counts+1) data, version 2016-08-16) (TCGA clinicalMatrix, phenotype data, version 2016-04-27) * Click on the image enlarge it in a new window. |
 |
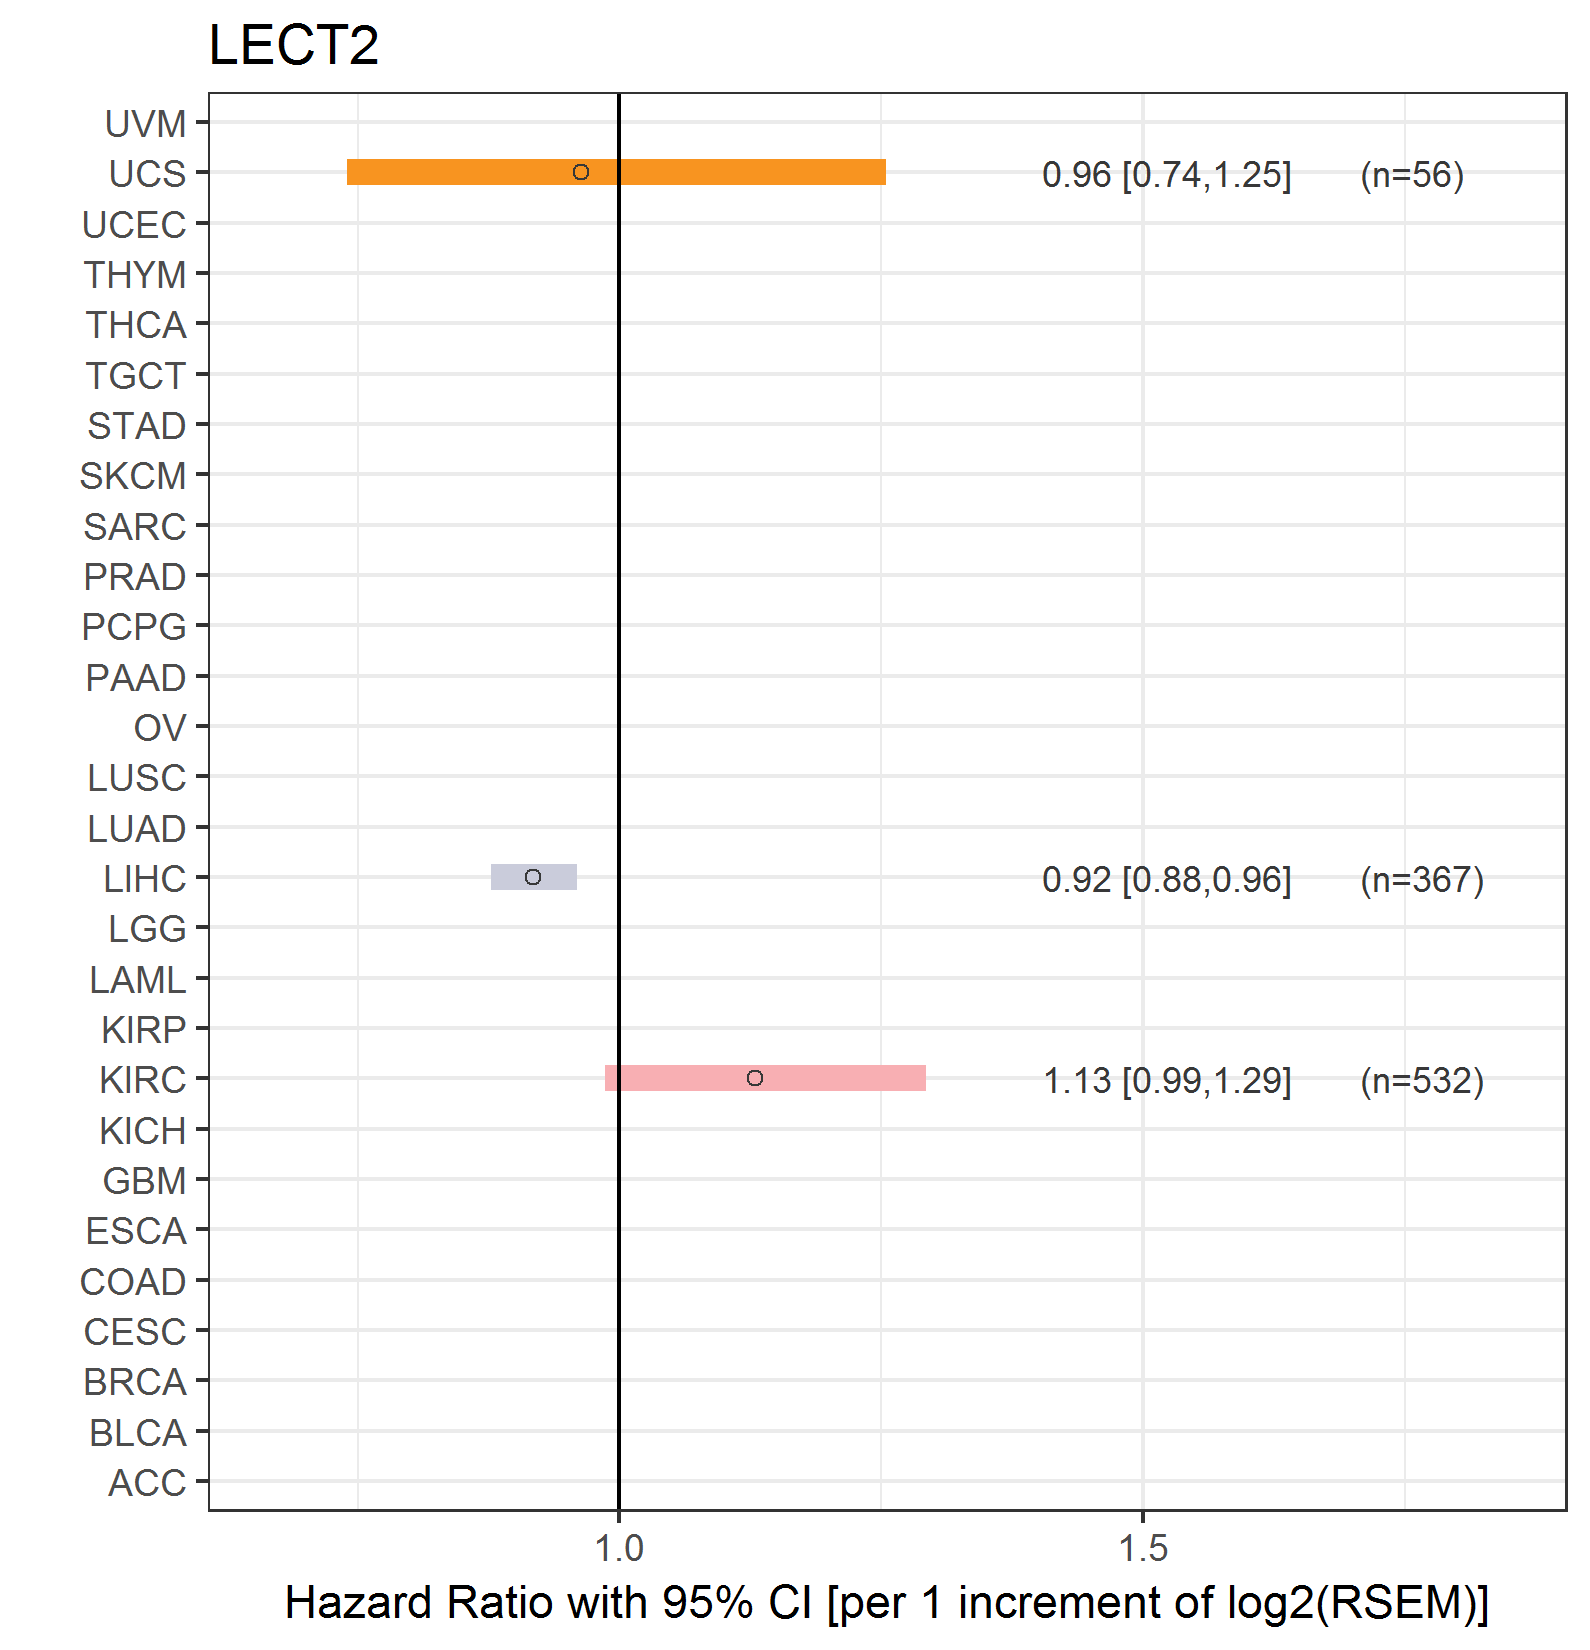
| Forest plot of Cox proportional hazard ratio (HR) and 95% CI of overall survival (OS) using 28 cancer types (TCGA IlluminaHiSeq_RNASeqV2, pan-cancer normalized log2(norm_counts+1) data, version 2016-08-16) (TCGA clinicalMatrix, phenotype data, version 2016-04-27) * Click on the image enlarge it in a new window. |
 |
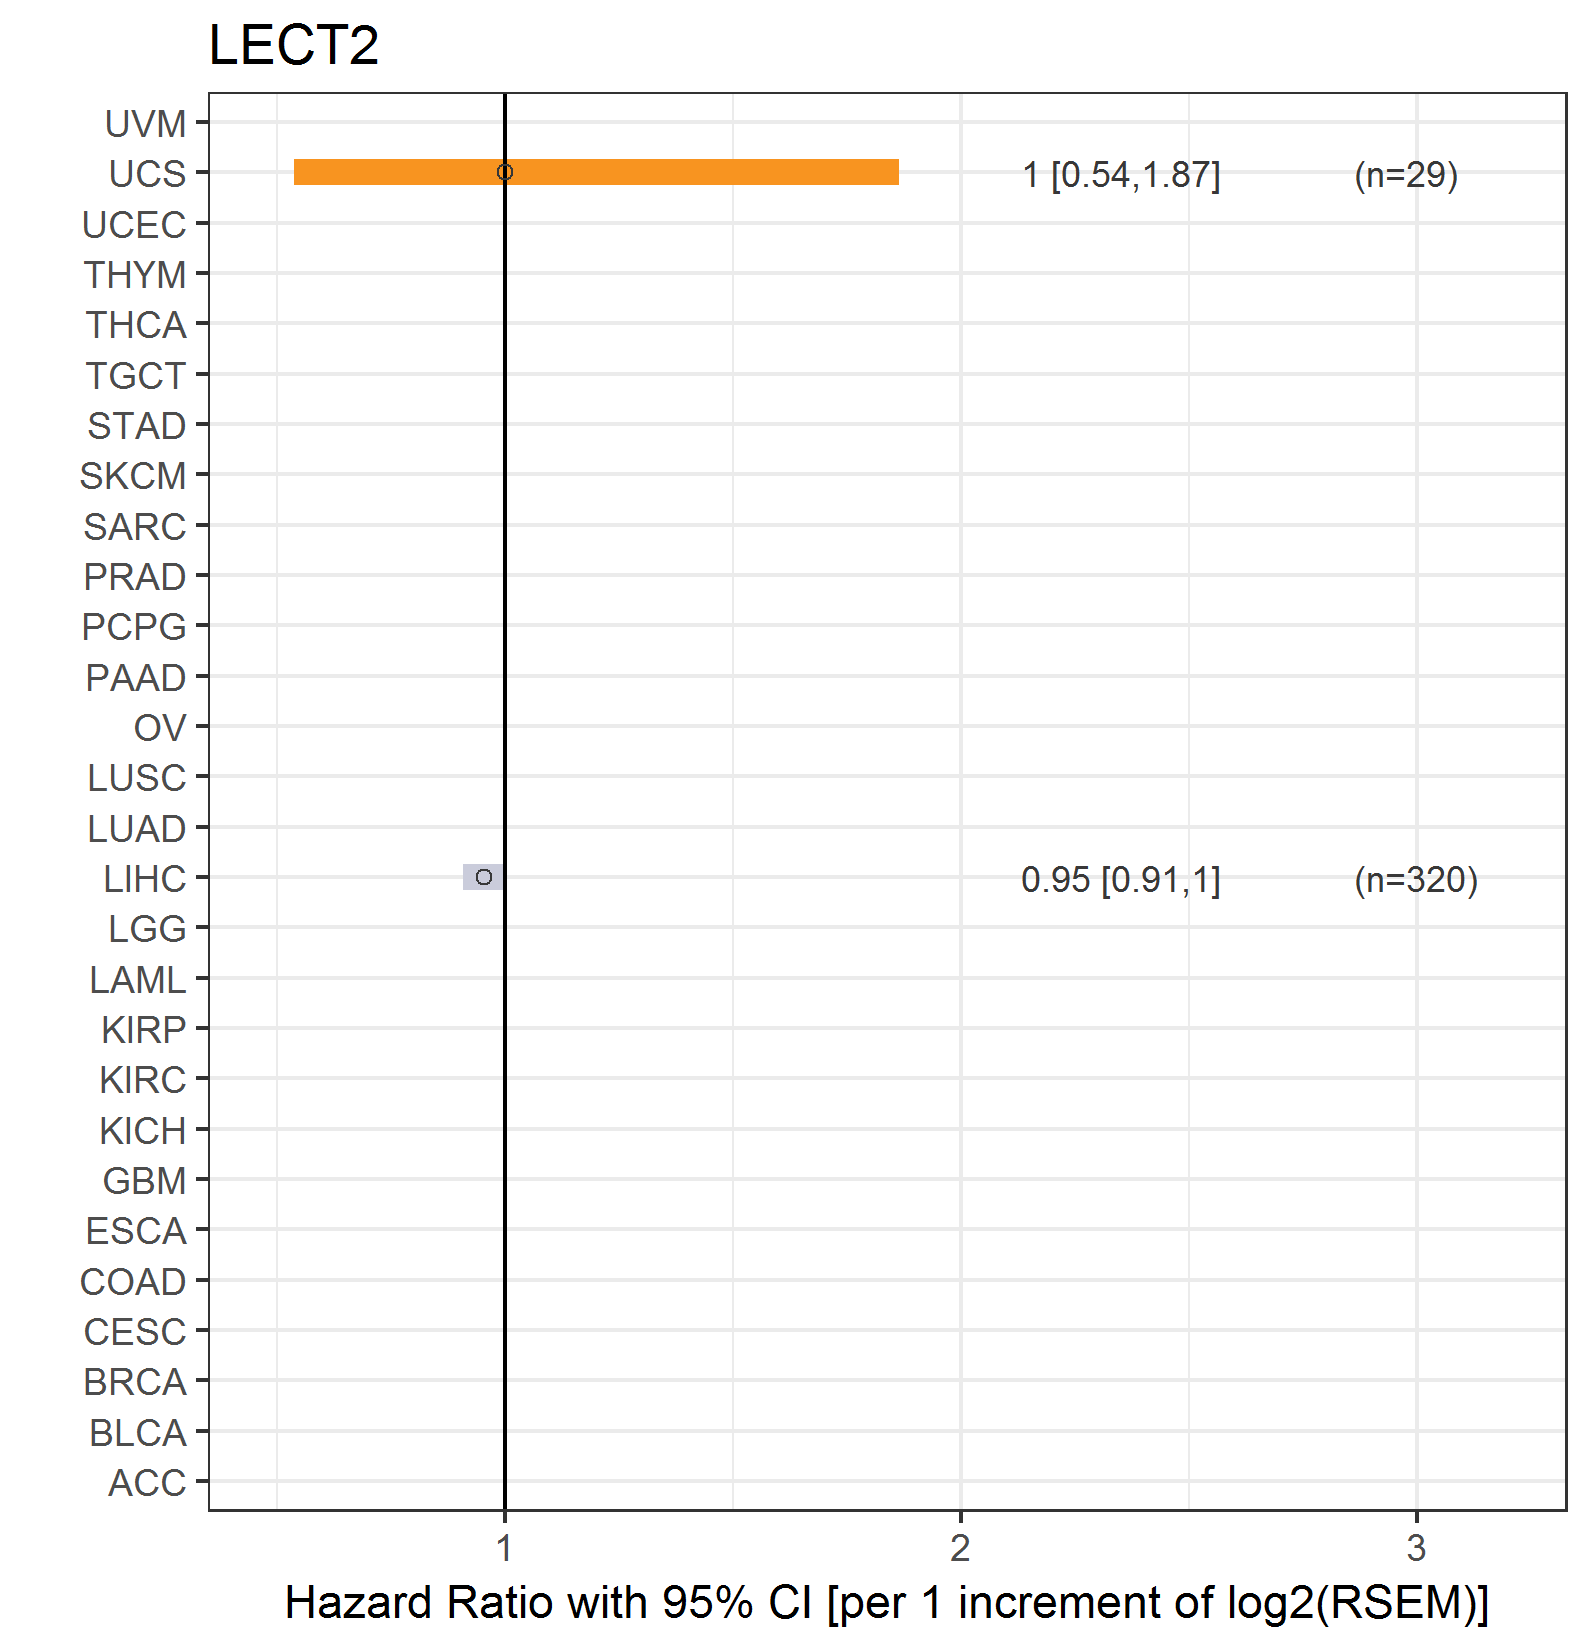
| Forest plot of Cox proportional hazard ratio (HR) and 95% CI of relapse free survival (RFS) using 28 cancer types (TCGA IlluminaHiSeq_RNASeqV2, pan-cancer normalized log2(norm_counts+1) data, version 2016-08-16) (TCGA clinicalMatrix, phenotype data, version 2016-04-27) * Click on the image enlarge it in a new window. |
 |
| Top |
| TissGeneClin for LECT2 |
| TissGeneDrug for LECT2 |
| Drug information targeting TissGene (DrugBank Version 5.0.6, 2017-04-01) |
| DrugBank ID | Drug name | Drug activity | Drug type | Drug status |
| Top |
| TissGeneDisease for LECT2 |
| Disease information associated with TissGene (DisGeNet, 2016-06-01) |
| Disease ID | Disease name | # pubmeds | Source |
| umls:C2239176 | Liver carcinoma | 3 | BeFree |
| umls:C0028754 | Obesity | 2 | BeFree |
| umls:C0002726 | Amyloidosis | 1 | BeFree |
| umls:C0003873 | Rheumatoid Arthritis | 1 | BeFree |
| umls:C0015695 | Fatty Liver | 1 | BeFree |
| umls:C0020459 | Hyperinsulinism | 1 | BeFree |
| umls:C0023290 | Leishmaniasis, Visceral | 1 | BeFree |
| umls:C0023903 | Liver neoplasms | 1 | BeFree |
| umls:C0085605 | Liver Failure | 1 | LHGDN |
| umls:C0206624 | Hepatoblastoma | 1 | BeFree |
| umls:C0268382 | Amyloid nephropathy | 1 | BeFree |
| umls:C0341439 | Chronic liver disease | 1 | BeFree |
| umls:C0400966 | Non-alcoholic Fatty Liver Disease | 1 | BeFree |
| umls:C0403447 | Chronic Kidney Insufficiency | 1 | BeFree |
| umls:C0746556 | metabolic disturbance | 1 | BeFree |
| umls:C1512409 | Hepatocarcinogenesis | 1 | BeFree |
| umls:C1561643 | Chronic Kidney Diseases | 1 | BeFree |
| umls:C1709246 | Non-Neoplastic Disorder | 1 | BeFree |
| umls:C2711227 | Steatohepatitis | 1 | BeFree |
|
Copyright 2016-Present - The University of Texas Health Science Center at Houston (UTHealth) Web File Viewing | How to Report, Fraud, Waste and Abuse | State of Texas | Statewide Search | Texas Homeland Security | Site Policies |