 |
| |
| |
| |
| |
| |
| |
|

| TissGeneSummary for LMX1B |
 Gene summary Gene summary |
| Basic gene information | Gene symbol | LMX1B |
| Gene name | LIM homeobox transcription factor 1, beta | |
| Synonyms | LMX1.2|NPS1 | |
| Cytomap | UCSC genome browser: 9q33.3 | |
| Type of gene | protein-coding | |
| RefGenes | NM_001174146.1, NM_001174147.1,NM_002316.3, | |
| Description | LIM homeobox transcription factor 1-betaLIM/homeobox protein 1.2LIM/homeobox protein LMX1BLMX-1.2 | |
| Modification date | 20141219 | |
| dbXrefs | MIM : 602575 | |
| HGNC : HGNC | ||
| Ensembl : ENSG00000136944 | ||
| HPRD : 03986 | ||
| Protein | UniProt: go to UniProt's Cross Reference DB Table | |
| Expression | CleanEX: HS_LMX1B | |
| BioGPS: 4010 | ||
| Pathway | NCI Pathway Interaction Database: LMX1B | |
| KEGG: LMX1B | ||
| REACTOME: LMX1B | ||
| Pathway Commons: LMX1B | ||
| Context | iHOP: LMX1B | |
| ligand binding site mutation search in PubMed: LMX1B | ||
| UCL Cancer Institute: LMX1B | ||
| Assigned class in TissGDB* | C | |
| Included tissue-specific gene expression resources | TiGER,GTEx | |
| Specific-tissues in normal samples (assigned by TissGDB using HPA, TiGER, and GTEx) | BreastOvary | |
| Cancer types related to the specific-tissues in cancer samples (assigned by TissGDB using TCGA) | BRCAOV | |
| Reference showing the relevant tissue of LMX1B | ||
| Description by TissGene annotations | ||
| * Class A consists of genes with literature evidence and is part of the cTissGenes. Class B consists of only cTissGenes without additional evidence. The remaining genes belong to Class C. |
| Gene ontology having evidence of Inferred from Direct Assay (IDA) from Entrez |
| GO ID | GO term | PubMed ID | GO:0006355 | regulation of transcription, DNA-templated | 10767331 | GO:0006355 | regulation of transcription, DNA-templated | 10767331 |
| Top |
| TissGeneExp for LMX1B |
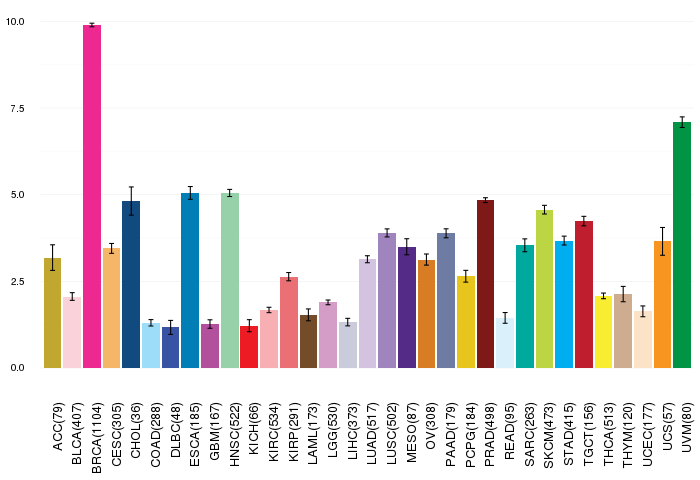
| Gene expressions across 28 cancer types (X-axis: cancer type and Y-axis: log2(norm_counts+1)) (TCGA IlluminaHiSeq_RNASeqV2, pan-cancer normalized log2(norm_counts+1) data, version 2016-08-16) |
 |
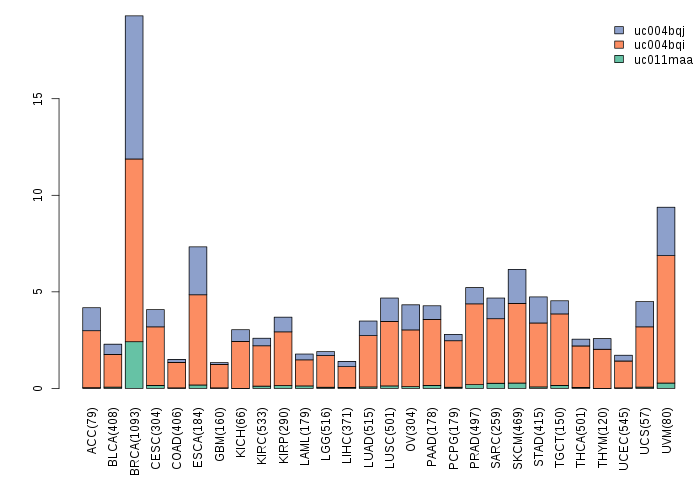
| Gene isoform expressions across 28 cancer types (X-axis: cancer type and Y-axis: log2(norm_counts+1)) (TCGA pan-cancer tcga_rsem_isoform_tpm, version 2016-09-01) |
 |
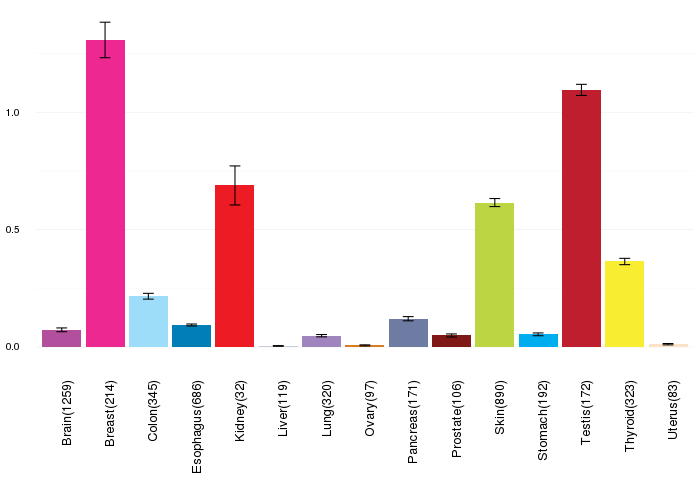
| Gene expressions across normal tissues of GTEx data (GTEx GTEx_Analysis_v6_RNA-seq_RNA-SeQCv1.1.8_gene_rpkm.gct) - Here, we shows the matched tissue types only among our 28 cancer types. |
 |
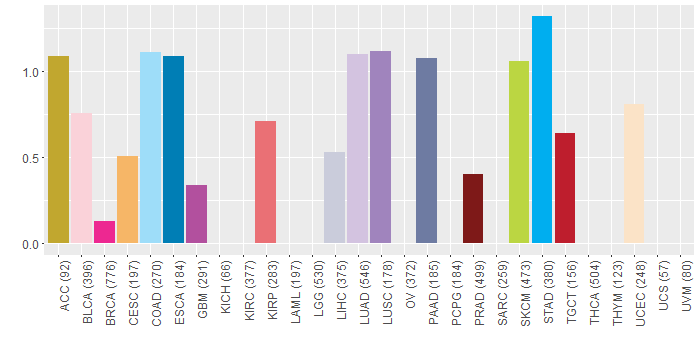
| Different expressions across 14 cancer types with more than 10 samples between matched tumors and normals (X-axis: cancer type and Y-axis: log2(norm_counts+1)) (TCGA IlluminaHiSeq_RNASeqV2, pan-cancer normalized log2(norm_counts+1) data, version 2016-08-16) |
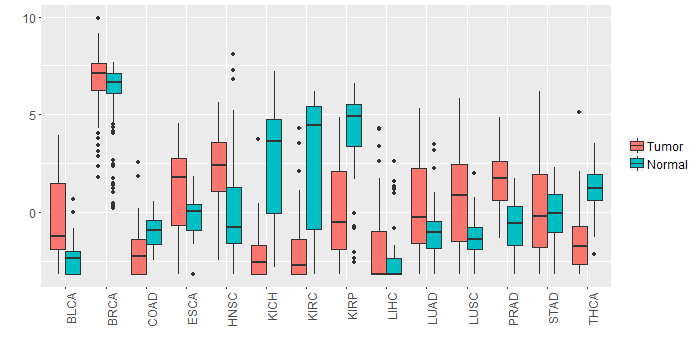 |
| - Significantly differentially expressed cancer types and information. (|Fold change|>1 and FDR<0.05) |
| Cancer type | Mean(exp) in tumor | Mean(exp) in matched normal | Log2FC | P-val. | FDR |
| THCA | -1.464749471 | 1.210899682 | -2.675649153 | 4.62E-17 | 8.67E-16 |
| KICH | -1.994921539 | 2.393474461 | -4.388396 | 1.46E-07 | 6.55E-07 |
| LUSC | 0.543200579 | -1.373940598 | 1.917141176 | 1.62E-06 | 3.94E-06 |
| KIRP | 0.029315836 | 3.737740836 | -3.708425 | 4.21E-07 | 2.31E-06 |
| PRAD | 1.685027615 | -0.768747385 | 2.453775 | 1.15E-15 | 1.61E-13 |
| KIRC | -2.067572705 | 2.812342572 | -4.879915278 | 1.24E-20 | 1.04E-19 |
| BLCA | -0.308377749 | -2.20584617 | 1.897468421 | 0.0029 | 0.017431351 |
| LUAD | 0.17654784 | -0.882964228 | 1.059512069 | 0.00376 | 0.007346411 |
| HNSC | 2.258878554 | 0.288887857 | 1.969990698 | 0.000353 | 0.001369397 |
| Top |
| TissGene-miRNA for LMX1B |
| Significantly anti-correlated miRNAs of TissGene across 28 cancer types (Gene-miRNA relations from TargetScanHuman Relsease 7.1, Conserved_Site_Context_Scores.txt.zip, 06.01.2016) (TCGA IlluminaHiSeq_miRNASeq, log2(RPM+1) data, version 2016-11-21) (TCGA IlluminaHiSeq_RNASeqV2, log2(normalized_count+1) data, version 2016-08-16) (Spearman’s Rank Correlation (p-value<0.05 and coefficient<-0.25)) |
| Cancer type | miRNA id | miRNA accession | P-val. | Coeff. | # samples |
| Top |
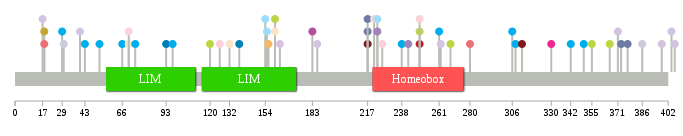
| TissGeneMut for LMX1B |
| TissGeneSNV for LMX1B |
| nsSNV counts per each loci. Different colors of circles represent different cancer types. Circle size denotes number of samples. (TCGA somatic mutation (SNPs and small INDELs) data, version 2016-04-25) * Click on the image to enlarge it in a new window. |
 |
 |
| Somatic nucleotide variants of TissGene across 28 cancer types (X-axis: cancer type and Y-axis: % of mutated samples) The numbers in parentheses are numbers of samples with mutation (nsSNVs). (TCGA somatic mutation (SNPs and small INDELs) data, version 2016-04-25) |
 |
| - nsSNVs sorted by frequency. |
| AAchange | Cancer type | # samples |
| p.R249Q | SKCM | 1 |
| p.E11D | HNSC | 1 |
| p.R70P | BLCA | 1 |
| p.Q18K | KIRP | 1 |
| p.L138P | ESCA | 1 |
| p.S306N | STAD | 1 |
| p.R312H | PRAD | 1 |
| p.E132K | UCEC | 1 |
| p.R74W | STAD | 1 |
| p.R223Q | COAD | 1 |
| p.Q268* | SKCM | 1 |
| p.S406C | LUAD | 1 |
| p.F404V | LUAD | 1 |
| p.R238H | STAD | 1 |
| p.E155K | COAD | 1 |
| p.R249L | TGCT | 1 |
| p.A40D | LUAD | 1 |
| p.R221L | BLCA | 1 |
| p.R226P | BLCA | 1 |
| p.R249P | BLCA | 1 |
| p.H29Y | STAD | 1 |
| p.E183G | GBM | 1 |
| p.R223G | LUSC | 1 |
| p.L373F | PAAD | 1 |
| p.F156C | CESC | 1 |
| p.R261H | STAD | 1 |
| p.S186C | LUAD | 1 |
| p.D342N | STAD | 1 |
| p.S93I | ESCA | 1 |
| p.V262A | LUAD | 1 |
| p.E160G | UCEC | 1 |
| p.E120K | SKCM | 1 |
| p.Q18K | ACC | 1 |
| p.R217Q | PAAD | 1 |
| p.D355N | SKCM | 1 |
| p.D308N | STAD | 1 |
| p.R97W | STAD | 1 |
| p.M30T | LIHC | 1 |
| p.Q386K | LIHC | 1 |
| p.A17D | LUAD | 1 |
| p.D330N | BRCA | 1 |
| p.L350I | STAD | 1 |
| p.H52Y | STAD | 1 |
| p.S70N | UCEC | 1 |
| p.S371F | LUAD | 1 |
| p.S163C | LUAD | 1 |
| p.D154N | COAD | 1 |
| p.R280P | KIRP | 1 |
| p.D366N | SKCM | 1 |
| p.R43L | STAD | 1 |
| p.S242W | LUSC | 1 |
| p.L377F | PAAD | 1 |
| p.R217W | PRAD | 1 |
| p.R66L | STAD | 1 |
| p.S398F | LUAD | 1 |
| p.E160K | SKCM | 1 |
| p.E126* | BLCA | 1 |
| p.R217W | PAAD | 1 |
| Top |
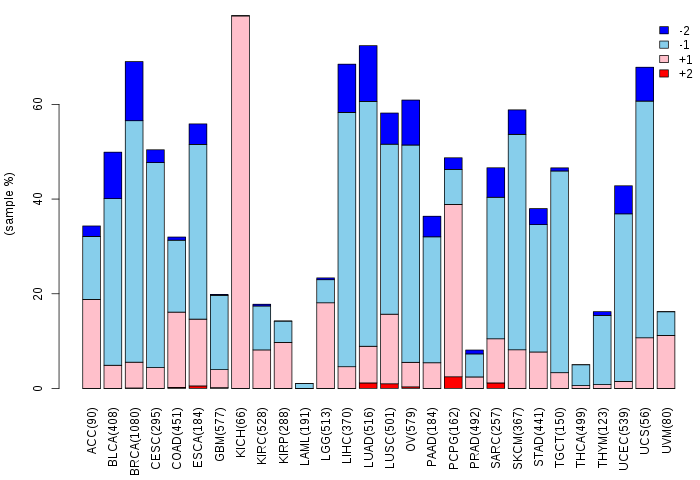
| TissGeneCNV for LMX1B |
| Copy number variations of TissGene across 28 cancer types (X-axis: cancer type and Y-axis: % of CNV samples) (TCGA Gistic2_CopyNumber_Gistic2_all_data_by_genes, Gistic2 copy number data, version 2016-08-16) |
 |
| Top |
| TissGeneFusions for LMX1B |
| Fusion genes including TissGene (ChimerDB 3.0, 2016-12-01 and TCGA fusion Portal 2015-12-01) |
| Database | Src | Cancer type | Sample | Fusion gene | ORF | 5'-gene BP | 3'-gene BP |
| Chimerdb3.0 | FusionScan | BRCA | TCGA-BH-A0BP-01A | GTF3C4-LMX1B | In-Frame | chr9:135559080 | chr9:129453114 |
| Top |
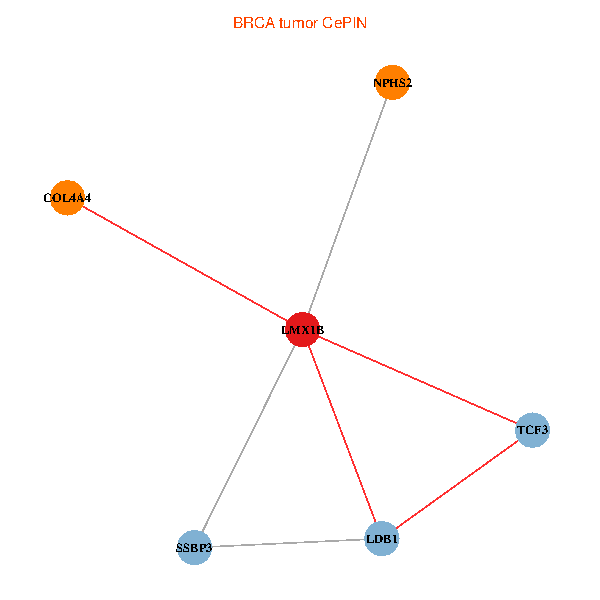
| TissGeneNet for LMX1B |
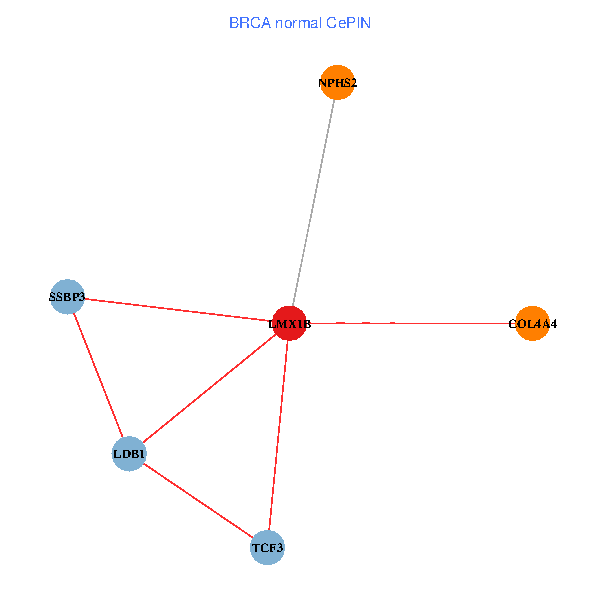
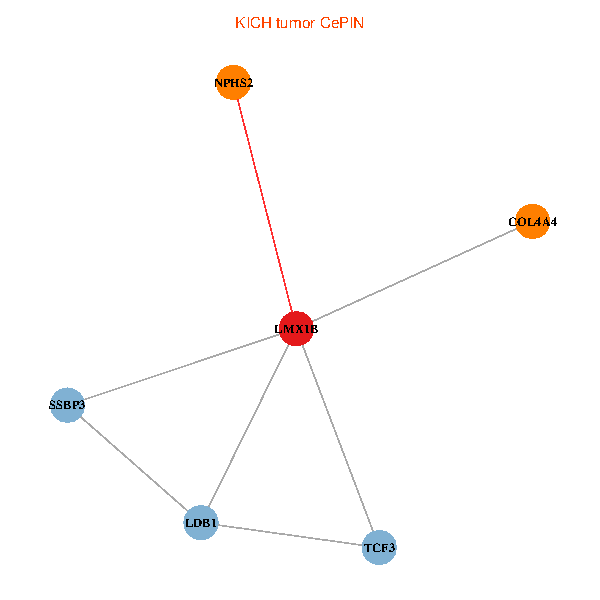
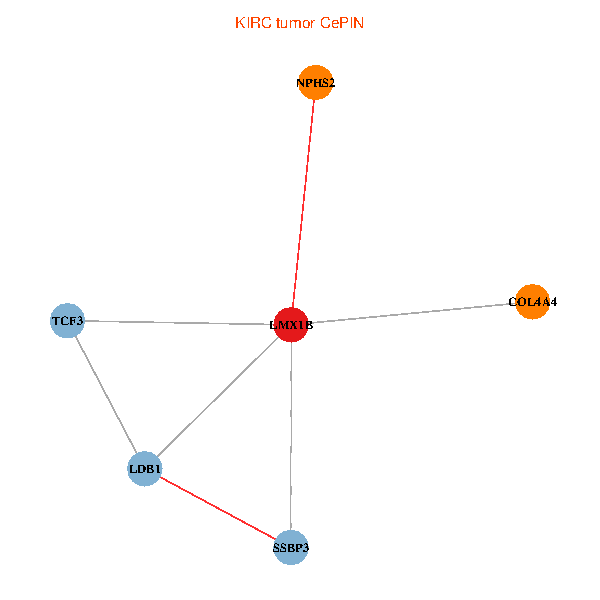
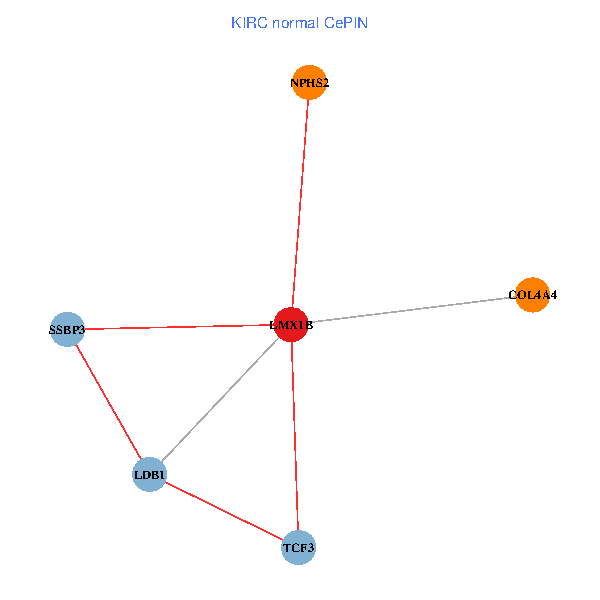
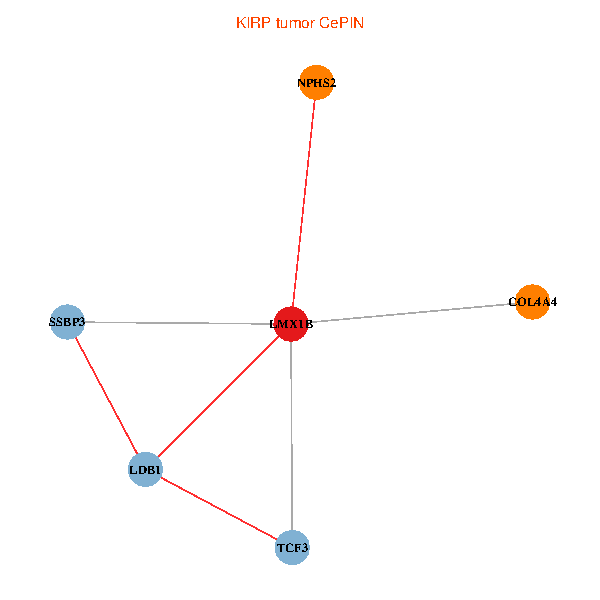
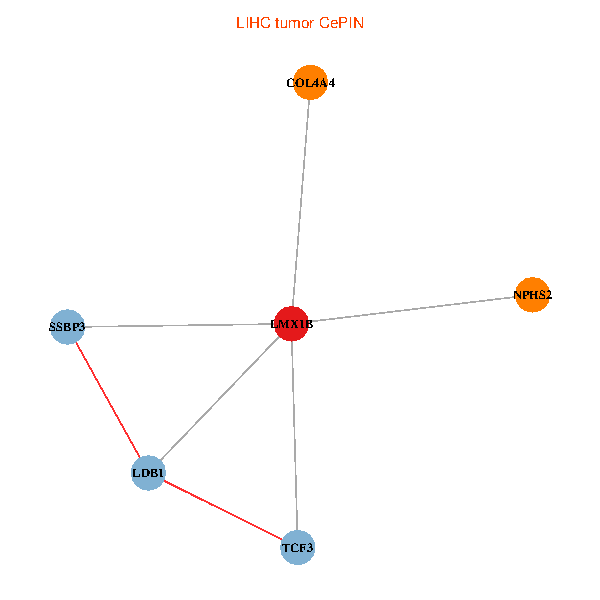
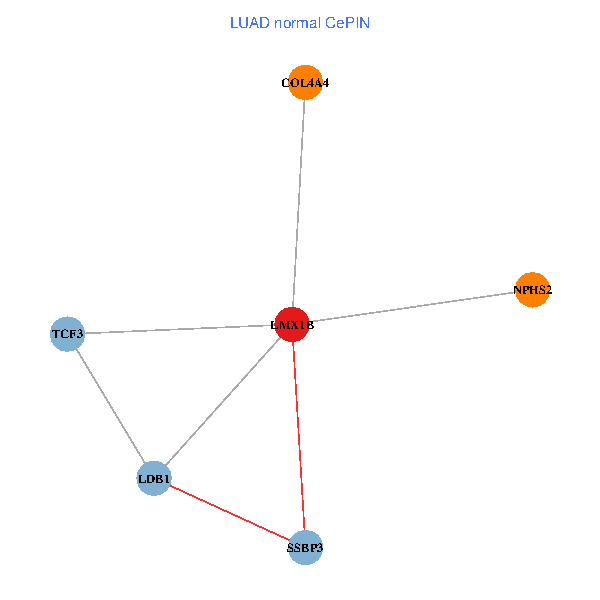
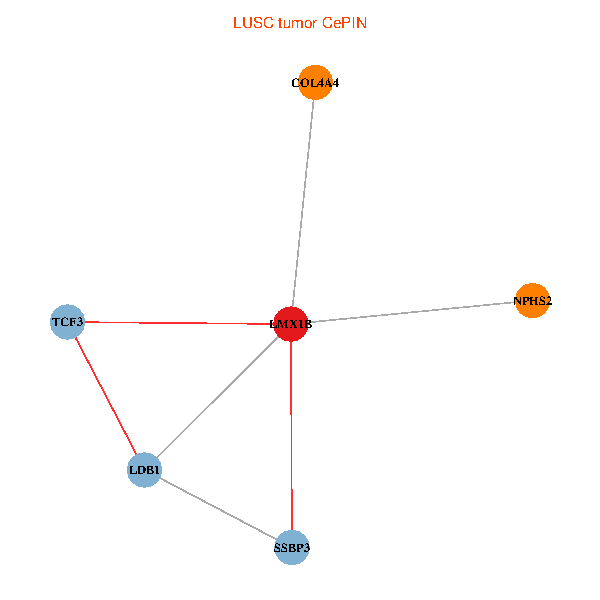
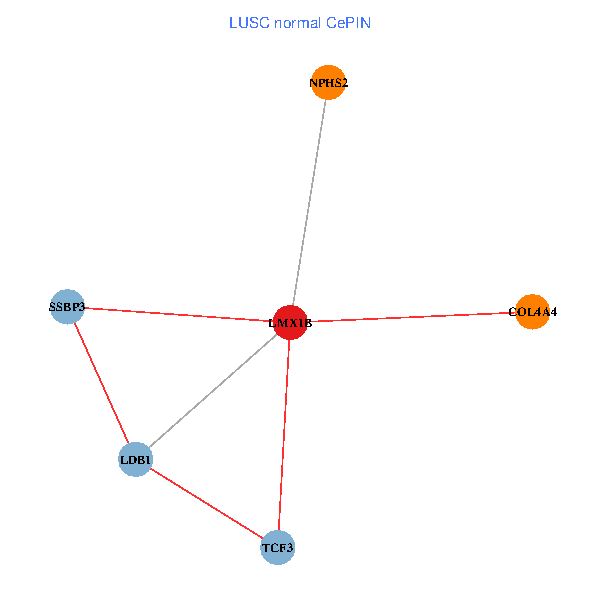
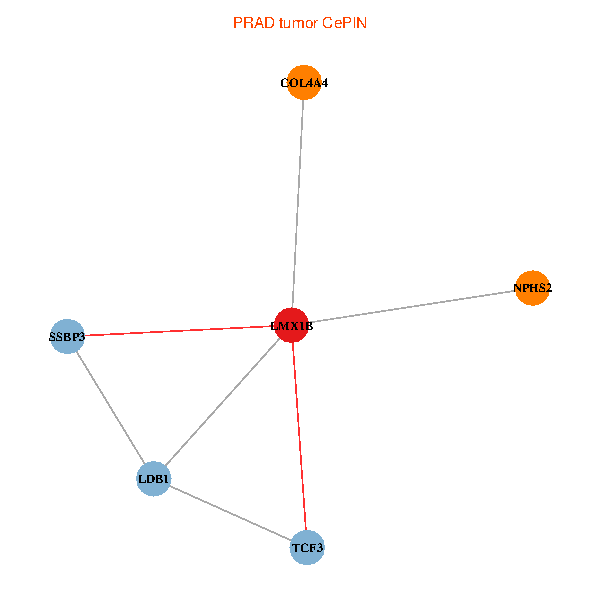
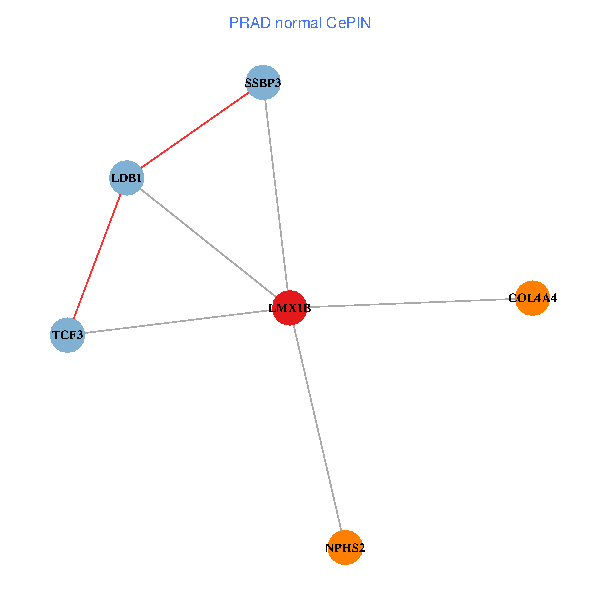
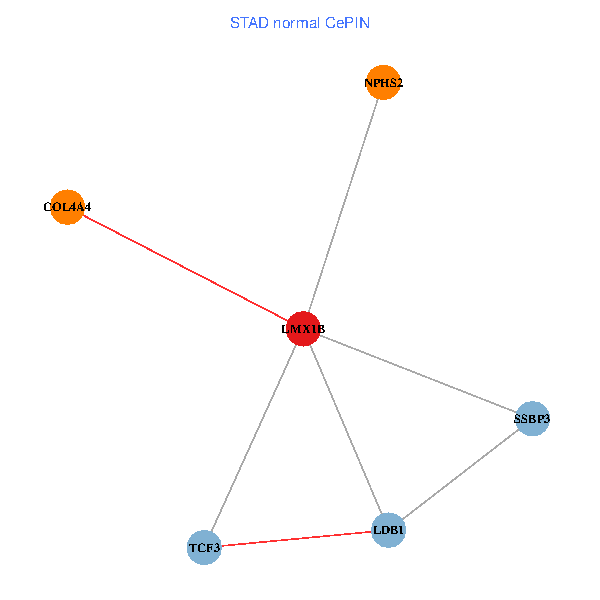
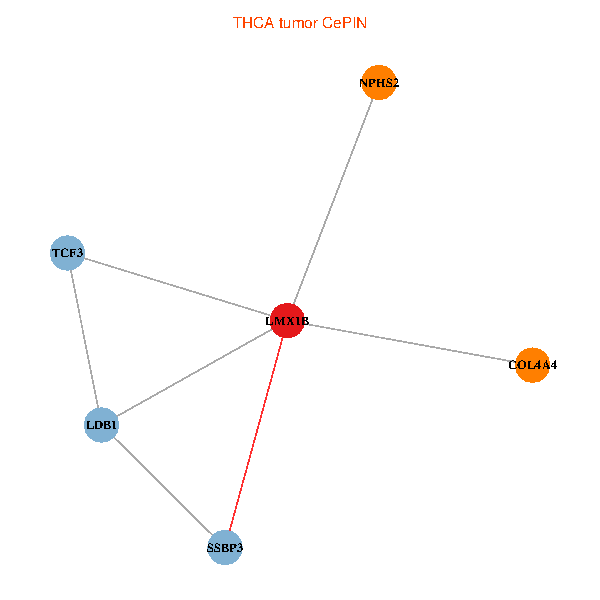
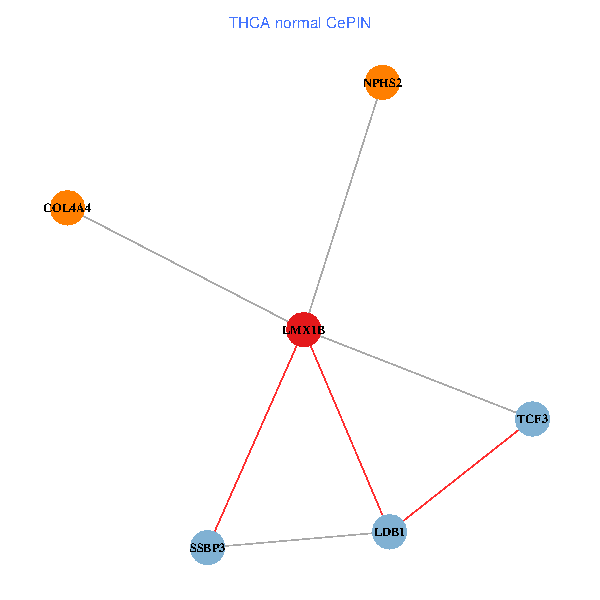
| Co-expressed gene networks based on protein-protein interaction data (CePIN) (TCGA IlluminaHiSeq_RNASeqV2, pan-cancer normalized log2(norm_counts+1) data, version 2016-08-16) (PINA2 ppi data) |
| BRCA (tumor) | BRCA (normal) |
| LMX1B, LDB1, TCF3, NPHS2, COL4A4, SSBP3 (tumor) | LMX1B, LDB1, TCF3, NPHS2, COL4A4, SSBP3 (normal) |
 |  |
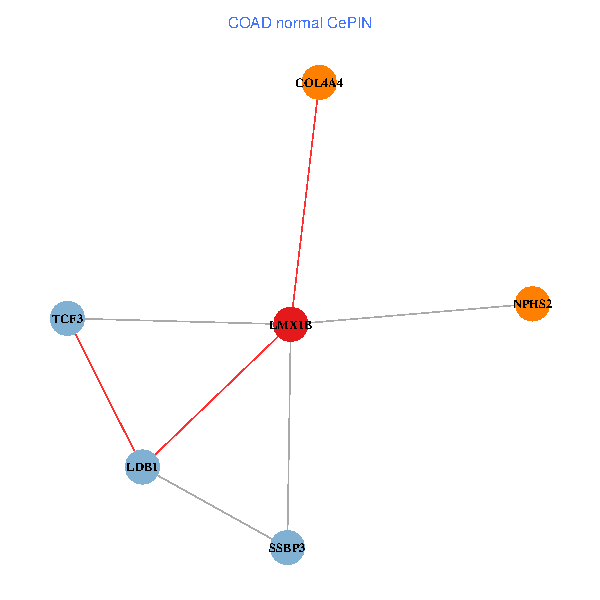
| COAD (tumor) | COAD (normal) |
| LMX1B, LDB1, TCF3, NPHS2, COL4A4, SSBP3 (tumor) | LMX1B, LDB1, TCF3, NPHS2, COL4A4, SSBP3 (normal) |
 |  |
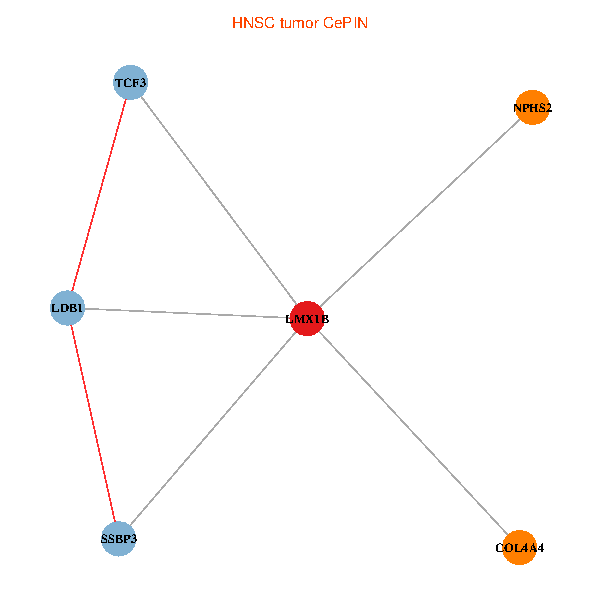
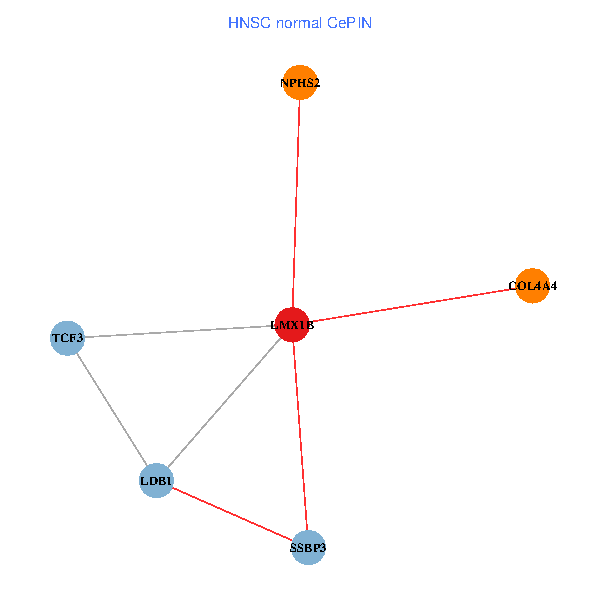
| HNSC (tumor) | HNSC (normal) |
| LMX1B, LDB1, TCF3, NPHS2, COL4A4, SSBP3 (tumor) | LMX1B, LDB1, TCF3, NPHS2, COL4A4, SSBP3 (normal) |
 |  |
| KICH (tumor) | KICH (normal) |
| LMX1B, LDB1, TCF3, NPHS2, COL4A4, SSBP3 (tumor) | LMX1B, LDB1, TCF3, NPHS2, COL4A4, SSBP3 (normal) |
 |  |
| KIRC (tumor) | KIRC (normal) |
| LMX1B, LDB1, TCF3, NPHS2, COL4A4, SSBP3 (tumor) | LMX1B, LDB1, TCF3, NPHS2, COL4A4, SSBP3 (normal) |
 |  |
| KIRP (tumor) | KIRP (normal) |
| LMX1B, LDB1, TCF3, NPHS2, COL4A4, SSBP3 (tumor) | LMX1B, LDB1, TCF3, NPHS2, COL4A4, SSBP3 (normal) |
 |  |
| LIHC (tumor) | LIHC (normal) |
| LMX1B, LDB1, TCF3, NPHS2, COL4A4, SSBP3 (tumor) | LMX1B, LDB1, TCF3, NPHS2, COL4A4, SSBP3 (normal) |
 |  |
| LUAD (tumor) | LUAD (normal) |
| LMX1B, LDB1, TCF3, NPHS2, COL4A4, SSBP3 (tumor) | LMX1B, LDB1, TCF3, NPHS2, COL4A4, SSBP3 (normal) |
 |  |
| LUSC (tumor) | LUSC (normal) |
| LMX1B, LDB1, TCF3, NPHS2, COL4A4, SSBP3 (tumor) | LMX1B, LDB1, TCF3, NPHS2, COL4A4, SSBP3 (normal) |
 |  |
| PRAD (tumor) | PRAD (normal) |
| LMX1B, LDB1, TCF3, NPHS2, COL4A4, SSBP3 (tumor) | LMX1B, LDB1, TCF3, NPHS2, COL4A4, SSBP3 (normal) |
 |  |
| STAD (tumor) | STAD (normal) |
| LMX1B, LDB1, TCF3, NPHS2, COL4A4, SSBP3 (tumor) | LMX1B, LDB1, TCF3, NPHS2, COL4A4, SSBP3 (normal) |
 |  |
| THCA (tumor) | THCA (normal) |
| LMX1B, LDB1, TCF3, NPHS2, COL4A4, SSBP3 (tumor) | LMX1B, LDB1, TCF3, NPHS2, COL4A4, SSBP3 (normal) |
 |  |
| Top |
| TissGeneProg for LMX1B |
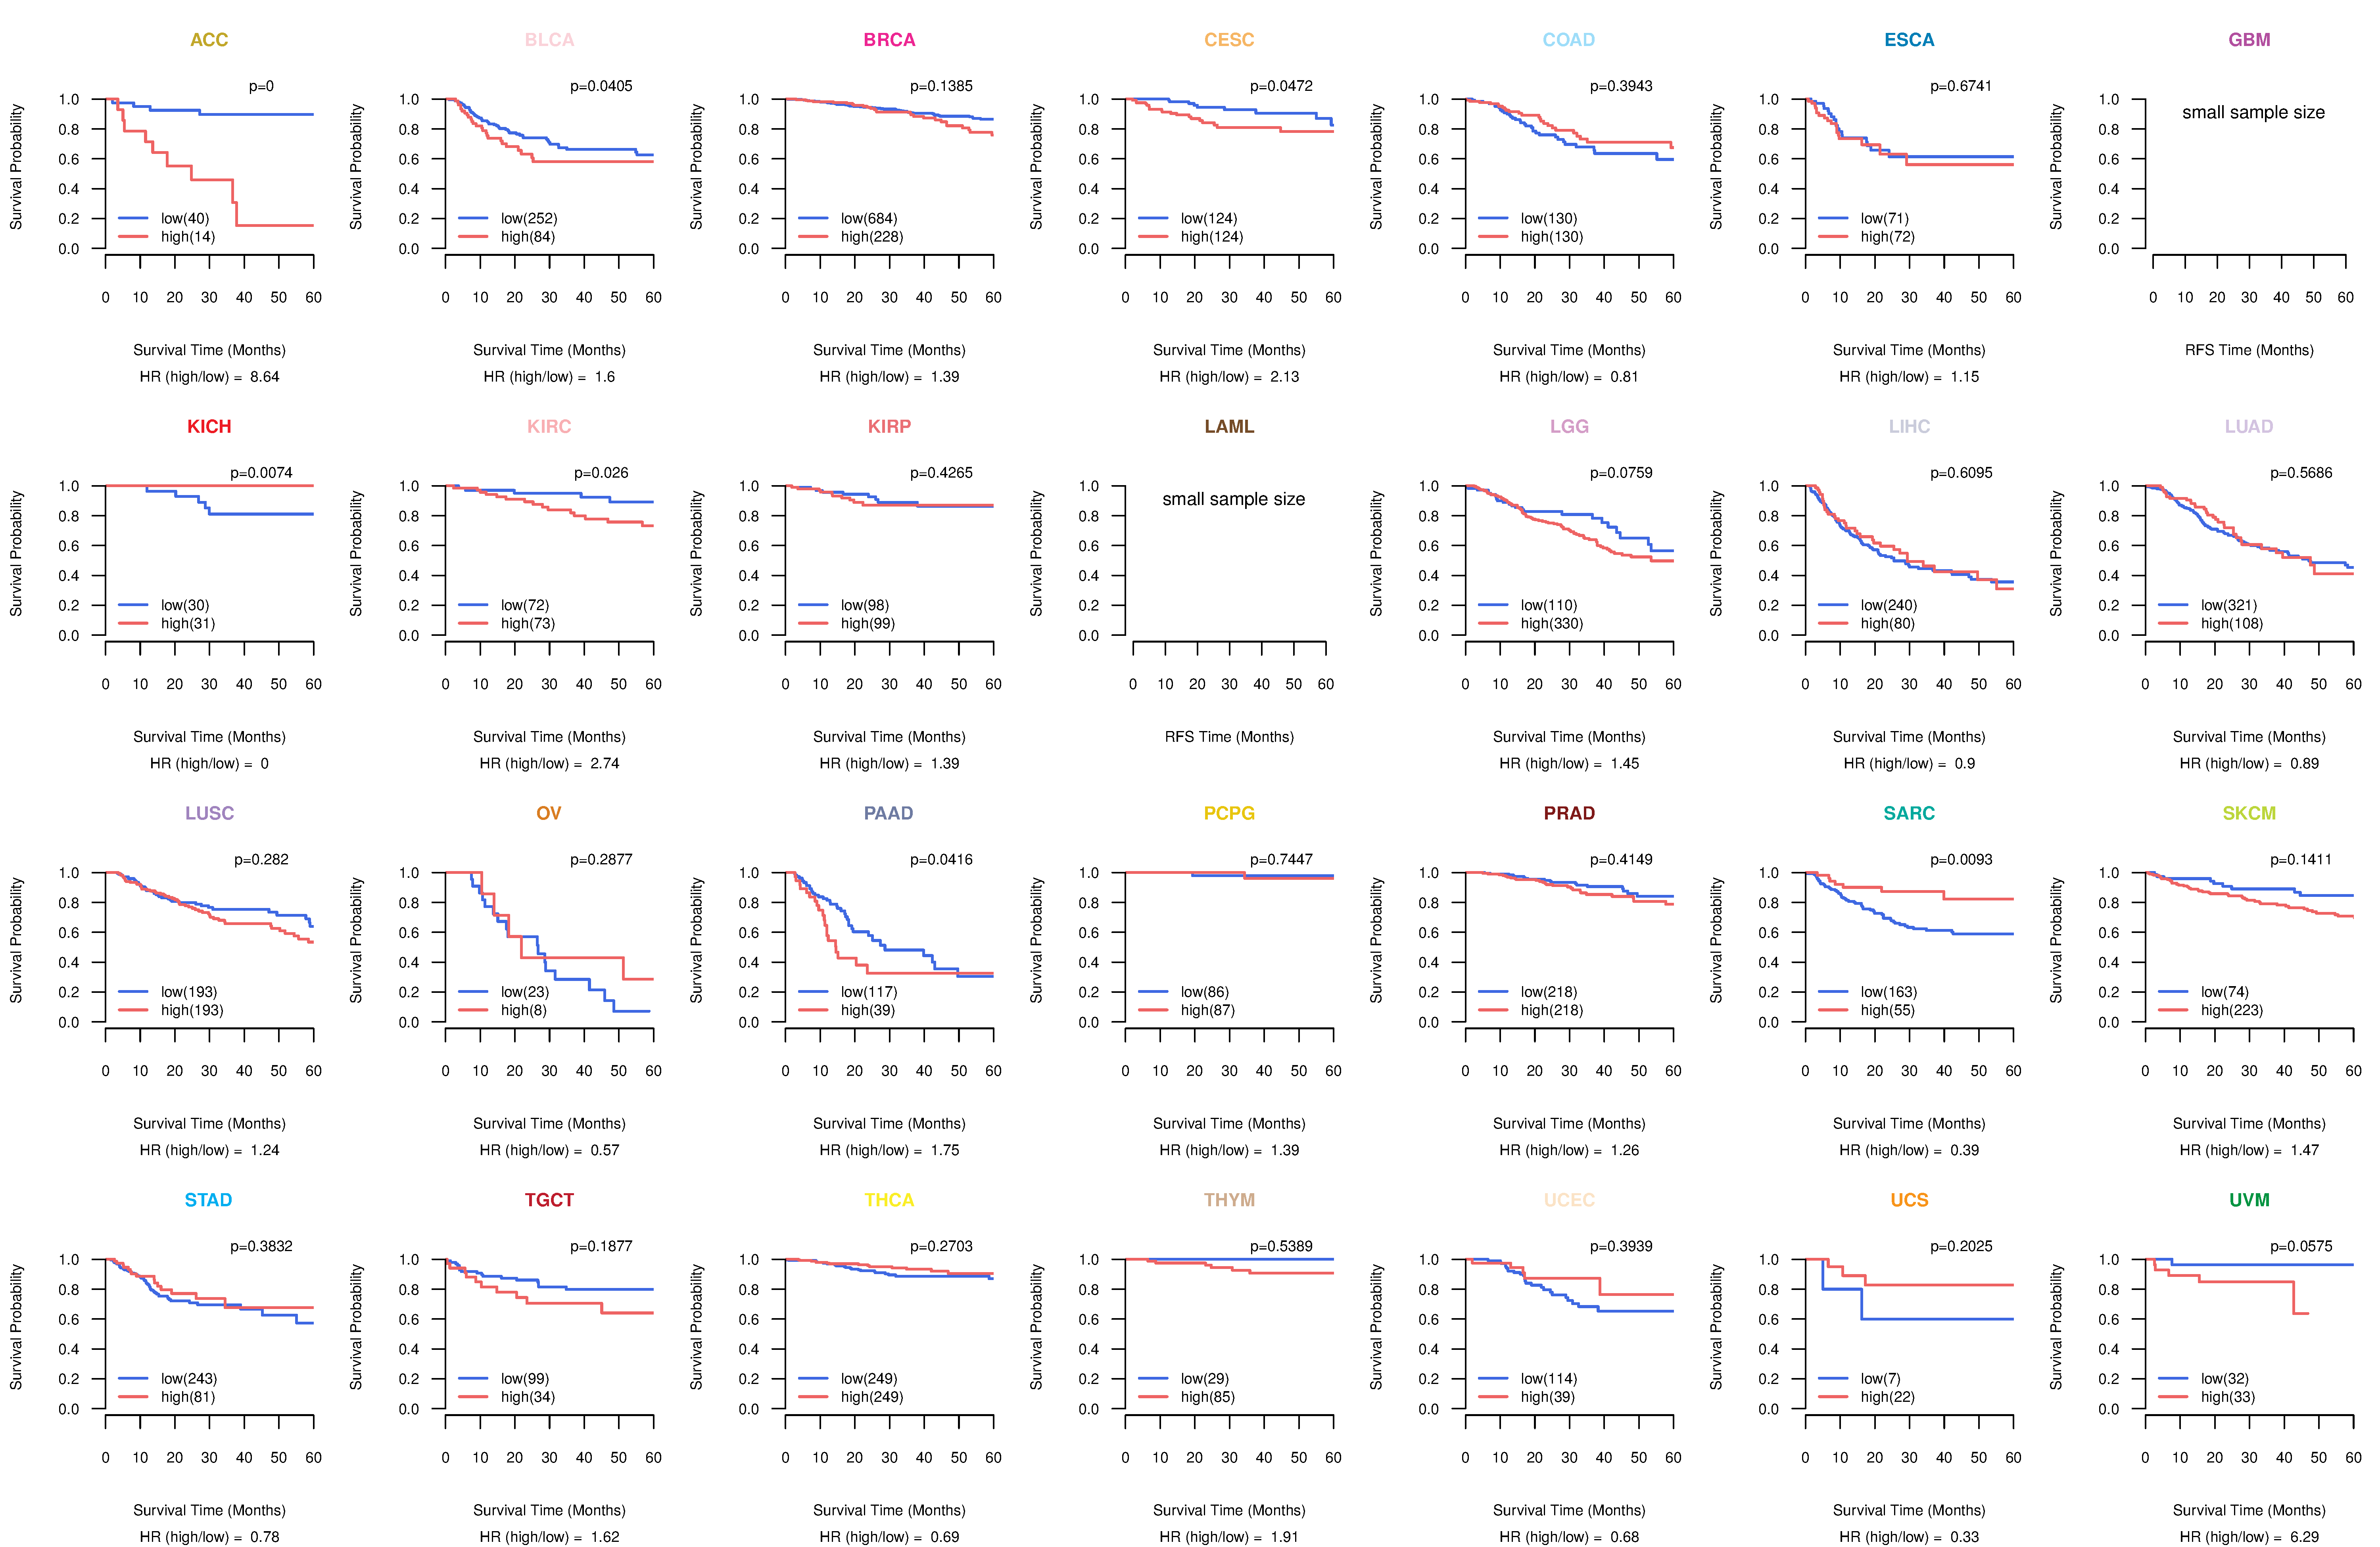
| Kaplan-Meier plots with logrank tests of overall survival (OS) using 28 cancer types (TCGA IlluminaHiSeq_RNASeqV2, pan-cancer normalized log2(norm_counts+1) data, version 2016-08-16) (TCGA clinicalMatrix, phenotype data, version 2016-04-27) * Click on the image to enlarge it in a new window. |
 |
| Kaplan-Meier plots with logrank test of relapse free survival (RFS) using 28 cancer types (TCGA IlluminaHiSeq_RNASeqV2, pan-cancer normalized log2(norm_counts+1) data, version 2016-08-16) (TCGA clinicalMatrix, phenotype data, version 2016-04-27) * Click on the image enlarge it in a new window. |
 |
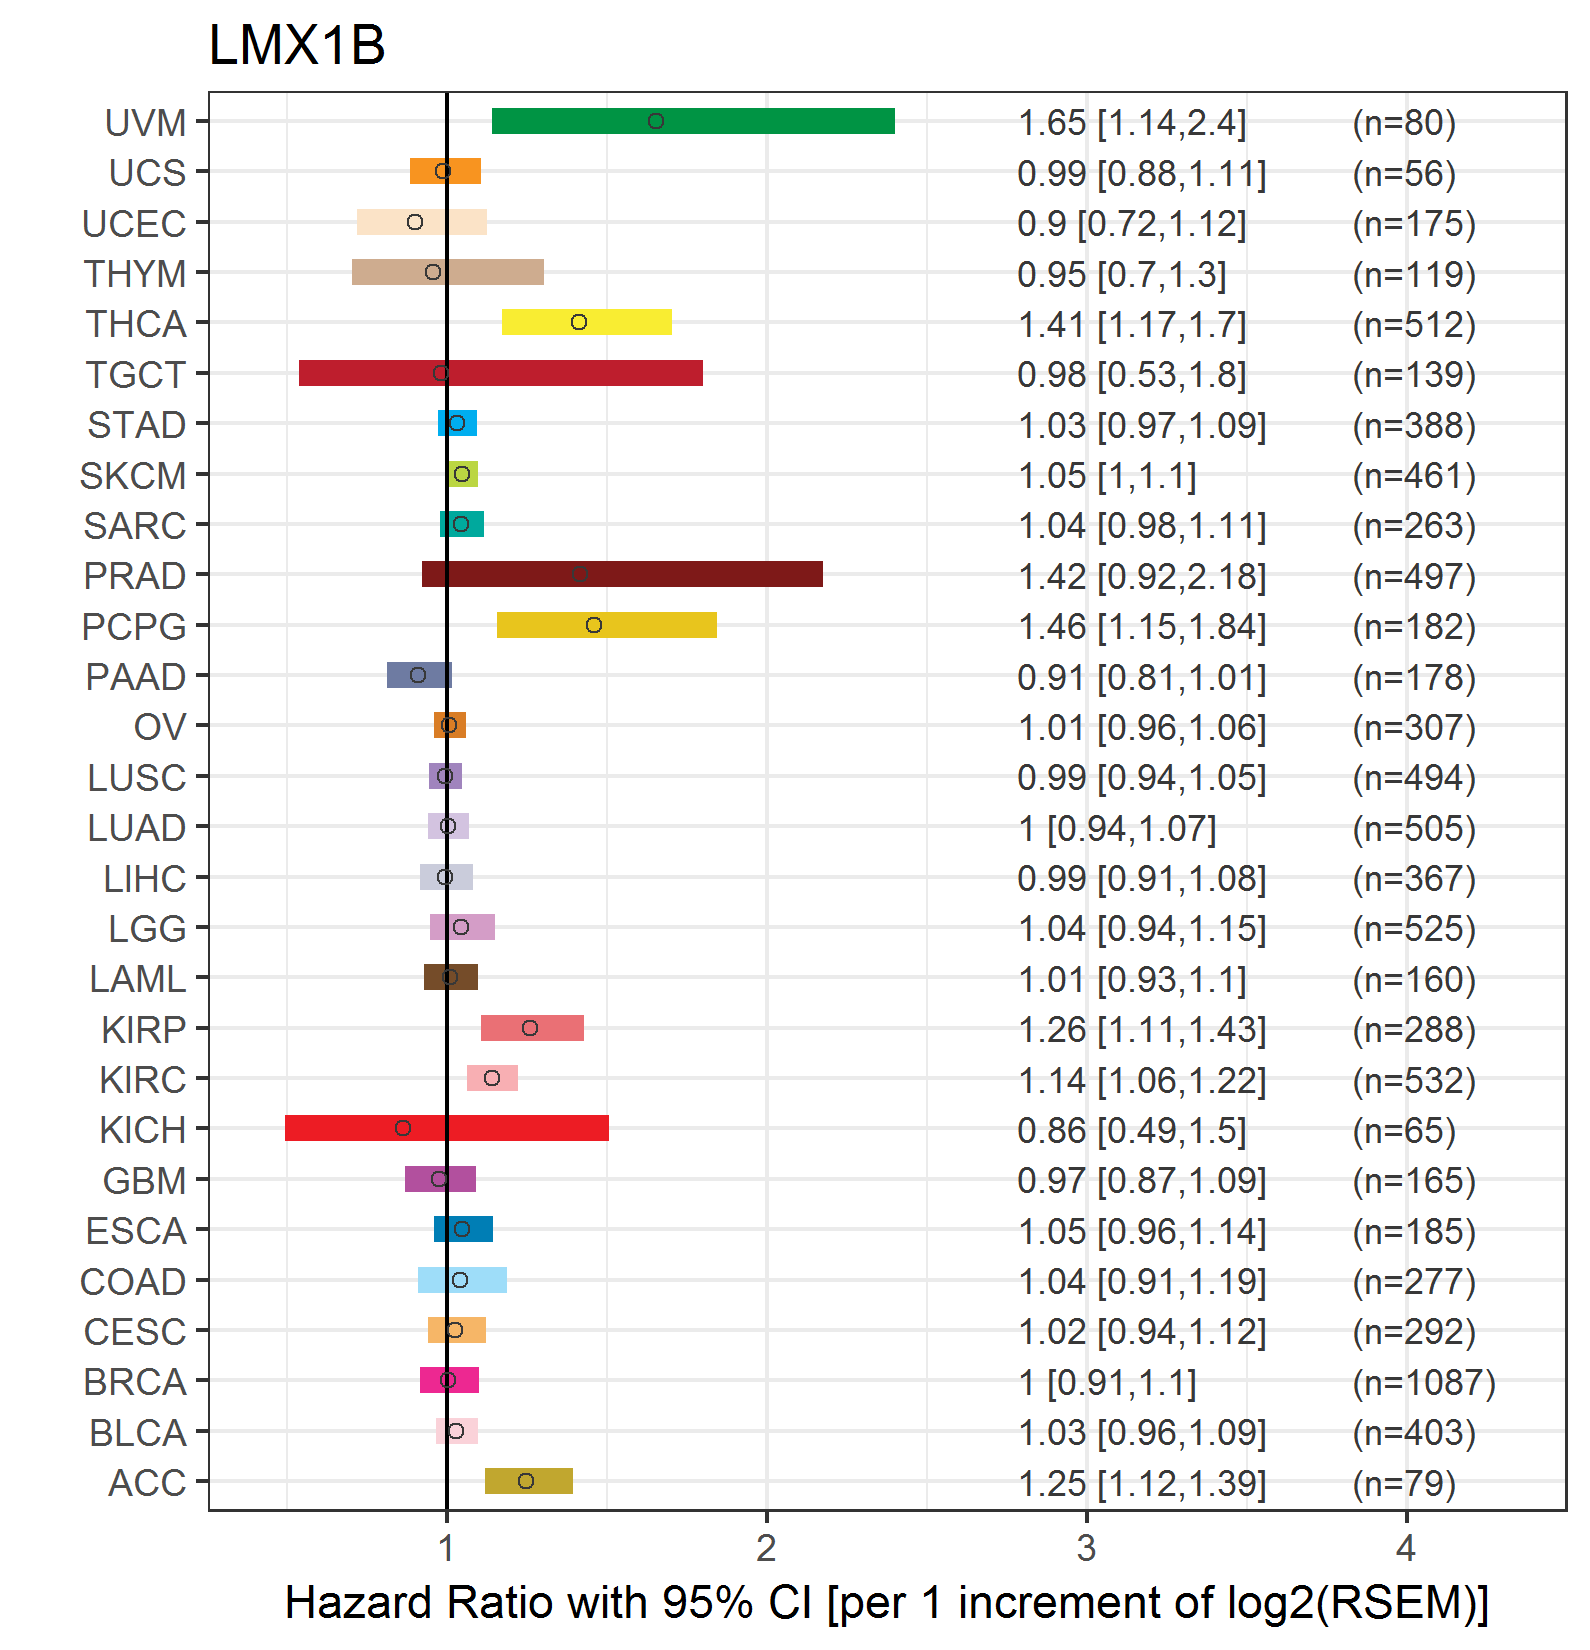
| Forest plot of Cox proportional hazard ratio (HR) and 95% CI of overall survival (OS) using 28 cancer types (TCGA IlluminaHiSeq_RNASeqV2, pan-cancer normalized log2(norm_counts+1) data, version 2016-08-16) (TCGA clinicalMatrix, phenotype data, version 2016-04-27) * Click on the image enlarge it in a new window. |
 |
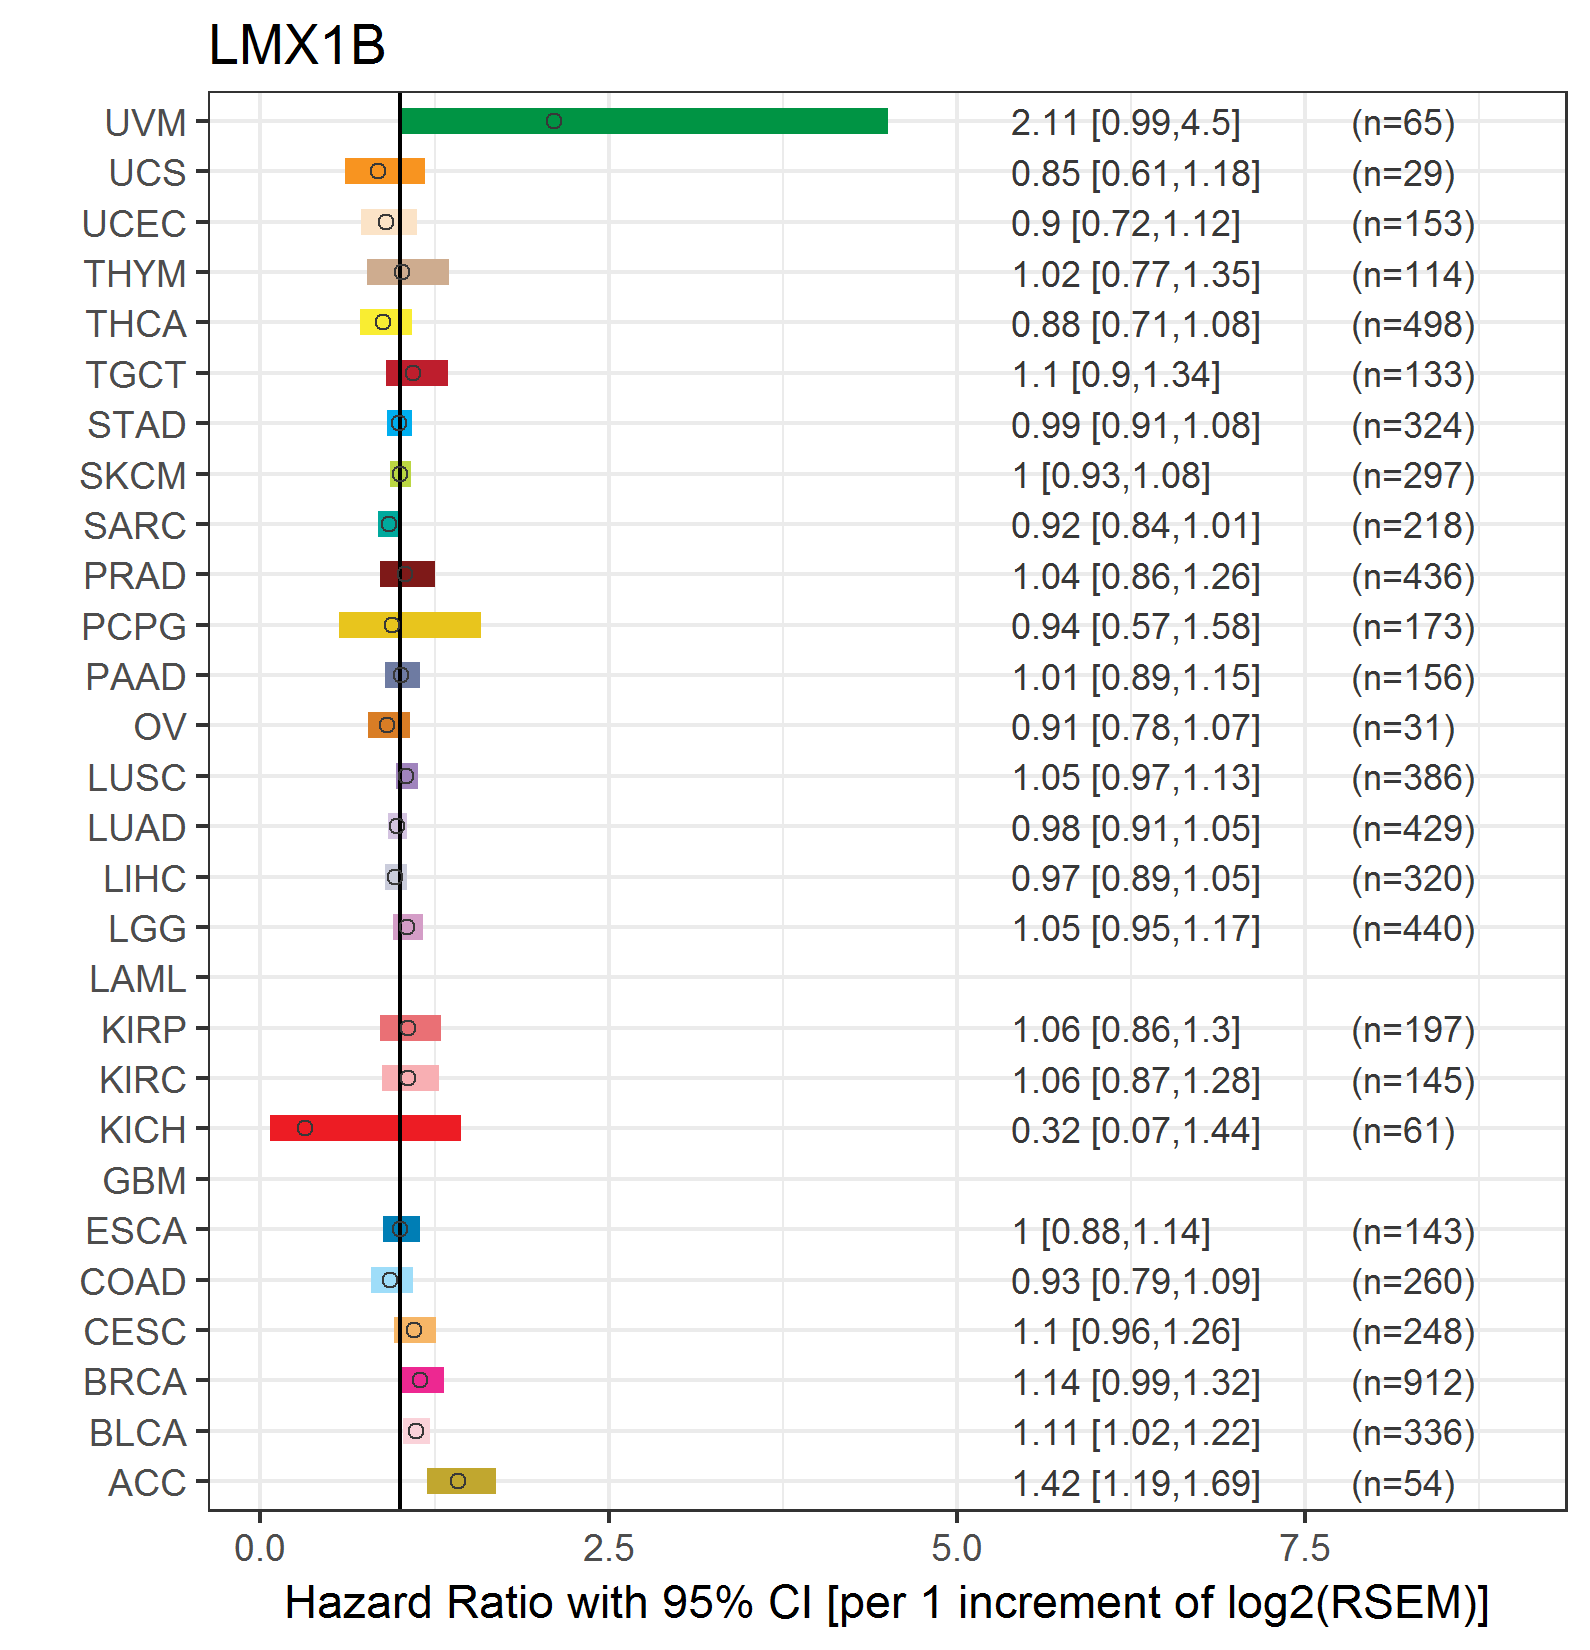
| Forest plot of Cox proportional hazard ratio (HR) and 95% CI of relapse free survival (RFS) using 28 cancer types (TCGA IlluminaHiSeq_RNASeqV2, pan-cancer normalized log2(norm_counts+1) data, version 2016-08-16) (TCGA clinicalMatrix, phenotype data, version 2016-04-27) * Click on the image enlarge it in a new window. |
 |
| Top |
| TissGeneClin for LMX1B |
| TissGeneDrug for LMX1B |
| Drug information targeting TissGene (DrugBank Version 5.0.6, 2017-04-01) |
| DrugBank ID | Drug name | Drug activity | Drug type | Drug status |
| Top |
| TissGeneDisease for LMX1B |
| Disease information associated with TissGene (DisGeNet, 2016-06-01) |
| Disease ID | Disease name | # pubmeds | Source |
| umls:C0027341 | Nail-Patella Syndrome | 45 | BeFree,CLINVAR,CTD_human,LHGDN,MGD,ORPHANET,UNIPROT |
| umls:C0017601 | Glaucoma | 6 | BeFree |
| umls:C0022658 | Kidney Diseases | 6 | BeFree |
| umls:C0017612 | Glaucoma, Open-Angle | 4 | BeFree,GAD |
| umls:C0030567 | Parkinson Disease | 3 | BeFree,GAD |
| umls:C0033687 | Proteinuria | 2 | CTD_human |
| umls:C0178664 | Glomerulosclerosis (disorder) | 2 | BeFree |
| umls:C0268731 | Renal glomerular disease | 2 | BeFree |
| umls:C0339573 | Glaucoma, Primary Open Angle | 2 | BeFree |
| umls:C0403548 | Salcedo syndrome | 2 | BeFree |
| umls:C1853566 | Genitopatellar Syndrome | 2 | BeFree |
| umls:C0000768 | Congenital Abnormality | 1 | BeFree |
| umls:C0004352 | Autistic Disorder | 1 | BeFree |
| umls:C0004936 | Mental disorders | 1 | CTD_human |
| umls:C0008625 | Chromosome Aberrations | 1 | GAD |
| umls:C0008924 | Cleft Lip | 1 | GAD |
| umls:C0008925 | Cleft Palate | 1 | GAD |
| umls:C0009081 | Congenital clubfoot | 1 | CTD_human |
| umls:C0010278 | Craniosynostosis | 1 | GAD |
| umls:C0018965 | Hematuria | 1 | CTD_human |
| umls:C0020473 | Hyperlipidemia | 1 | CTD_human |
| umls:C0021603 | Sleep Initiation and Maintenance Disorders | 1 | CTD_human |
| umls:C0027339 | Nail Diseases | 1 | BeFree |
| umls:C0027708 | Nephroblastoma | 1 | BeFree |
| umls:C0028840 | Ocular Hypertension | 1 | GAD |
| umls:C0029925 | Ovarian Carcinoma | 1 | BeFree |
| umls:C0031069 | Familial Mediterranean Fever | 1 | LHGDN |
| umls:C0036341 | Schizophrenia | 1 | BeFree,GAD |
| umls:C0041696 | Unipolar Depression | 1 | BeFree |
| umls:C0178874 | Tumor Progression | 1 | BeFree |
| umls:C0235831 | Renal Cell Dysplasia | 1 | BeFree |
| umls:C0266292 | Congenital anomaly of the kidney | 1 | BeFree |
| umls:C0595921 | Intraocular pressure disorder | 1 | BeFree |
| umls:C0596263 | Carcinogenesis | 1 | BeFree |
| umls:C1140680 | Malignant neoplasm of ovary | 1 | BeFree |
| umls:C1263846 | Attention deficit hyperactivity disorder | 1 | BeFree |
| umls:C1269683 | Major Depressive Disorder | 1 | BeFree |
| umls:C1535926 | Neurodevelopmental Disorders | 1 | CTD_human |
| umls:C3536714 | Renal dysplasia | 1 | BeFree |
| umls:C1842028 | GLAUCOMA 1, OPEN ANGLE, A | 0 | CTD_human |
|
Copyright 2016-Present - The University of Texas Health Science Center at Houston (UTHealth) Web File Viewing | How to Report, Fraud, Waste and Abuse | State of Texas | Statewide Search | Texas Homeland Security | Site Policies |