 |
| |
| |
| |
| |
| |
| |
|

| TissGeneSummary for LY6H |
 Gene summary Gene summary |
| Basic gene information | Gene symbol | LY6H |
| Gene name | lymphocyte antigen 6 complex, locus H | |
| Synonyms | NMLY6 | |
| Cytomap | UCSC genome browser: 8q24.3 | |
| Type of gene | protein-coding | |
| RefGenes | NM_001130478.1, NM_001135655.1,NM_002347.4, | |
| Description | ly-6Hlymphocyte antigen 6H | |
| Modification date | 20141207 | |
| dbXrefs | MIM : 603625 | |
| HGNC : HGNC | ||
| Ensembl : ENSG00000176956 | ||
| HPRD : 04691 | ||
| Vega : OTTHUMG00000154890 | ||
| Protein | UniProt: go to UniProt's Cross Reference DB Table | |
| Expression | CleanEX: HS_LY6H | |
| BioGPS: 4062 | ||
| Pathway | NCI Pathway Interaction Database: LY6H | |
| KEGG: LY6H | ||
| REACTOME: LY6H | ||
| Pathway Commons: LY6H | ||
| Context | iHOP: LY6H | |
| ligand binding site mutation search in PubMed: LY6H | ||
| UCL Cancer Institute: LY6H | ||
| Assigned class in TissGDB* | C | |
| Included tissue-specific gene expression resources | HPA,TiGER | |
| Specific-tissues in normal samples (assigned by TissGDB using HPA, TiGER, and GTEx) | Brain | |
| Cancer types related to the specific-tissues in cancer samples (assigned by TissGDB using TCGA) | GBM,LGG | |
| Reference showing the relevant tissue of LY6H | ||
| Description by TissGene annotations | ||
| * Class A consists of genes with literature evidence and is part of the cTissGenes. Class B consists of only cTissGenes without additional evidence. The remaining genes belong to Class C. |
| Gene ontology having evidence of Inferred from Direct Assay (IDA) from Entrez |
| GO ID | GO term | PubMed ID |
| Top |
| TissGeneExp for LY6H |
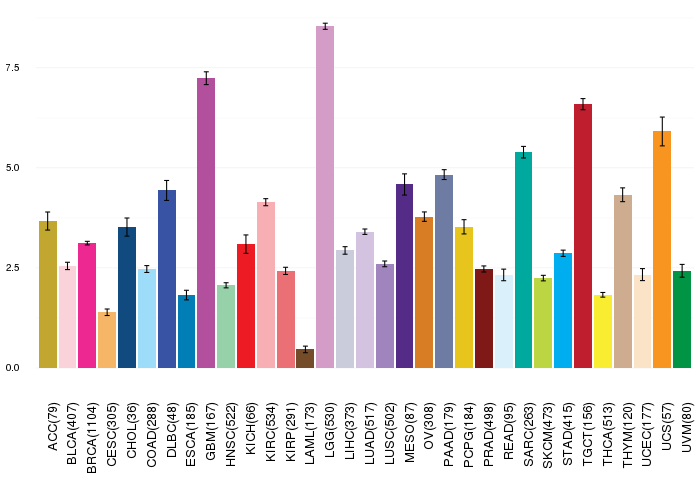
| Gene expressions across 28 cancer types (X-axis: cancer type and Y-axis: log2(norm_counts+1)) (TCGA IlluminaHiSeq_RNASeqV2, pan-cancer normalized log2(norm_counts+1) data, version 2016-08-16) |
 |
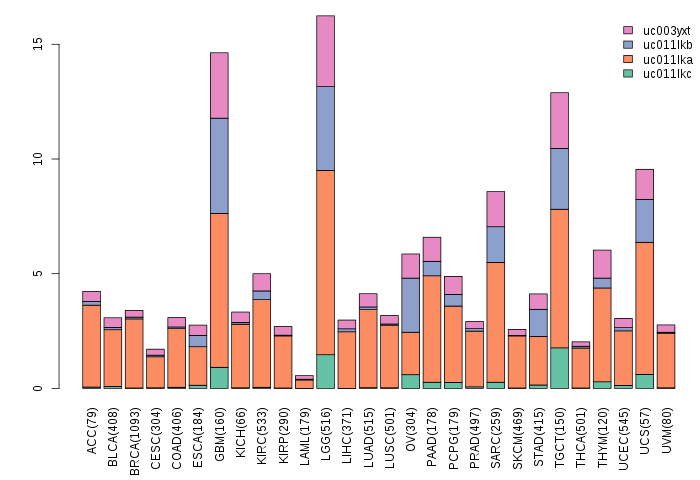
| Gene isoform expressions across 28 cancer types (X-axis: cancer type and Y-axis: log2(norm_counts+1)) (TCGA pan-cancer tcga_rsem_isoform_tpm, version 2016-09-01) |
 |
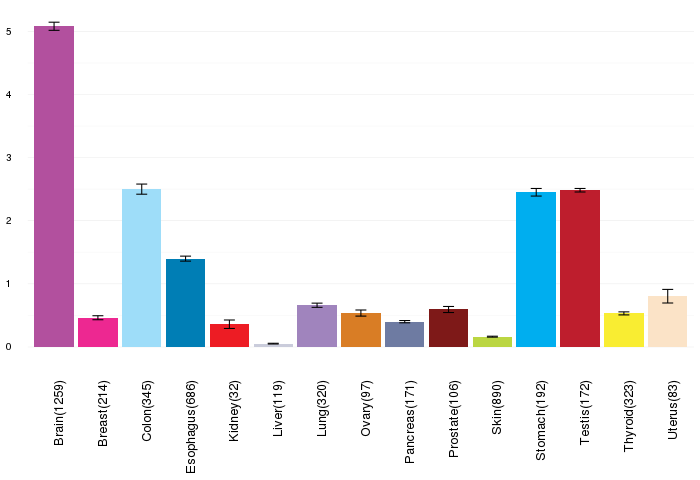
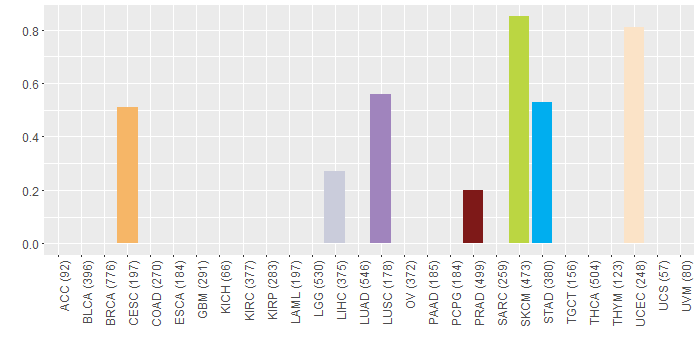
| Gene expressions across normal tissues of GTEx data (GTEx GTEx_Analysis_v6_RNA-seq_RNA-SeQCv1.1.8_gene_rpkm.gct) - Here, we shows the matched tissue types only among our 28 cancer types. |
 |
| Different expressions across 14 cancer types with more than 10 samples between matched tumors and normals (X-axis: cancer type and Y-axis: log2(norm_counts+1)) (TCGA IlluminaHiSeq_RNASeqV2, pan-cancer normalized log2(norm_counts+1) data, version 2016-08-16) |
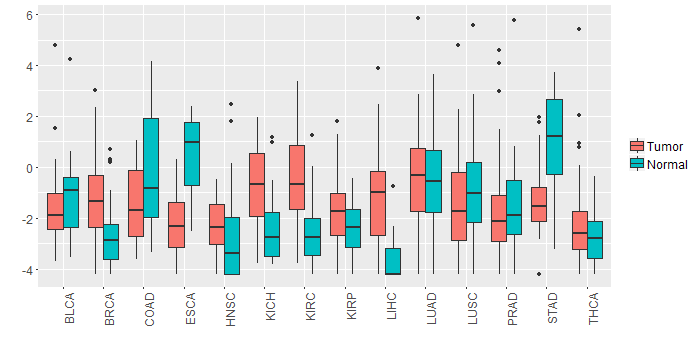 |
| - Significantly differentially expressed cancer types and information. (|Fold change|>1 and FDR<0.05) |
| Cancer type | Mean(exp) in tumor | Mean(exp) in matched normal | Log2FC | P-val. | FDR |
| STAD | -1.39660382 | 0.894211805 | -2.290815625 | 1.59E-06 | 2.45E-05 |
| BRCA | -1.271676243 | -2.726618348 | 1.454942105 | 2.89E-15 | 1.52E-14 |
| LIHC | -1.252260945 | -3.670976945 | 2.418716 | 6.53E-13 | 1.34E-11 |
| KIRC | -0.499930556 | -2.536872223 | 2.036941667 | 2.45E-13 | 1.09E-12 |
| COAD | -1.473618483 | -0.048383868 | -1.425234615 | 0.00839 | 0.018990176 |
| ESCA | -2.188388763 | 0.463093055 | -2.651481818 | 0.00082 | 0.012753007 |
| KICH | -0.809518945 | -2.420970945 | 1.611452 | 0.000488 | 0.001116876 |
| Top |
| TissGene-miRNA for LY6H |
| Significantly anti-correlated miRNAs of TissGene across 28 cancer types (Gene-miRNA relations from TargetScanHuman Relsease 7.1, Conserved_Site_Context_Scores.txt.zip, 06.01.2016) (TCGA IlluminaHiSeq_miRNASeq, log2(RPM+1) data, version 2016-11-21) (TCGA IlluminaHiSeq_RNASeqV2, log2(normalized_count+1) data, version 2016-08-16) (Spearman’s Rank Correlation (p-value<0.05 and coefficient<-0.25)) |
| Cancer type | miRNA id | miRNA accession | P-val. | Coeff. | # samples |
| Top |
| TissGeneMut for LY6H |
| TissGeneSNV for LY6H |
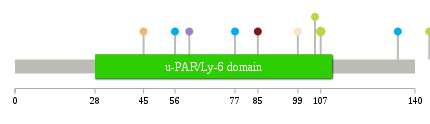
| nsSNV counts per each loci. Different colors of circles represent different cancer types. Circle size denotes number of samples. (TCGA somatic mutation (SNPs and small INDELs) data, version 2016-04-25) * Click on the image to enlarge it in a new window. |
 |
 |
| Somatic nucleotide variants of TissGene across 28 cancer types (X-axis: cancer type and Y-axis: % of mutated samples) The numbers in parentheses are numbers of samples with mutation (nsSNVs). (TCGA somatic mutation (SNPs and small INDELs) data, version 2016-04-25) |
 |
| - nsSNVs sorted by frequency. |
| AAchange | Cancer type | # samples |
| p.S107L | SKCM | 2 |
| p.A134V | STAD | 1 |
| p.E127D | HNSC | 1 |
| p.E127K | READ | 1 |
| p.L174F | UCEC | 1 |
| p.A61D | LUSC | 1 |
| p.E106D | HNSC | 1 |
| p.R56Q | STAD | 1 |
| p.H45Y | CESC | 1 |
| p.A145V | SKCM | 1 |
| p.P161H | LIHC | 1 |
| p.F105Y | SKCM | 1 |
| p.D99N | UCEC | 1 |
| p.R77Q | STAD | 1 |
| p.R85M | PRAD | 1 |
| Top |
| TissGeneCNV for LY6H |
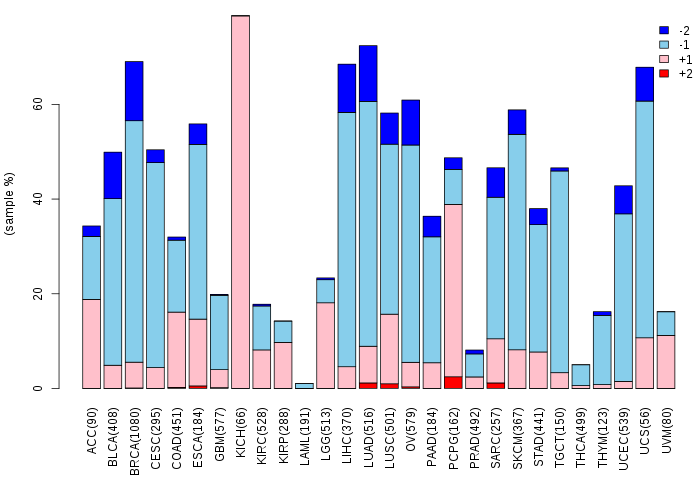
| Copy number variations of TissGene across 28 cancer types (X-axis: cancer type and Y-axis: % of CNV samples) (TCGA Gistic2_CopyNumber_Gistic2_all_data_by_genes, Gistic2 copy number data, version 2016-08-16) |
 |
| Top |
| TissGeneFusions for LY6H |
| Fusion genes including TissGene (ChimerDB 3.0, 2016-12-01 and TCGA fusion Portal 2015-12-01) |
| Database | Src | Cancer type | Sample | Fusion gene | ORF | 5'-gene BP | 3'-gene BP |
| Top |
| TissGeneNet for LY6H |
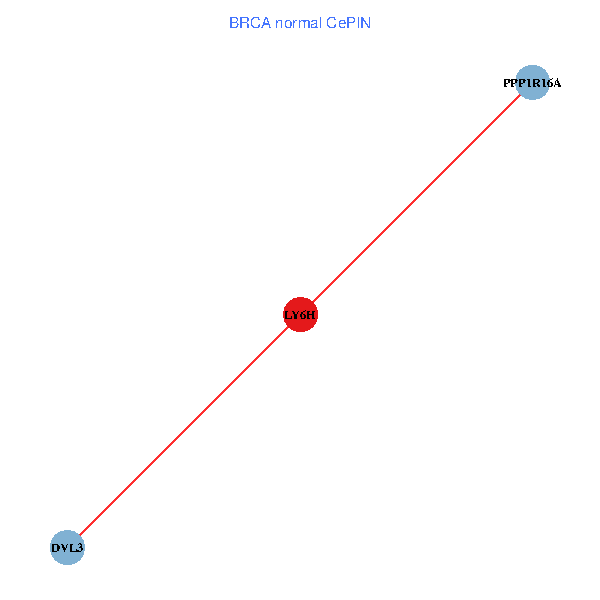
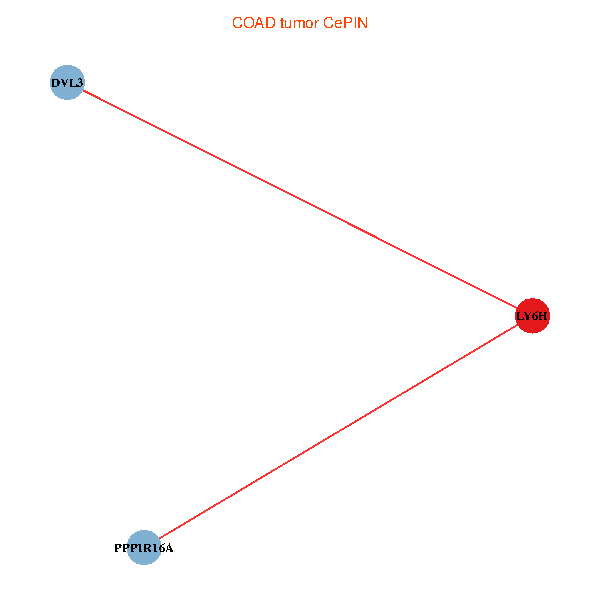
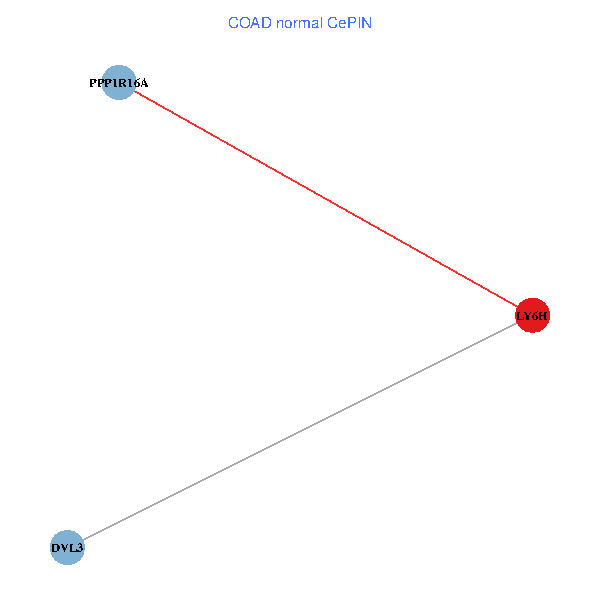
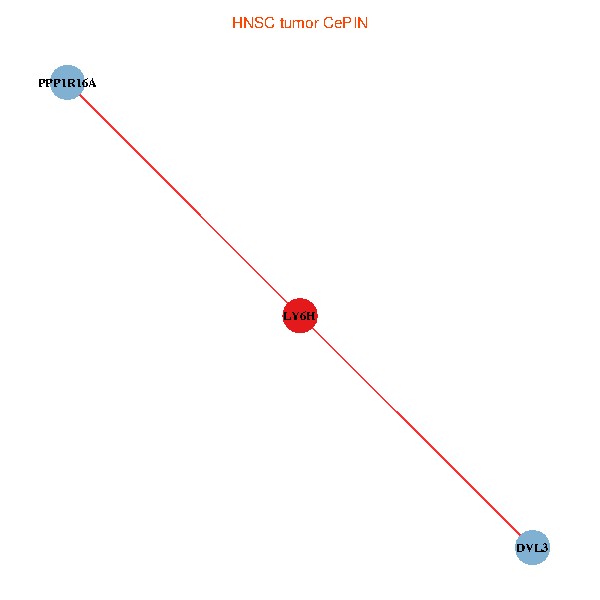
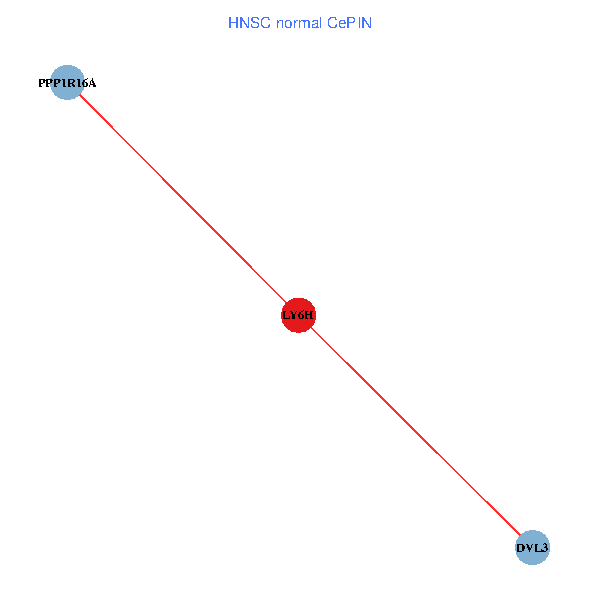
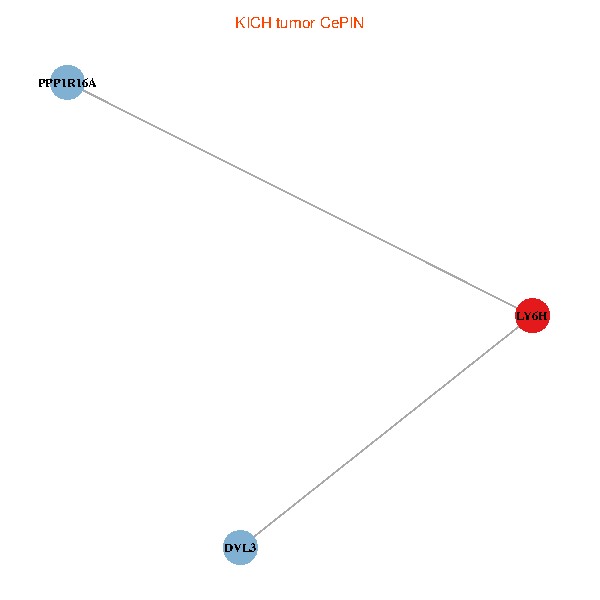
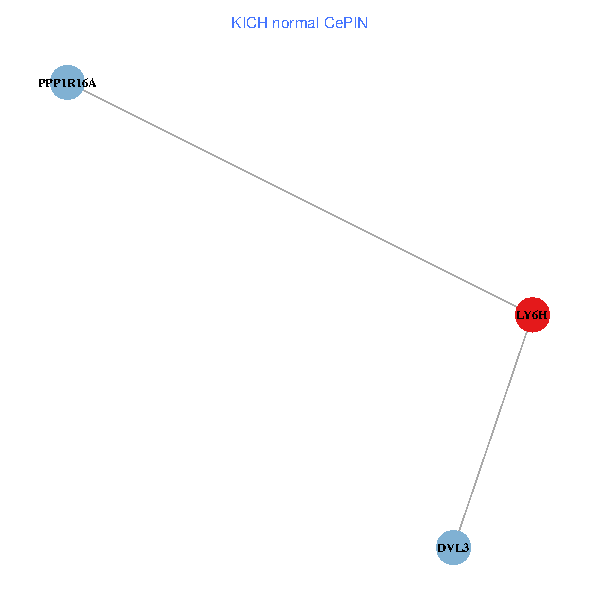
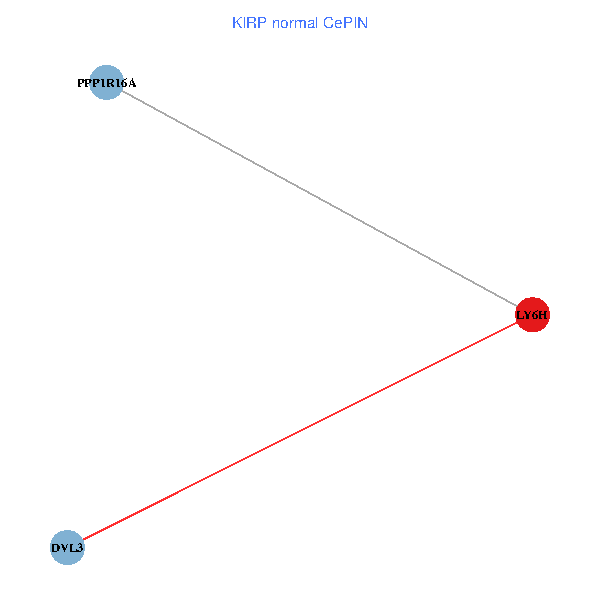
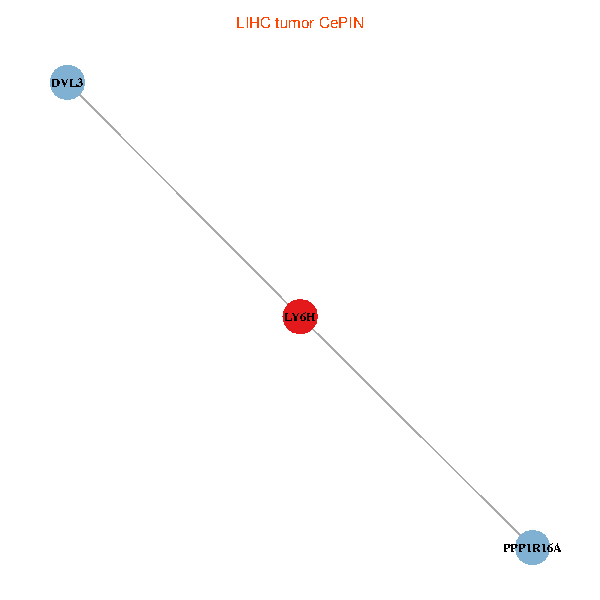
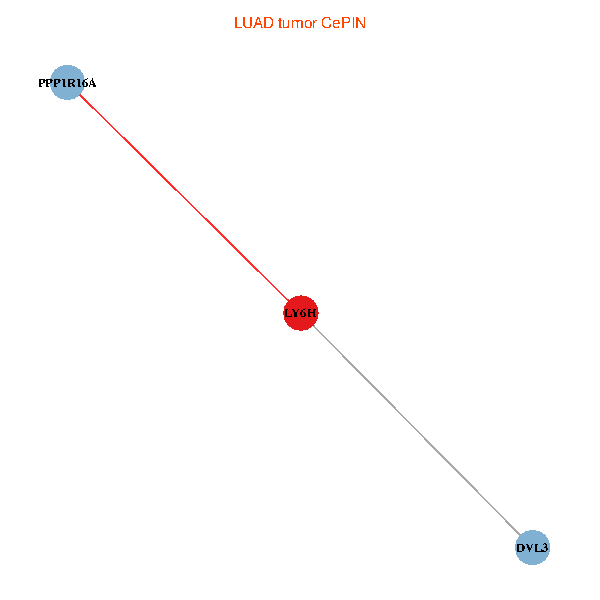
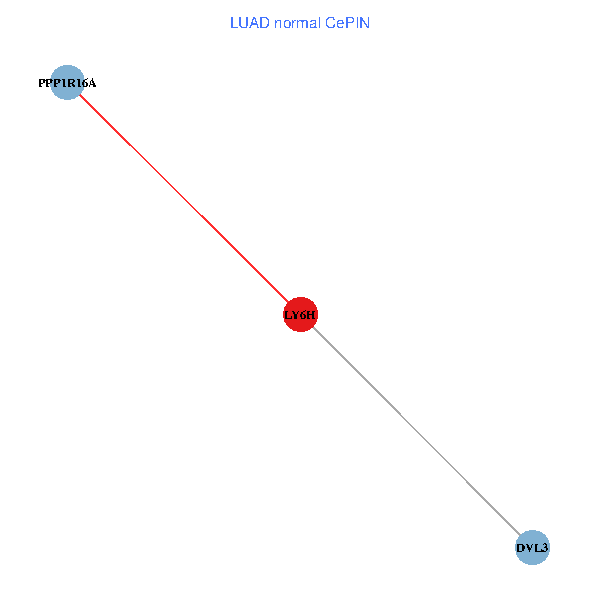
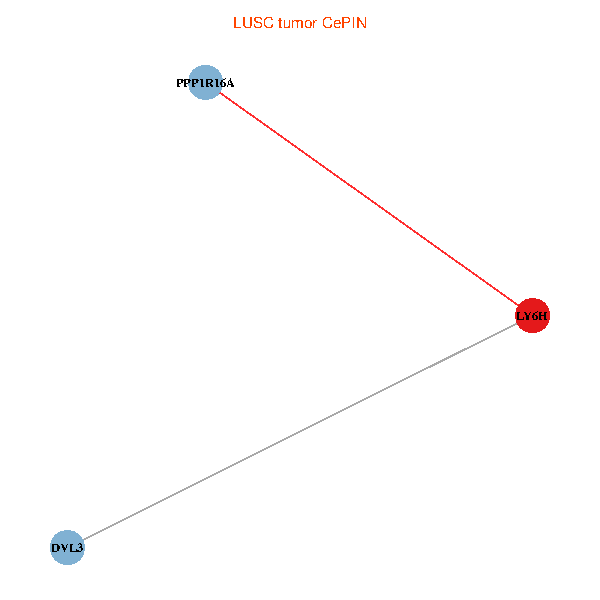
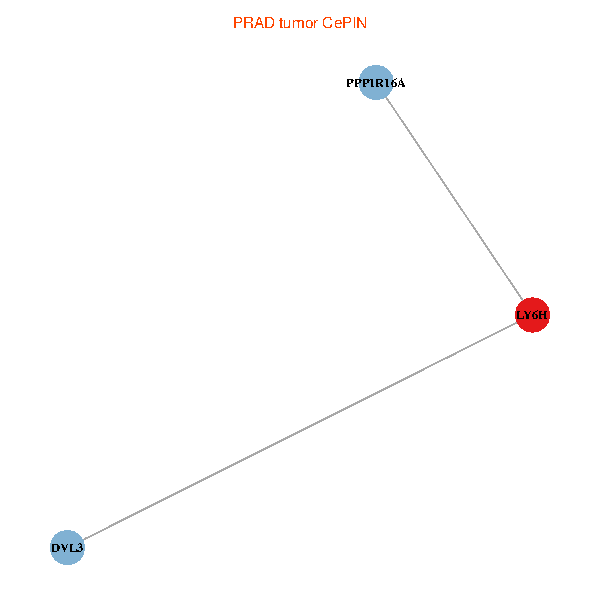
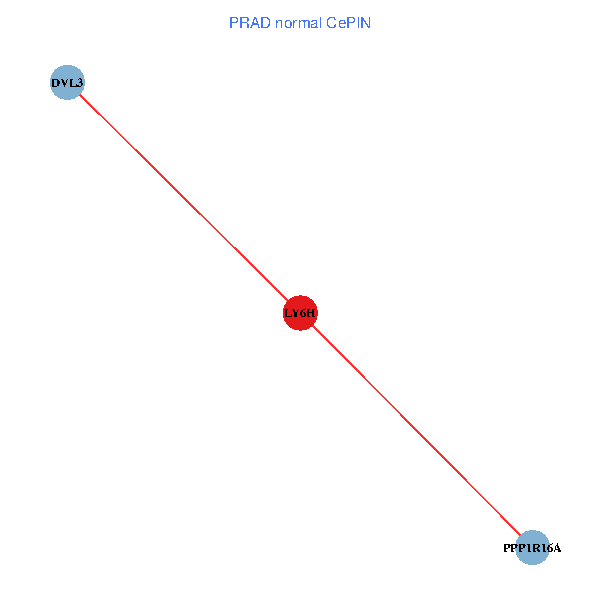
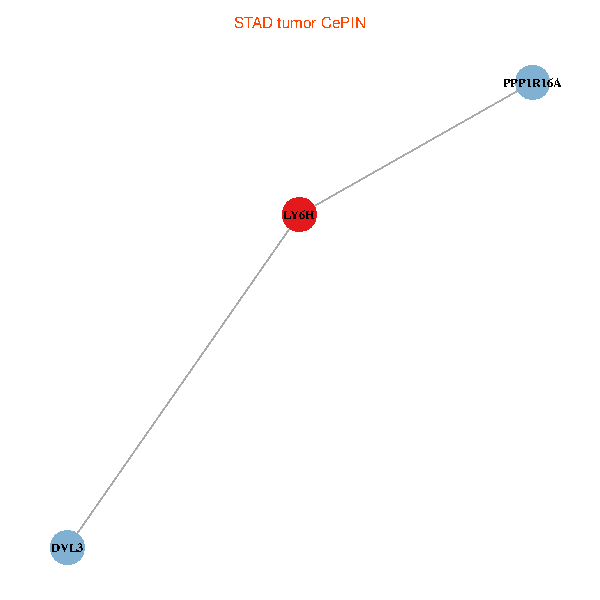
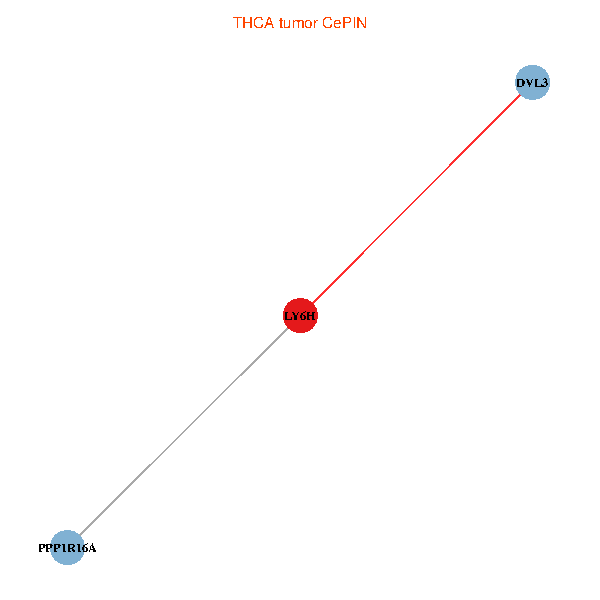
| Co-expressed gene networks based on protein-protein interaction data (CePIN) (TCGA IlluminaHiSeq_RNASeqV2, pan-cancer normalized log2(norm_counts+1) data, version 2016-08-16) (PINA2 ppi data) |
| BRCA (tumor) | BRCA (normal) |
| LY6H, PPP1R16A, DVL3 (tumor) | LY6H, PPP1R16A, DVL3 (normal) |
 |  |
| COAD (tumor) | COAD (normal) |
| LY6H, PPP1R16A, DVL3 (tumor) | LY6H, PPP1R16A, DVL3 (normal) |
 |  |
| HNSC (tumor) | HNSC (normal) |
| LY6H, PPP1R16A, DVL3 (tumor) | LY6H, PPP1R16A, DVL3 (normal) |
 |  |
| KICH (tumor) | KICH (normal) |
| LY6H, PPP1R16A, DVL3 (tumor) | LY6H, PPP1R16A, DVL3 (normal) |
 |  |
| KIRC (tumor) | KIRC (normal) |
| LY6H, PPP1R16A, DVL3 (tumor) | LY6H, PPP1R16A, DVL3 (normal) |
 |  |
| KIRP (tumor) | KIRP (normal) |
| LY6H, PPP1R16A, DVL3 (tumor) | LY6H, PPP1R16A, DVL3 (normal) |
 |  |
| LIHC (tumor) | LIHC (normal) |
| LY6H, PPP1R16A, DVL3 (tumor) | LY6H, PPP1R16A, DVL3 (normal) |
 |  |
| LUAD (tumor) | LUAD (normal) |
| LY6H, PPP1R16A, DVL3 (tumor) | LY6H, PPP1R16A, DVL3 (normal) |
 |  |
| LUSC (tumor) | LUSC (normal) |
| LY6H, PPP1R16A, DVL3 (tumor) | LY6H, PPP1R16A, DVL3 (normal) |
 |  |
| PRAD (tumor) | PRAD (normal) |
| LY6H, PPP1R16A, DVL3 (tumor) | LY6H, PPP1R16A, DVL3 (normal) |
 |  |
| STAD (tumor) | STAD (normal) |
| LY6H, PPP1R16A, DVL3 (tumor) | LY6H, PPP1R16A, DVL3 (normal) |
 |  |
| THCA (tumor) | THCA (normal) |
| LY6H, PPP1R16A, DVL3 (tumor) | LY6H, PPP1R16A, DVL3 (normal) |
 |  |
| Top |
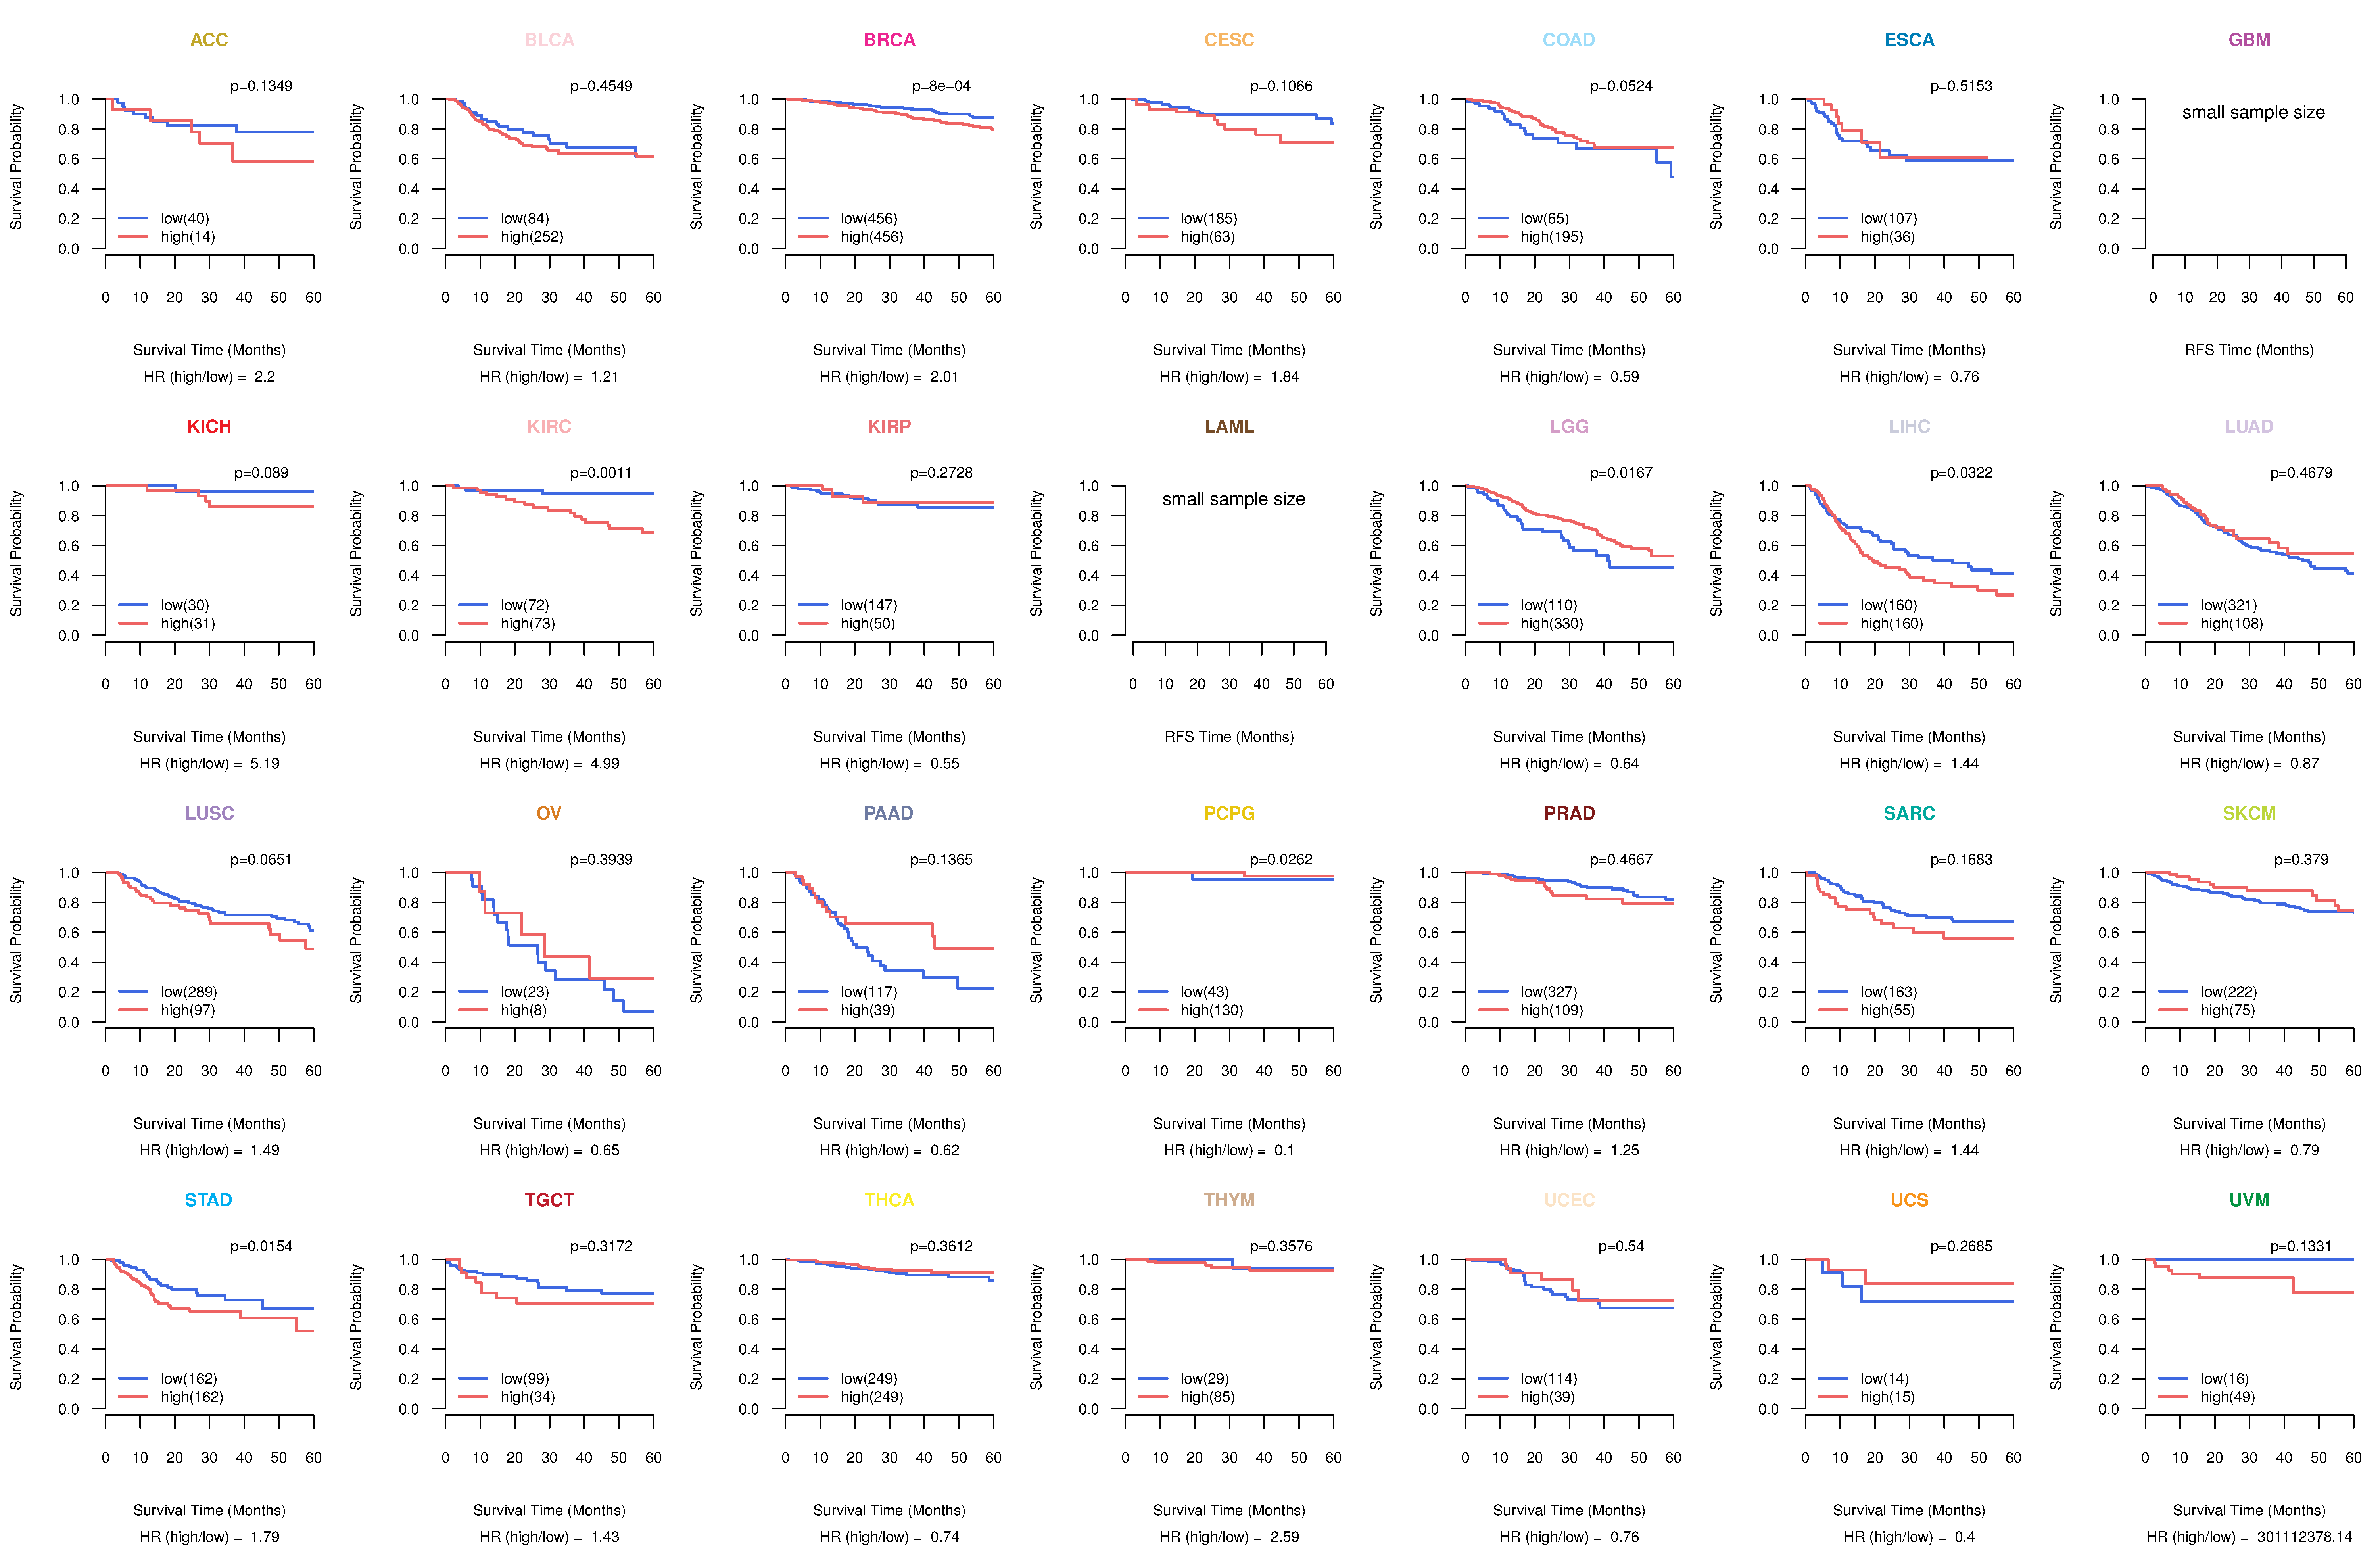
| TissGeneProg for LY6H |
| Kaplan-Meier plots with logrank tests of overall survival (OS) using 28 cancer types (TCGA IlluminaHiSeq_RNASeqV2, pan-cancer normalized log2(norm_counts+1) data, version 2016-08-16) (TCGA clinicalMatrix, phenotype data, version 2016-04-27) * Click on the image to enlarge it in a new window. |
 |
| Kaplan-Meier plots with logrank test of relapse free survival (RFS) using 28 cancer types (TCGA IlluminaHiSeq_RNASeqV2, pan-cancer normalized log2(norm_counts+1) data, version 2016-08-16) (TCGA clinicalMatrix, phenotype data, version 2016-04-27) * Click on the image enlarge it in a new window. |
 |
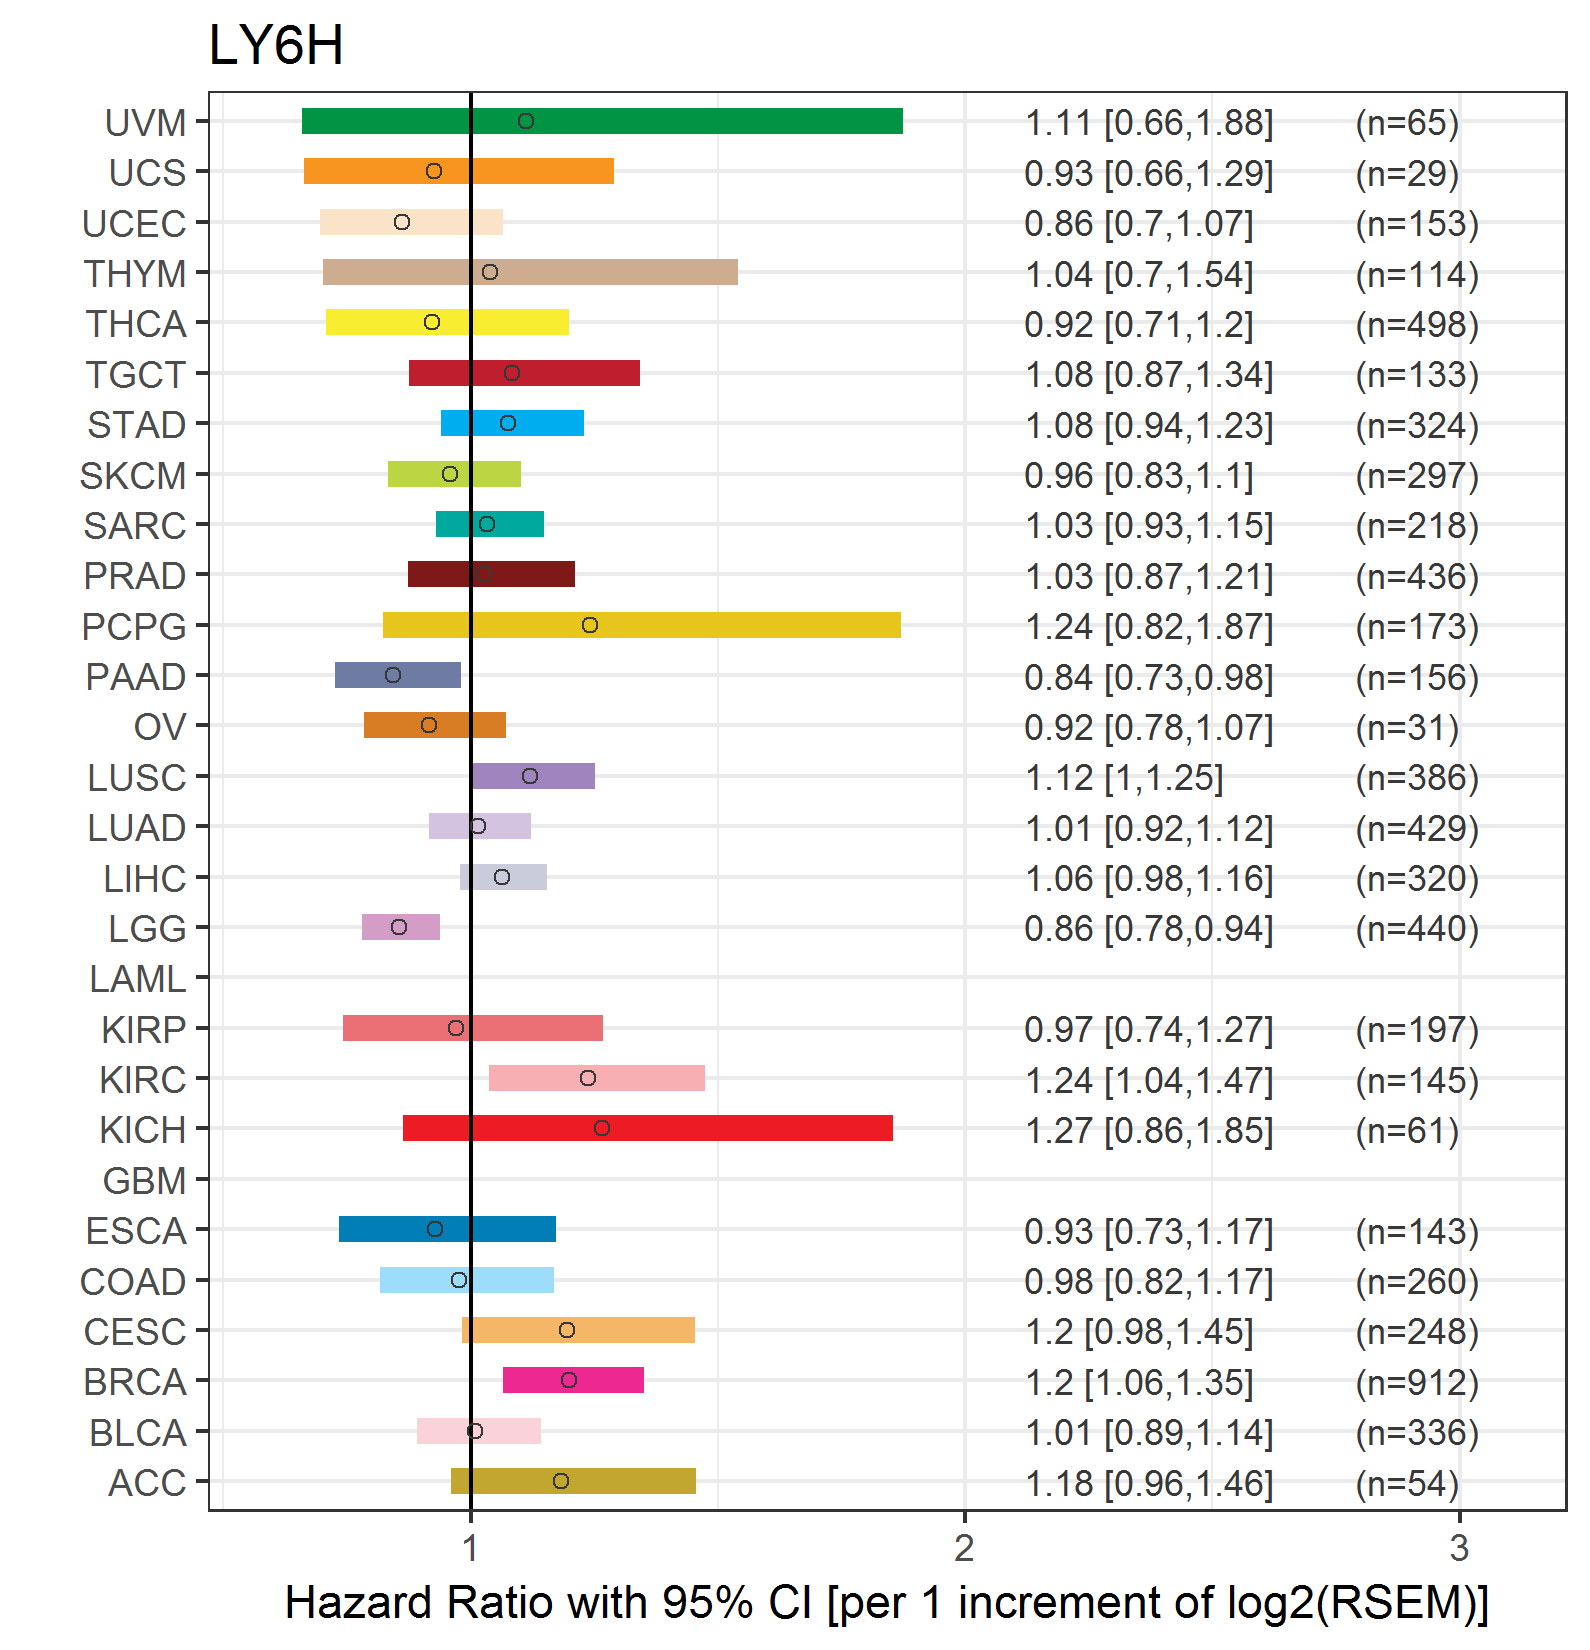
| Forest plot of Cox proportional hazard ratio (HR) and 95% CI of overall survival (OS) using 28 cancer types (TCGA IlluminaHiSeq_RNASeqV2, pan-cancer normalized log2(norm_counts+1) data, version 2016-08-16) (TCGA clinicalMatrix, phenotype data, version 2016-04-27) * Click on the image enlarge it in a new window. |
 |
| Forest plot of Cox proportional hazard ratio (HR) and 95% CI of relapse free survival (RFS) using 28 cancer types (TCGA IlluminaHiSeq_RNASeqV2, pan-cancer normalized log2(norm_counts+1) data, version 2016-08-16) (TCGA clinicalMatrix, phenotype data, version 2016-04-27) * Click on the image enlarge it in a new window. |
 |
| Top |
| TissGeneClin for LY6H |
| TissGeneDrug for LY6H |
| Drug information targeting TissGene (DrugBank Version 5.0.6, 2017-04-01) |
| DrugBank ID | Drug name | Drug activity | Drug type | Drug status |
| Top |
| TissGeneDisease for LY6H |
| Disease information associated with TissGene (DisGeNet, 2016-06-01) |
| Disease ID | Disease name | # pubmeds | Source |
|
Copyright 2016-Present - The University of Texas Health Science Center at Houston (UTHealth) Web File Viewing | How to Report, Fraud, Waste and Abuse | State of Texas | Statewide Search | Texas Homeland Security | Site Policies |