 |
| |
| |
| |
| |
| |
| |
|

| TissGeneSummary for FAM19A1 |
 Gene summary Gene summary |
| Basic gene information | Gene symbol | FAM19A1 |
| Gene name | family with sequence similarity 19 (chemokine (C-C motif)-like), member A1 | |
| Synonyms | TAFA-1|TAFA1 | |
| Cytomap | UCSC genome browser: 3p14.1 | |
| Type of gene | protein-coding | |
| RefGenes | NM_001252216.1, NM_213609.3, | |
| Description | chemokine-like protein TAFA-1protein FAM19A1 | |
| Modification date | 20141207 | |
| dbXrefs | HGNC : HGNC | |
| Ensembl : ENSG00000183662 | ||
| HPRD : 13294 | ||
| Vega : OTTHUMG00000158745 | ||
| Protein | UniProt: go to UniProt's Cross Reference DB Table | |
| Expression | CleanEX: HS_FAM19A1 | |
| BioGPS: 407738 | ||
| Pathway | NCI Pathway Interaction Database: FAM19A1 | |
| KEGG: FAM19A1 | ||
| REACTOME: FAM19A1 | ||
| Pathway Commons: FAM19A1 | ||
| Context | iHOP: FAM19A1 | |
| ligand binding site mutation search in PubMed: FAM19A1 | ||
| UCL Cancer Institute: FAM19A1 | ||
| Assigned class in TissGDB* | C | |
| Included tissue-specific gene expression resources | HPA,TiGER | |
| Specific-tissues in normal samples (assigned by TissGDB using HPA, TiGER, and GTEx) | Brain | |
| Cancer types related to the specific-tissues in cancer samples (assigned by TissGDB using TCGA) | GBM,LGG | |
| Reference showing the relevant tissue of FAM19A1 | ||
| Description by TissGene annotations | Have significant anti-correlated miRNA | |
| * Class A consists of genes with literature evidence and is part of the cTissGenes. Class B consists of only cTissGenes without additional evidence. The remaining genes belong to Class C. |
| Gene ontology having evidence of Inferred from Direct Assay (IDA) from Entrez |
| GO ID | GO term | PubMed ID |
| Top |
| TissGeneExp for FAM19A1 |
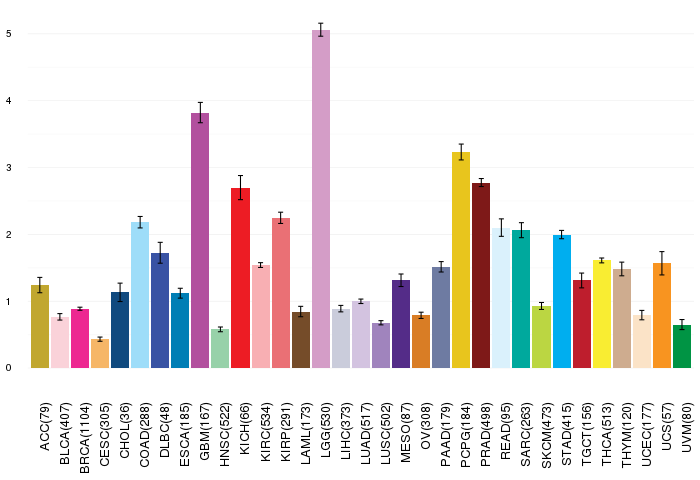
| Gene expressions across 28 cancer types (X-axis: cancer type and Y-axis: log2(norm_counts+1)) (TCGA IlluminaHiSeq_RNASeqV2, pan-cancer normalized log2(norm_counts+1) data, version 2016-08-16) |
 |
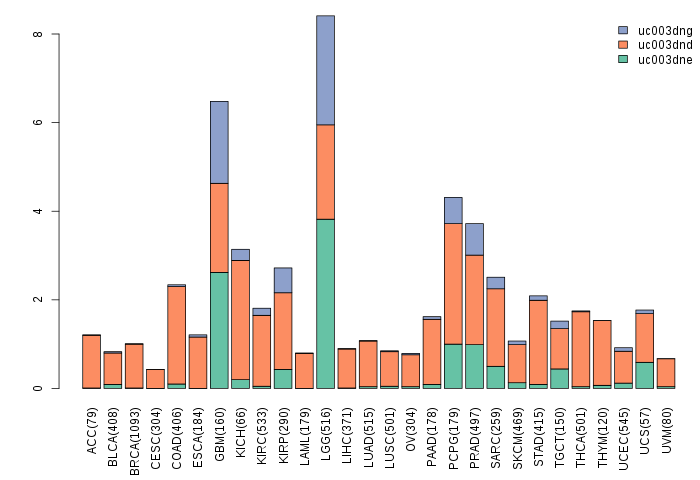
| Gene isoform expressions across 28 cancer types (X-axis: cancer type and Y-axis: log2(norm_counts+1)) (TCGA pan-cancer tcga_rsem_isoform_tpm, version 2016-09-01) |
 |
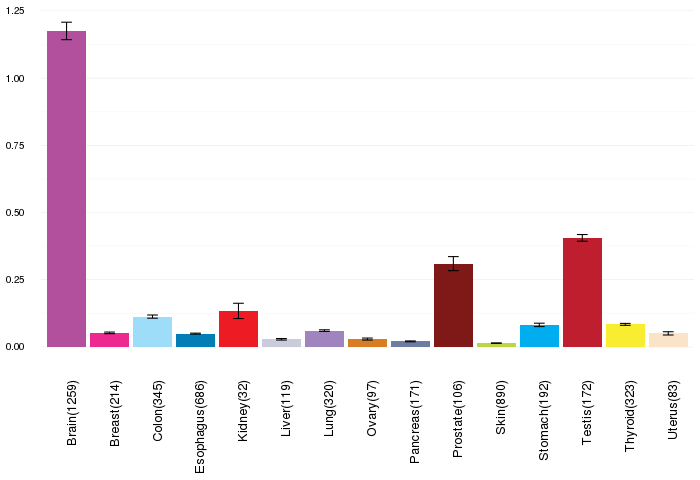
| Gene expressions across normal tissues of GTEx data (GTEx GTEx_Analysis_v6_RNA-seq_RNA-SeQCv1.1.8_gene_rpkm.gct) - Here, we shows the matched tissue types only among our 28 cancer types. |
 |
| Different expressions across 14 cancer types with more than 10 samples between matched tumors and normals (X-axis: cancer type and Y-axis: log2(norm_counts+1)) (TCGA IlluminaHiSeq_RNASeqV2, pan-cancer normalized log2(norm_counts+1) data, version 2016-08-16) |
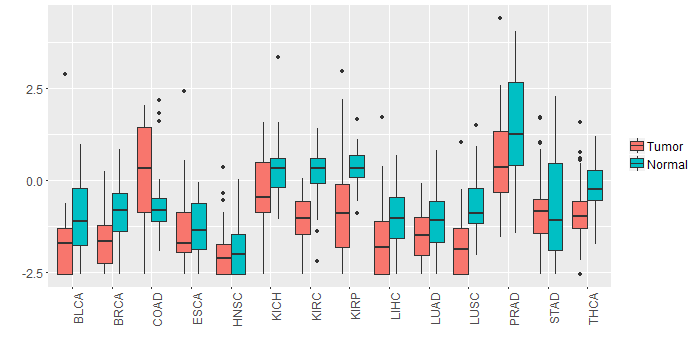 |
| - Significantly differentially expressed cancer types and information. (|Fold change|>1 and FDR<0.05) |
| Cancer type | Mean(exp) in tumor | Mean(exp) in matched normal | Log2FC | P-val. | FDR |
| KIRC | -1.054668134 | 0.210169366 | -1.2648375 | 6.46E-23 | 6.38E-22 |
| LUSC | -1.764284392 | -0.733504 | -1.030780392 | 9.31E-11 | 3.54E-10 |
| KIRP | -0.714740703 | 0.361315547 | -1.07605625 | 0.000198 | 0.000630563 |
| PRAD | 0.452313384 | 1.486540307 | -1.034226923 | 0.000102 | 0.000428056 |
| Top |
| TissGene-miRNA for FAM19A1 |
| Significantly anti-correlated miRNAs of TissGene across 28 cancer types (Gene-miRNA relations from TargetScanHuman Relsease 7.1, Conserved_Site_Context_Scores.txt.zip, 06.01.2016) (TCGA IlluminaHiSeq_miRNASeq, log2(RPM+1) data, version 2016-11-21) (TCGA IlluminaHiSeq_RNASeqV2, log2(normalized_count+1) data, version 2016-08-16) (Spearman’s Rank Correlation (p-value<0.05 and coefficient<-0.25)) |
| Cancer type | miRNA id | miRNA accession | P-val. | Coeff. | # samples |
| ACC | hsa-miR-106a-5p | MIMAT0000103 | 0.011 | -0.3 | 78 |
| ACC | hsa-miR-106a-5p | MIMAT0000103 | 0.011 | -0.3 | 78 |
| Top |
| TissGeneMut for FAM19A1 |
| TissGeneSNV for FAM19A1 |
| nsSNV counts per each loci. Different colors of circles represent different cancer types. Circle size denotes number of samples. (TCGA somatic mutation (SNPs and small INDELs) data, version 2016-04-25) * Click on the image to enlarge it in a new window. |
 |
 |
| Somatic nucleotide variants of TissGene across 28 cancer types (X-axis: cancer type and Y-axis: % of mutated samples) The numbers in parentheses are numbers of samples with mutation (nsSNVs). (TCGA somatic mutation (SNPs and small INDELs) data, version 2016-04-25) |
 |
| - nsSNVs sorted by frequency. |
| AAchange | Cancer type | # samples |
| p.G41R | SKCM | 3 |
| p.M98I | SKCM | 2 |
| p.W14* | SKCM | 2 |
| p.W14X | SKCM | 2 |
| p.P39T | SKCM | 1 |
| p.E99* | LUAD | 1 |
| p.W116* | SKCM | 1 |
| p.K55R | ESCA | 1 |
| p.G104E | SKCM | 1 |
| p.C118F | LIHC | 1 |
| p.R79K | SKCM | 1 |
| p.R81Q | READ | 1 |
| p.S68F | SKCM | 1 |
| p.S26F | SKCM | 1 |
| p.E103Q | LUAD | 1 |
| p.R81W | GBM | 1 |
| p.D86G | KIRC | 1 |
| p.Y12C | UCEC | 1 |
| p.R61W | UCEC | 1 |
| p.A48T | HNSC | 1 |
| p.W95L | SKCM | 1 |
| p.R57C | SKCM | 1 |
| p.P111S | SKCM | 1 |
| p.H24N | LUAD | 1 |
| p.R57C | COAD | 1 |
| p.F31L | LUAD | 1 |
| p.A75T | UCEC | 1 |
| p.R61W | OV | 1 |
| p.M98I | LUSC | 1 |
| p.L11P | HNSC | 1 |
| p.N56T | READ | 1 |
| p.A119T | COAD | 1 |
| p.I47M | LUSC | 1 |
| p.R57C | UCEC | 1 |
| p.C23F | DLBC | 1 |
| p.K66M | SKCM | 1 |
| p.W116X | SKCM | 1 |
| p.C18F | LUAD | 1 |
| p.K125R | SKCM | 1 |
| p.K73E | CESC | 1 |
| p.L13F | LUSC | 1 |
| Top |
| TissGeneCNV for FAM19A1 |
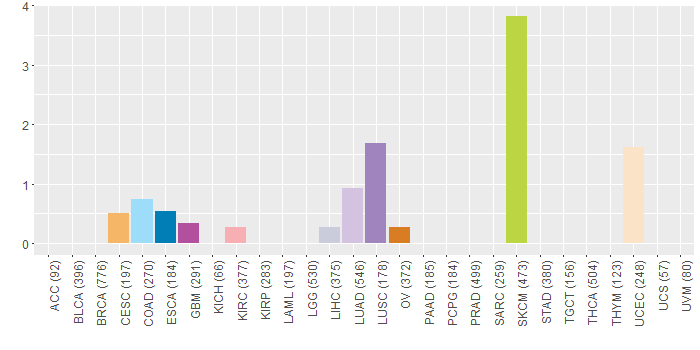
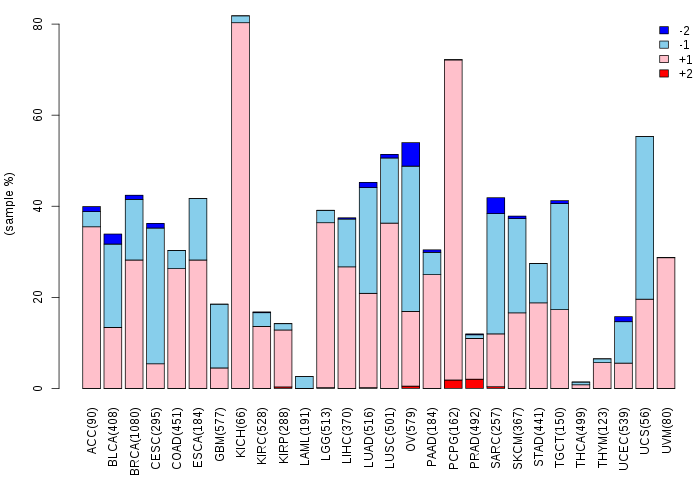
| Copy number variations of TissGene across 28 cancer types (X-axis: cancer type and Y-axis: % of CNV samples) (TCGA Gistic2_CopyNumber_Gistic2_all_data_by_genes, Gistic2 copy number data, version 2016-08-16) |
 |
| Top |
| TissGeneFusions for FAM19A1 |
| Fusion genes including TissGene (ChimerDB 3.0, 2016-12-01 and TCGA fusion Portal 2015-12-01) |
| Database | Src | Cancer type | Sample | Fusion gene | ORF | 5'-gene BP | 3'-gene BP |
| Chimerdb3.0 | ChiTaRs | NA | AA412313 | FAM19A1-LYST | chr3:68550279 | chr1:235992117 | |
| Chimerdb3.0 | ChiTaRs | NA | BE694718 | COPS8-FAM19A1 | chr2:238006592 | chr3:68194647 | |
| Chimerdb3.0 | ChiTaRs | NA | CR745606 | FAM19A1-LYST | chr3:68550039 | chr1:235992147 | |
| Chimerdb3.0 | TopHat-Fusion | STAD | TCGA-LN-A9FR-01A5 | COPS8-FAM19A1 | 5'UTR-CDS | chr2:237994566 | chr3:68194466 |
| TCGAfusionPortal | PRADA | KIRC | TCGA-B8-4143-01A | SLC25A26-FAM19A1 | Out-of-frame | Chr3:66396832 | Chr3:68587907 |
| Top |
| TissGeneNet for FAM19A1 |
| Co-expressed gene networks based on protein-protein interaction data (CePIN) (TCGA IlluminaHiSeq_RNASeqV2, pan-cancer normalized log2(norm_counts+1) data, version 2016-08-16) (PINA2 ppi data) |
| Top |
| TissGeneProg for FAM19A1 |
| Kaplan-Meier plots with logrank tests of overall survival (OS) using 28 cancer types (TCGA IlluminaHiSeq_RNASeqV2, pan-cancer normalized log2(norm_counts+1) data, version 2016-08-16) (TCGA clinicalMatrix, phenotype data, version 2016-04-27) * Click on the image to enlarge it in a new window. |
 |
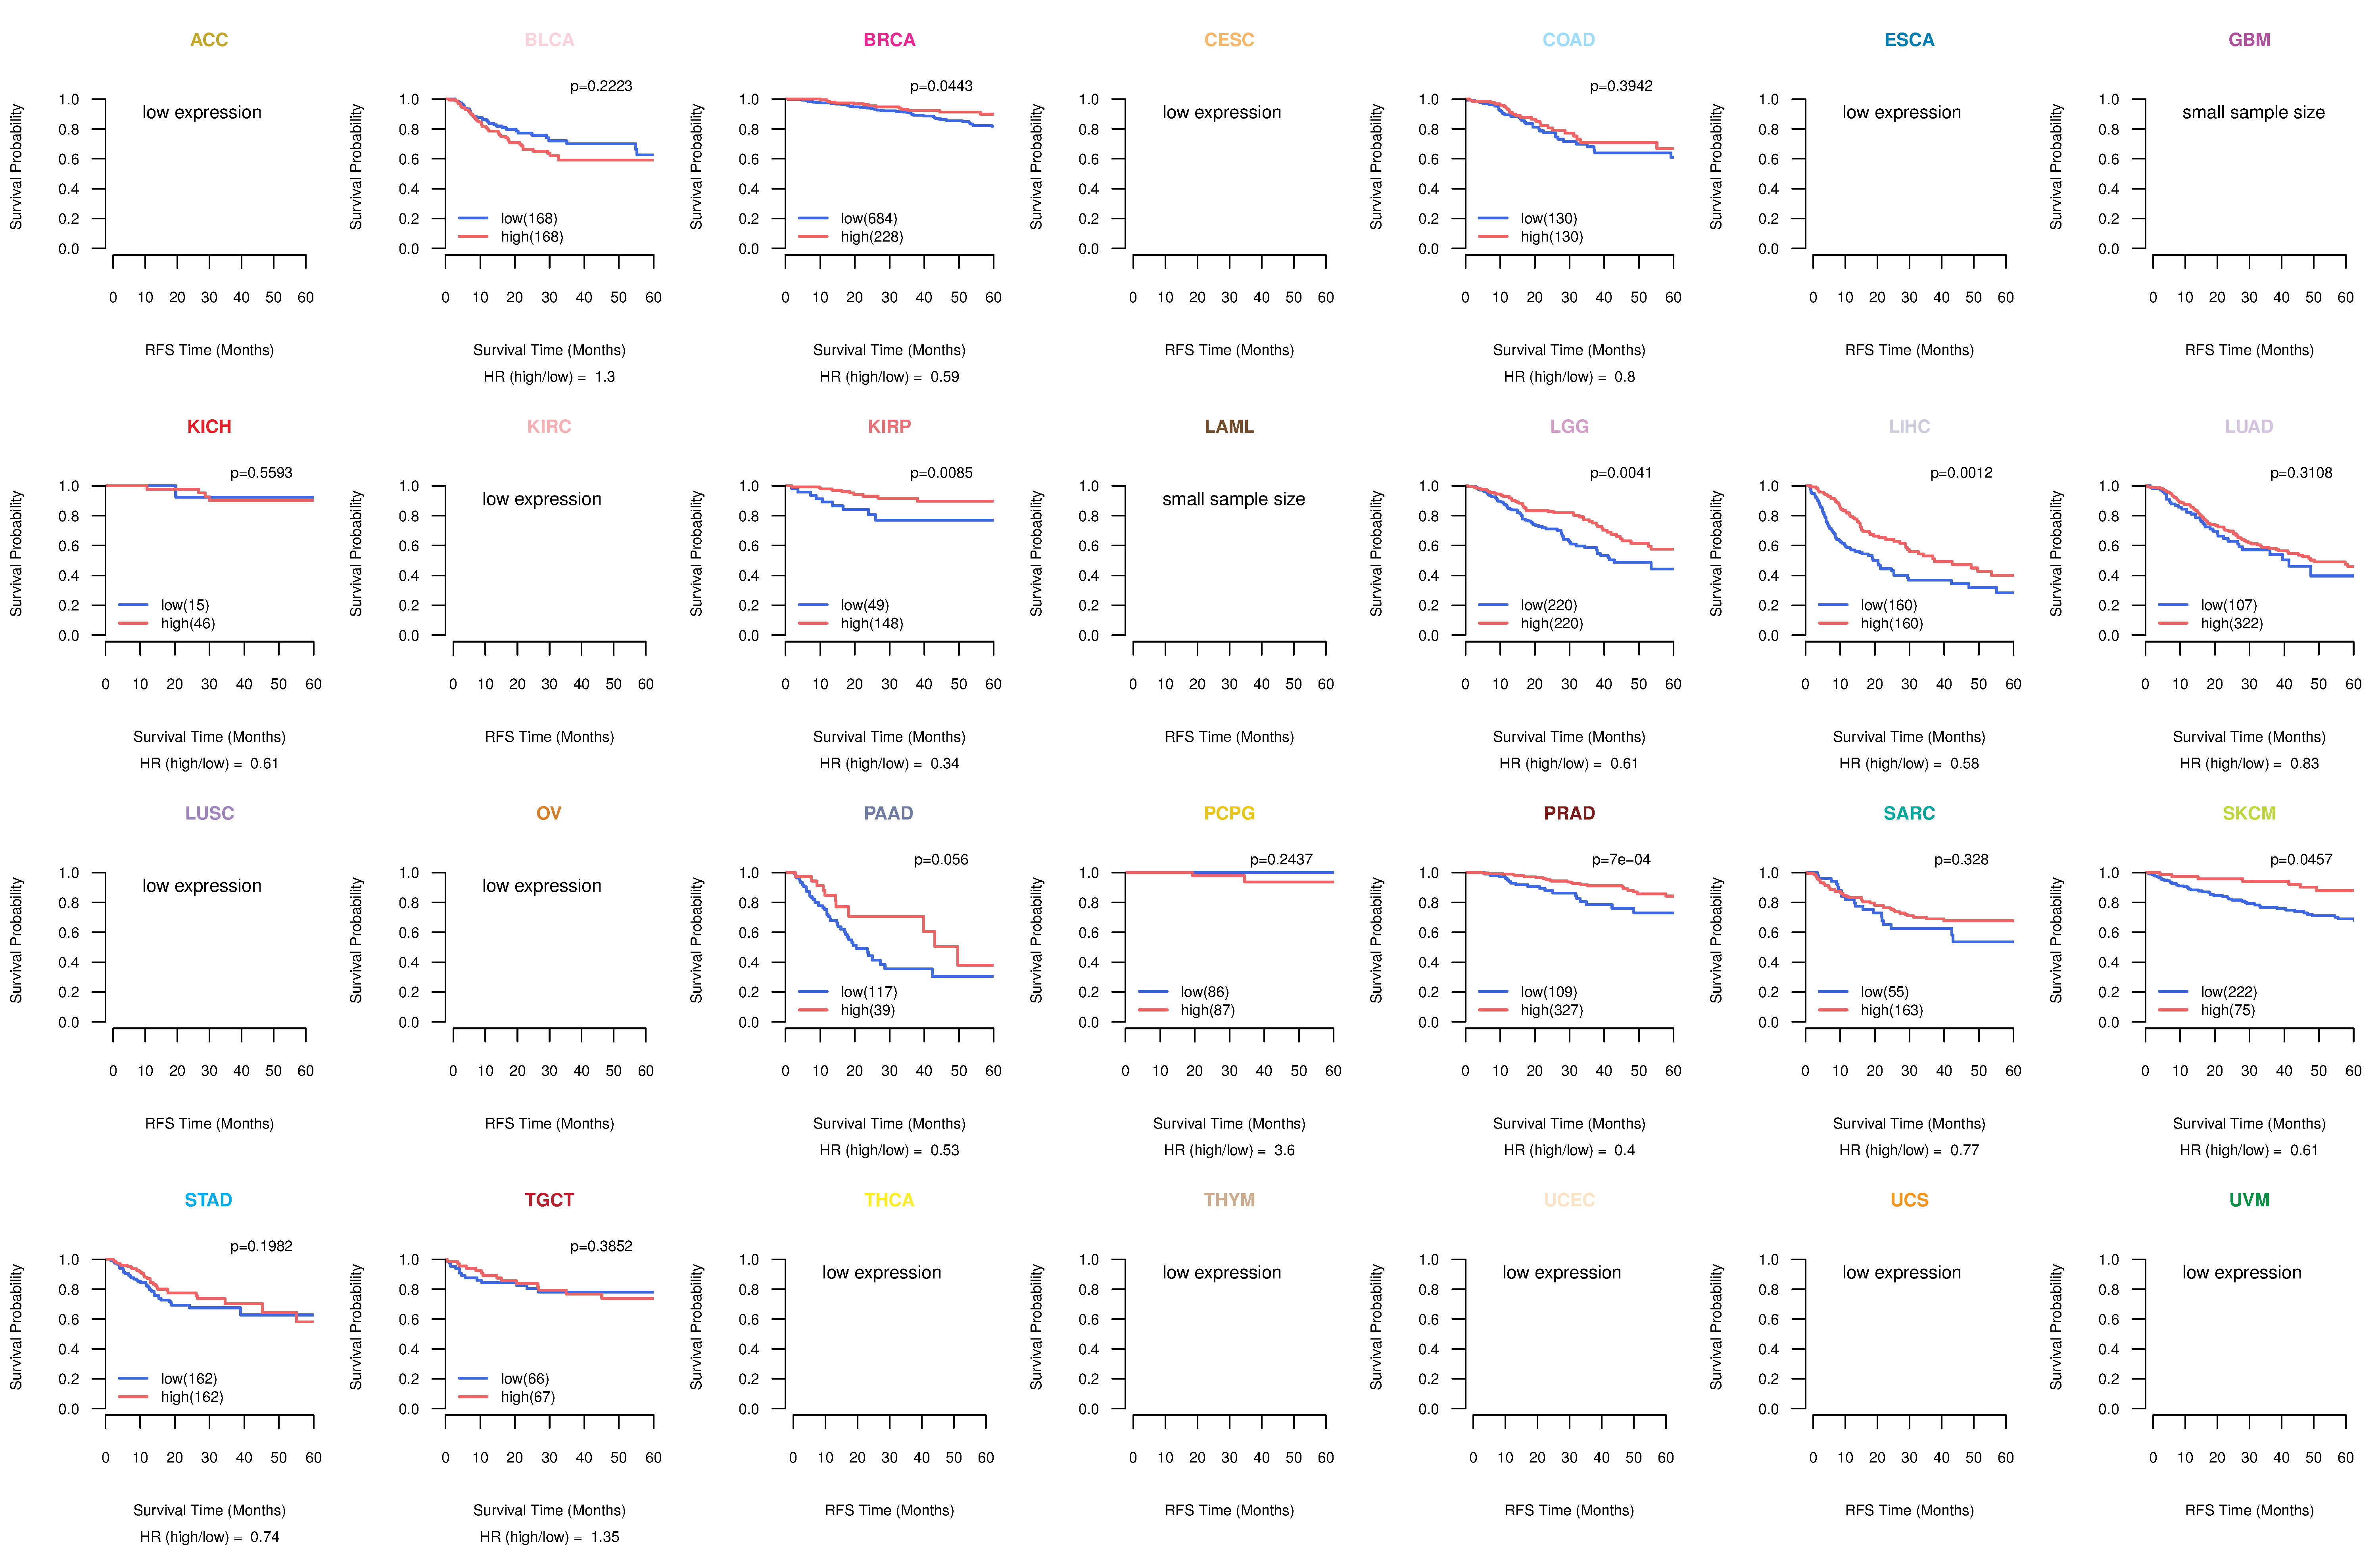
| Kaplan-Meier plots with logrank test of relapse free survival (RFS) using 28 cancer types (TCGA IlluminaHiSeq_RNASeqV2, pan-cancer normalized log2(norm_counts+1) data, version 2016-08-16) (TCGA clinicalMatrix, phenotype data, version 2016-04-27) * Click on the image enlarge it in a new window. |
 |
| Forest plot of Cox proportional hazard ratio (HR) and 95% CI of overall survival (OS) using 28 cancer types (TCGA IlluminaHiSeq_RNASeqV2, pan-cancer normalized log2(norm_counts+1) data, version 2016-08-16) (TCGA clinicalMatrix, phenotype data, version 2016-04-27) * Click on the image enlarge it in a new window. |
 |
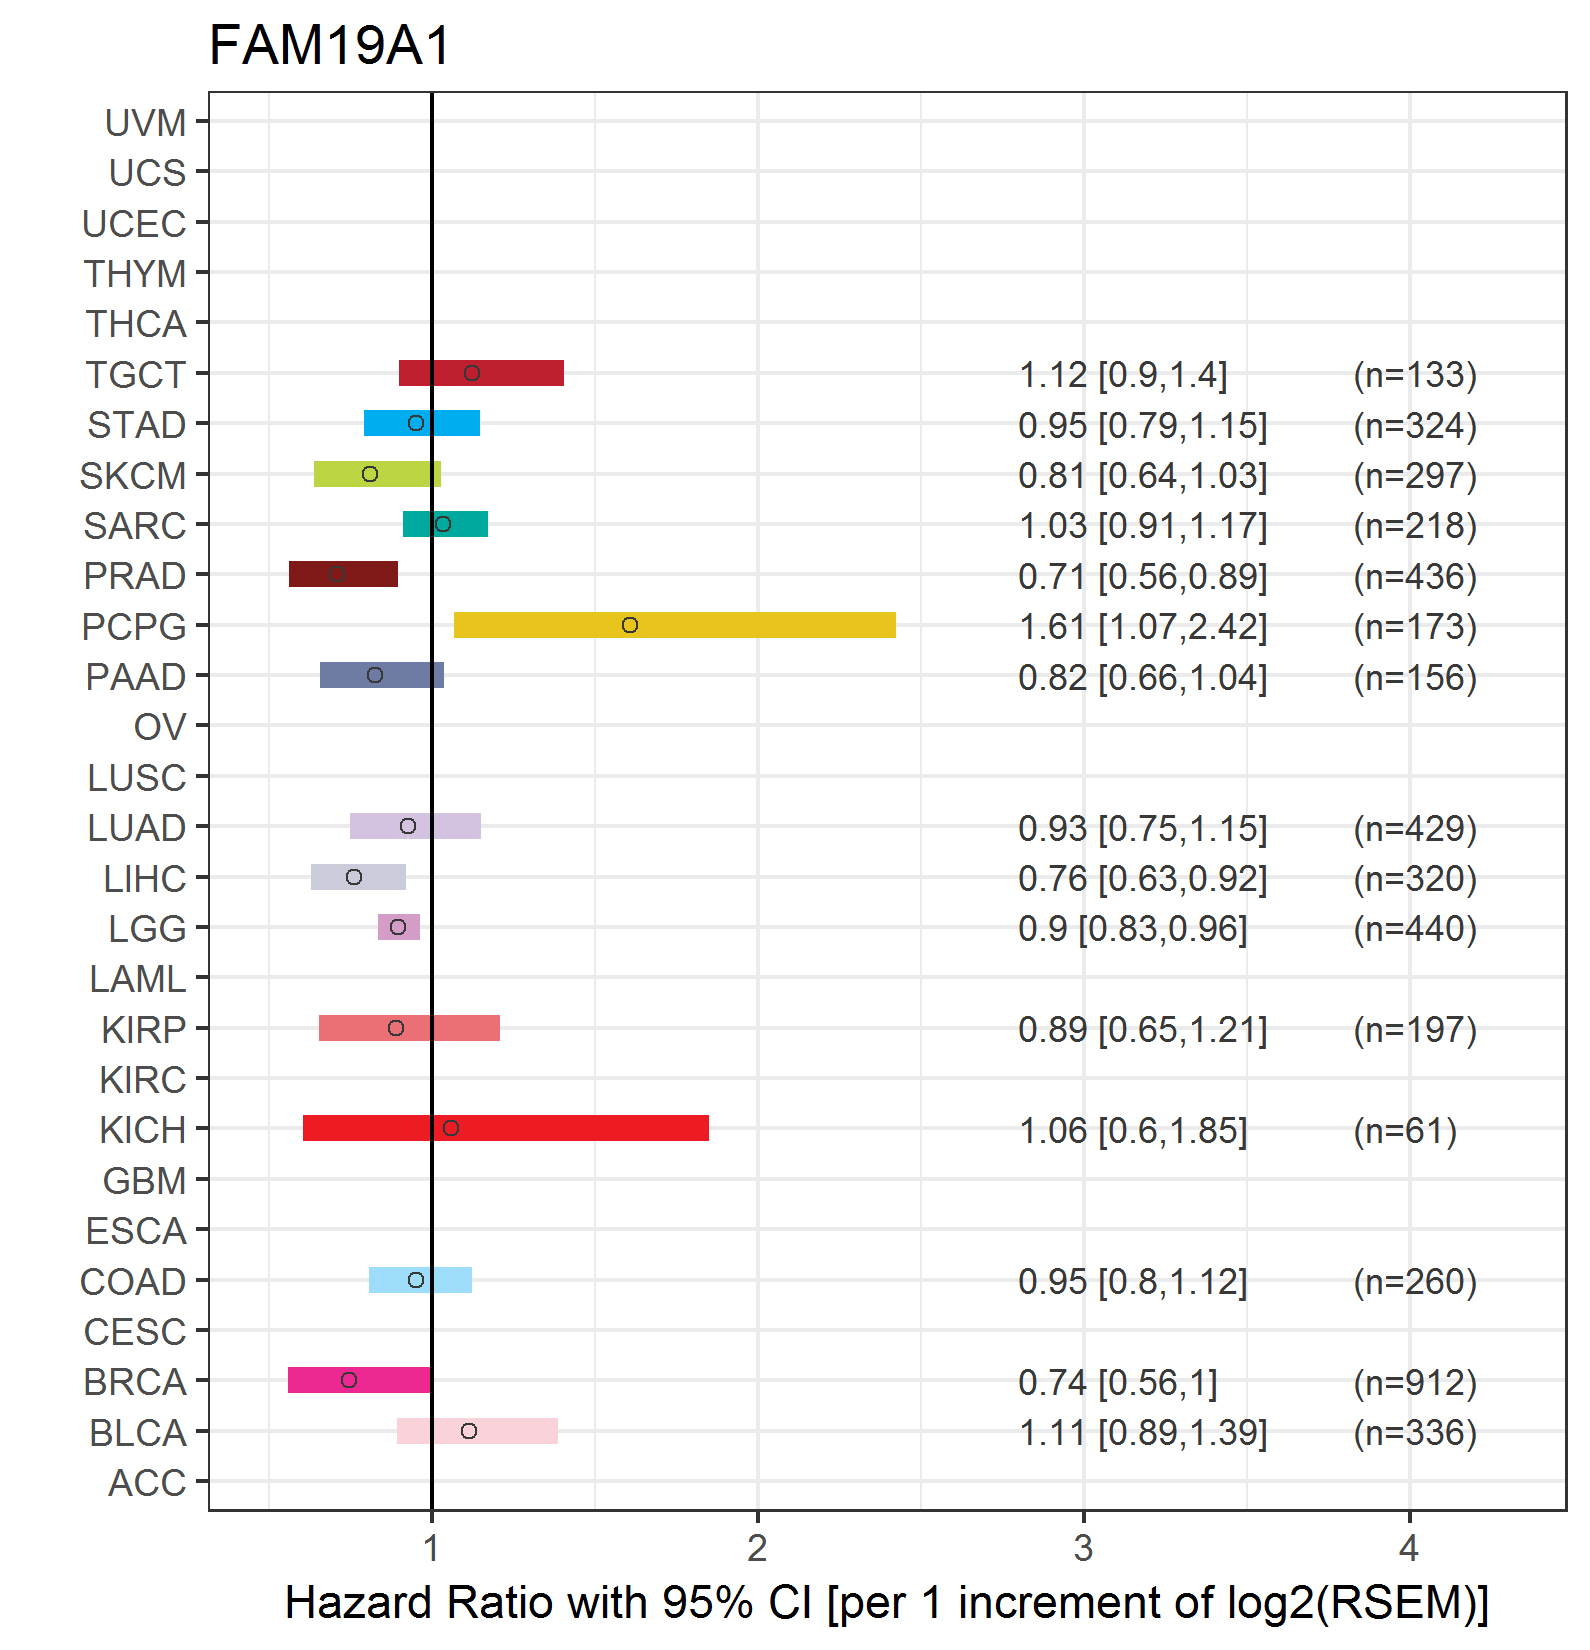
| Forest plot of Cox proportional hazard ratio (HR) and 95% CI of relapse free survival (RFS) using 28 cancer types (TCGA IlluminaHiSeq_RNASeqV2, pan-cancer normalized log2(norm_counts+1) data, version 2016-08-16) (TCGA clinicalMatrix, phenotype data, version 2016-04-27) * Click on the image enlarge it in a new window. |
 |
| Top |
| TissGeneClin for FAM19A1 |
| TissGeneDrug for FAM19A1 |
| Drug information targeting TissGene (DrugBank Version 5.0.6, 2017-04-01) |
| DrugBank ID | Drug name | Drug activity | Drug type | Drug status |
| Top |
| TissGeneDisease for FAM19A1 |
| Disease information associated with TissGene (DisGeNet, 2016-06-01) |
| Disease ID | Disease name | # pubmeds | Source |
| umls:C0011860 | Diabetes Mellitus, Non-Insulin-Dependent | 1 | GAD |
| umls:C0027092 | Myopia | 1 | GAD |
| umls:C0086543 | Cataract | 1 | GAD |
|
Copyright 2016-Present - The University of Texas Health Science Center at Houston (UTHealth) Web File Viewing | How to Report, Fraud, Waste and Abuse | State of Texas | Statewide Search | Texas Homeland Security | Site Policies |