 |
| |
| |
| |
| |
| |
| |
|

| TissGeneSummary for MAB21L1 |
 Gene summary Gene summary |
| Basic gene information | Gene symbol | MAB21L1 |
| Gene name | mab-21-like 1 (C. elegans) | |
| Synonyms | CAGR1 | |
| Cytomap | UCSC genome browser: 13q13 | |
| Type of gene | protein-coding | |
| RefGenes | NM_005584.4, | |
| Description | mab-21-like protein 1protein mab-21-like 1 | |
| Modification date | 20141207 | |
| dbXrefs | MIM : 601280 | |
| HGNC : HGNC | ||
| HPRD : 03178 | ||
| Protein | UniProt: go to UniProt's Cross Reference DB Table | |
| Expression | CleanEX: HS_MAB21L1 | |
| BioGPS: 4081 | ||
| Pathway | NCI Pathway Interaction Database: MAB21L1 | |
| KEGG: MAB21L1 | ||
| REACTOME: MAB21L1 | ||
| Pathway Commons: MAB21L1 | ||
| Context | iHOP: MAB21L1 | |
| ligand binding site mutation search in PubMed: MAB21L1 | ||
| UCL Cancer Institute: MAB21L1 | ||
| Assigned class in TissGDB* | C | |
| Included tissue-specific gene expression resources | TiGER,GTEx | |
| Specific-tissues in normal samples (assigned by TissGDB using HPA, TiGER, and GTEx) | BreastEye | |
| Cancer types related to the specific-tissues in cancer samples (assigned by TissGDB using TCGA) | BRCAUVM | |
| Reference showing the relevant tissue of MAB21L1 | ||
| Description by TissGene annotations | ||
| * Class A consists of genes with literature evidence and is part of the cTissGenes. Class B consists of only cTissGenes without additional evidence. The remaining genes belong to Class C. |
| Gene ontology having evidence of Inferred from Direct Assay (IDA) from Entrez |
| GO ID | GO term | PubMed ID |
| Top |
| TissGeneExp for MAB21L1 |
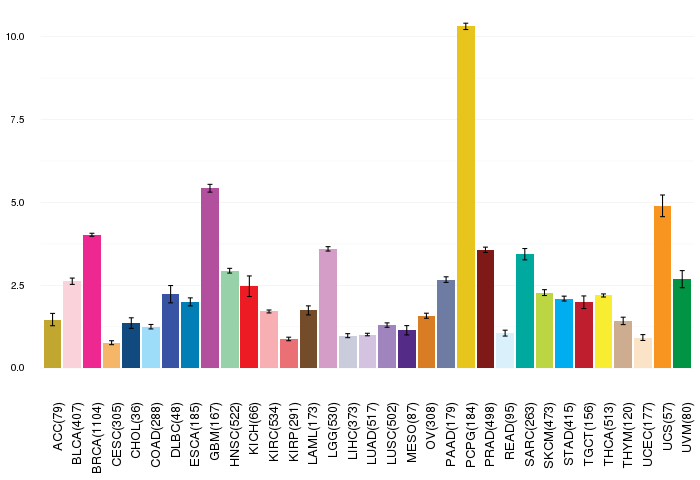
| Gene expressions across 28 cancer types (X-axis: cancer type and Y-axis: log2(norm_counts+1)) (TCGA IlluminaHiSeq_RNASeqV2, pan-cancer normalized log2(norm_counts+1) data, version 2016-08-16) |
 |
| Gene isoform expressions across 28 cancer types (X-axis: cancer type and Y-axis: log2(norm_counts+1)) (TCGA pan-cancer tcga_rsem_isoform_tpm, version 2016-09-01) |
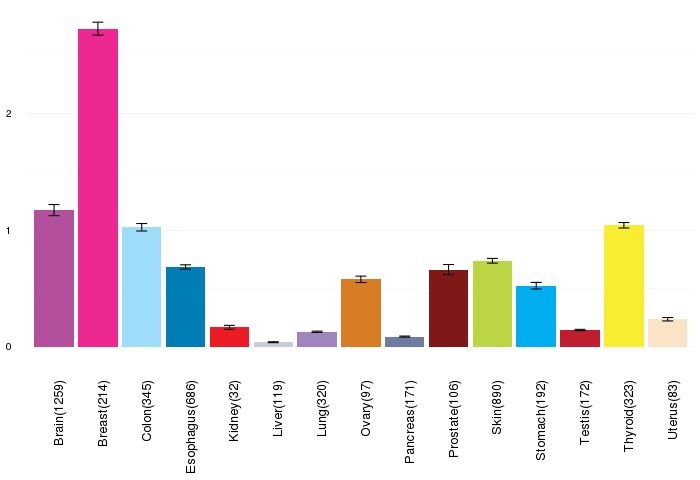
| Gene expressions across normal tissues of GTEx data (GTEx GTEx_Analysis_v6_RNA-seq_RNA-SeQCv1.1.8_gene_rpkm.gct) - Here, we shows the matched tissue types only among our 28 cancer types. |
 |
| Different expressions across 14 cancer types with more than 10 samples between matched tumors and normals (X-axis: cancer type and Y-axis: log2(norm_counts+1)) (TCGA IlluminaHiSeq_RNASeqV2, pan-cancer normalized log2(norm_counts+1) data, version 2016-08-16) |
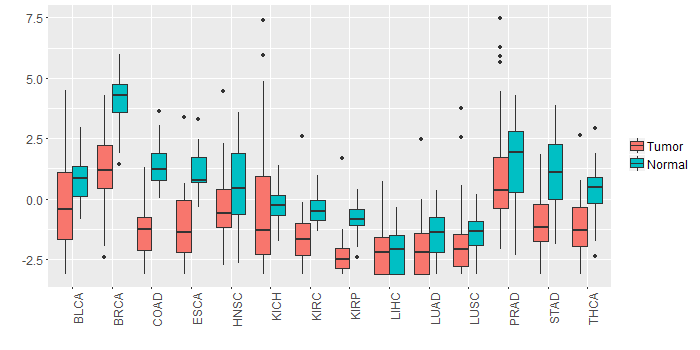 |
| - Significantly differentially expressed cancer types and information. (|Fold change|>1 and FDR<0.05) |
| Cancer type | Mean(exp) in tumor | Mean(exp) in matched normal | Log2FC | P-val. | FDR |
| THCA | -1.167509595 | 0.38020905 | -1.547718644 | 4.18E-12 | 3.35E-11 |
| KIRP | -2.322800908 | -0.818919658 | -1.50388125 | 2.06E-10 | 2.21E-09 |
| STAD | -0.940244658 | 1.144542842 | -2.0847875 | 4.87E-08 | 1.52E-06 |
| COAD | -1.307869177 | 1.378500053 | -2.686369231 | 6.12E-12 | 1.30E-10 |
| BRCA | 1.173139662 | 4.156594925 | -2.983455263 | 2.84E-45 | 1.26E-43 |
| KIRC | -1.638363408 | -0.435752297 | -1.202611111 | 2.44E-15 | 1.25E-14 |
| ESCA | -0.916011135 | 1.174652501 | -2.090663636 | 0.00617 | 0.045437351 |
| Top |
| TissGene-miRNA for MAB21L1 |
| Significantly anti-correlated miRNAs of TissGene across 28 cancer types (Gene-miRNA relations from TargetScanHuman Relsease 7.1, Conserved_Site_Context_Scores.txt.zip, 06.01.2016) (TCGA IlluminaHiSeq_miRNASeq, log2(RPM+1) data, version 2016-11-21) (TCGA IlluminaHiSeq_RNASeqV2, log2(normalized_count+1) data, version 2016-08-16) (Spearman’s Rank Correlation (p-value<0.05 and coefficient<-0.25)) |
| Cancer type | miRNA id | miRNA accession | P-val. | Coeff. | # samples |
| Top |
| TissGeneMut for MAB21L1 |
| TissGeneSNV for MAB21L1 |
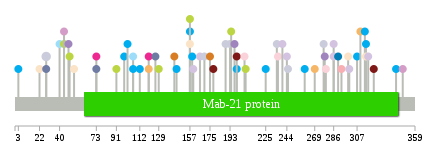
| nsSNV counts per each loci. Different colors of circles represent different cancer types. Circle size denotes number of samples. (TCGA somatic mutation (SNPs and small INDELs) data, version 2016-04-25) * Click on the image to enlarge it in a new window. |
 |
 |
| Somatic nucleotide variants of TissGene across 28 cancer types (X-axis: cancer type and Y-axis: % of mutated samples) The numbers in parentheses are numbers of samples with mutation (nsSNVs). (TCGA somatic mutation (SNPs and small INDELs) data, version 2016-04-25) |
 |
| - nsSNVs sorted by frequency. |
| AAchange | Cancer type | # samples |
| p.A28D | LIHC | 2 |
| p.R199Q | PRAD | 1 |
| p.L189P | LIHC | 1 |
| p.A22T | UCEC | 1 |
| p.G245D | LIHC | 1 |
| p.R315W | UCEC | 1 |
| p.E206* | BLCA | 1 |
| p.E73K | PAAD | 1 |
| p.R260H | STAD | 1 |
| p.Q48H | LUSC | 1 |
| p.P286L | LUAD | 1 |
| p.E348Q | LGG | 1 |
| p.R299W | UCEC | 1 |
| p.K175N | OV | 1 |
| p.L160P | LUAD | 1 |
| p.R106S | STAD | 1 |
| p.D40N | COAD | 1 |
| p.C35X | READ | 1 |
| p.S279P | BLCA | 1 |
| p.A28V | PAAD | 1 |
| p.S120C | CESC | 1 |
| p.E157K | UCEC | 1 |
| p.A3V | STAD | 1 |
| p.D290N | ESCA | 1 |
| p.P286T | LUAD | 1 |
| p.D91N | SKCM | 1 |
| p.L307R | STAD | 1 |
| p.L112V | STAD | 1 |
| p.A125V | READ | 1 |
| p.S120C | BRCA | 1 |
| p.K159T | STAD | 1 |
| p.C310Y | CESC | 1 |
| p.T342M | STAD | 1 |
| p.E44K | LGG | 1 |
| p.C143Y | OV | 1 |
| p.R163Q | READ | 1 |
| p.P193T | LIHC | 1 |
| p.E49K | SKCM | 1 |
| p.Y145N | STAD | 1 |
| p.E236K | BLCA | 1 |
| p.L277P | LIHC | 1 |
| p.L269F | CESC | 1 |
| p.A98V | STAD | 1 |
| p.R126H | PAAD | 1 |
| p.I170F | LIHC | 1 |
| p.I53M | UCEC | 1 |
| p.R315Q | STAD | 1 |
| p.L300P | LUAD | 1 |
| p.E73K | BRCA | 1 |
| p.A26V | HNSC | 1 |
| p.G178R | PRAD | 1 |
| p.V158M | HNSC | 1 |
| p.R240I | LUAD | 1 |
| p.P197H | LUSC | 1 |
| p.A225V | STAD | 1 |
| p.R314L | STAD | 1 |
| p.G207S | SKCM | 1 |
| p.P317R | LUAD | 1 |
| p.R199W | STAD | 1 |
| p.E157K | STAD | 1 |
| p.P322Q | PRAD | 1 |
| p.A235V | LIHC | 1 |
| p.W194C | SKCM | 1 |
| p.V278A | LUSC | 1 |
| p.E44K | SKCM | 1 |
| p.G244V | LUAD | 1 |
| p.R129W | SKCM | 1 |
| p.E293V | KIRC | 1 |
| p.E157K | SKCM | 1 |
| p.R106H | COAD | 1 |
| p.K101N | STAD | 1 |
| p.Y166* | LUAD | 1 |
| Top |
| TissGeneCNV for MAB21L1 |
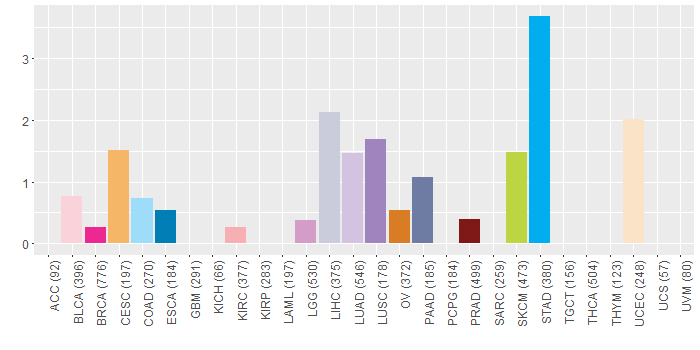
| Copy number variations of TissGene across 28 cancer types (X-axis: cancer type and Y-axis: % of CNV samples) (TCGA Gistic2_CopyNumber_Gistic2_all_data_by_genes, Gistic2 copy number data, version 2016-08-16) |
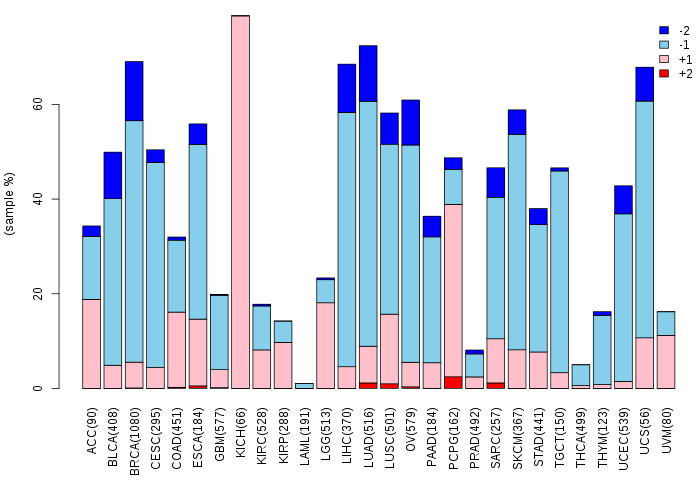 |
| Top |
| TissGeneFusions for MAB21L1 |
| Fusion genes including TissGene (ChimerDB 3.0, 2016-12-01 and TCGA fusion Portal 2015-12-01) |
| Database | Src | Cancer type | Sample | Fusion gene | ORF | 5'-gene BP | 3'-gene BP |
| Top |
| TissGeneNet for MAB21L1 |
| Co-expressed gene networks based on protein-protein interaction data (CePIN) (TCGA IlluminaHiSeq_RNASeqV2, pan-cancer normalized log2(norm_counts+1) data, version 2016-08-16) (PINA2 ppi data) |
| Top |
| TissGeneProg for MAB21L1 |
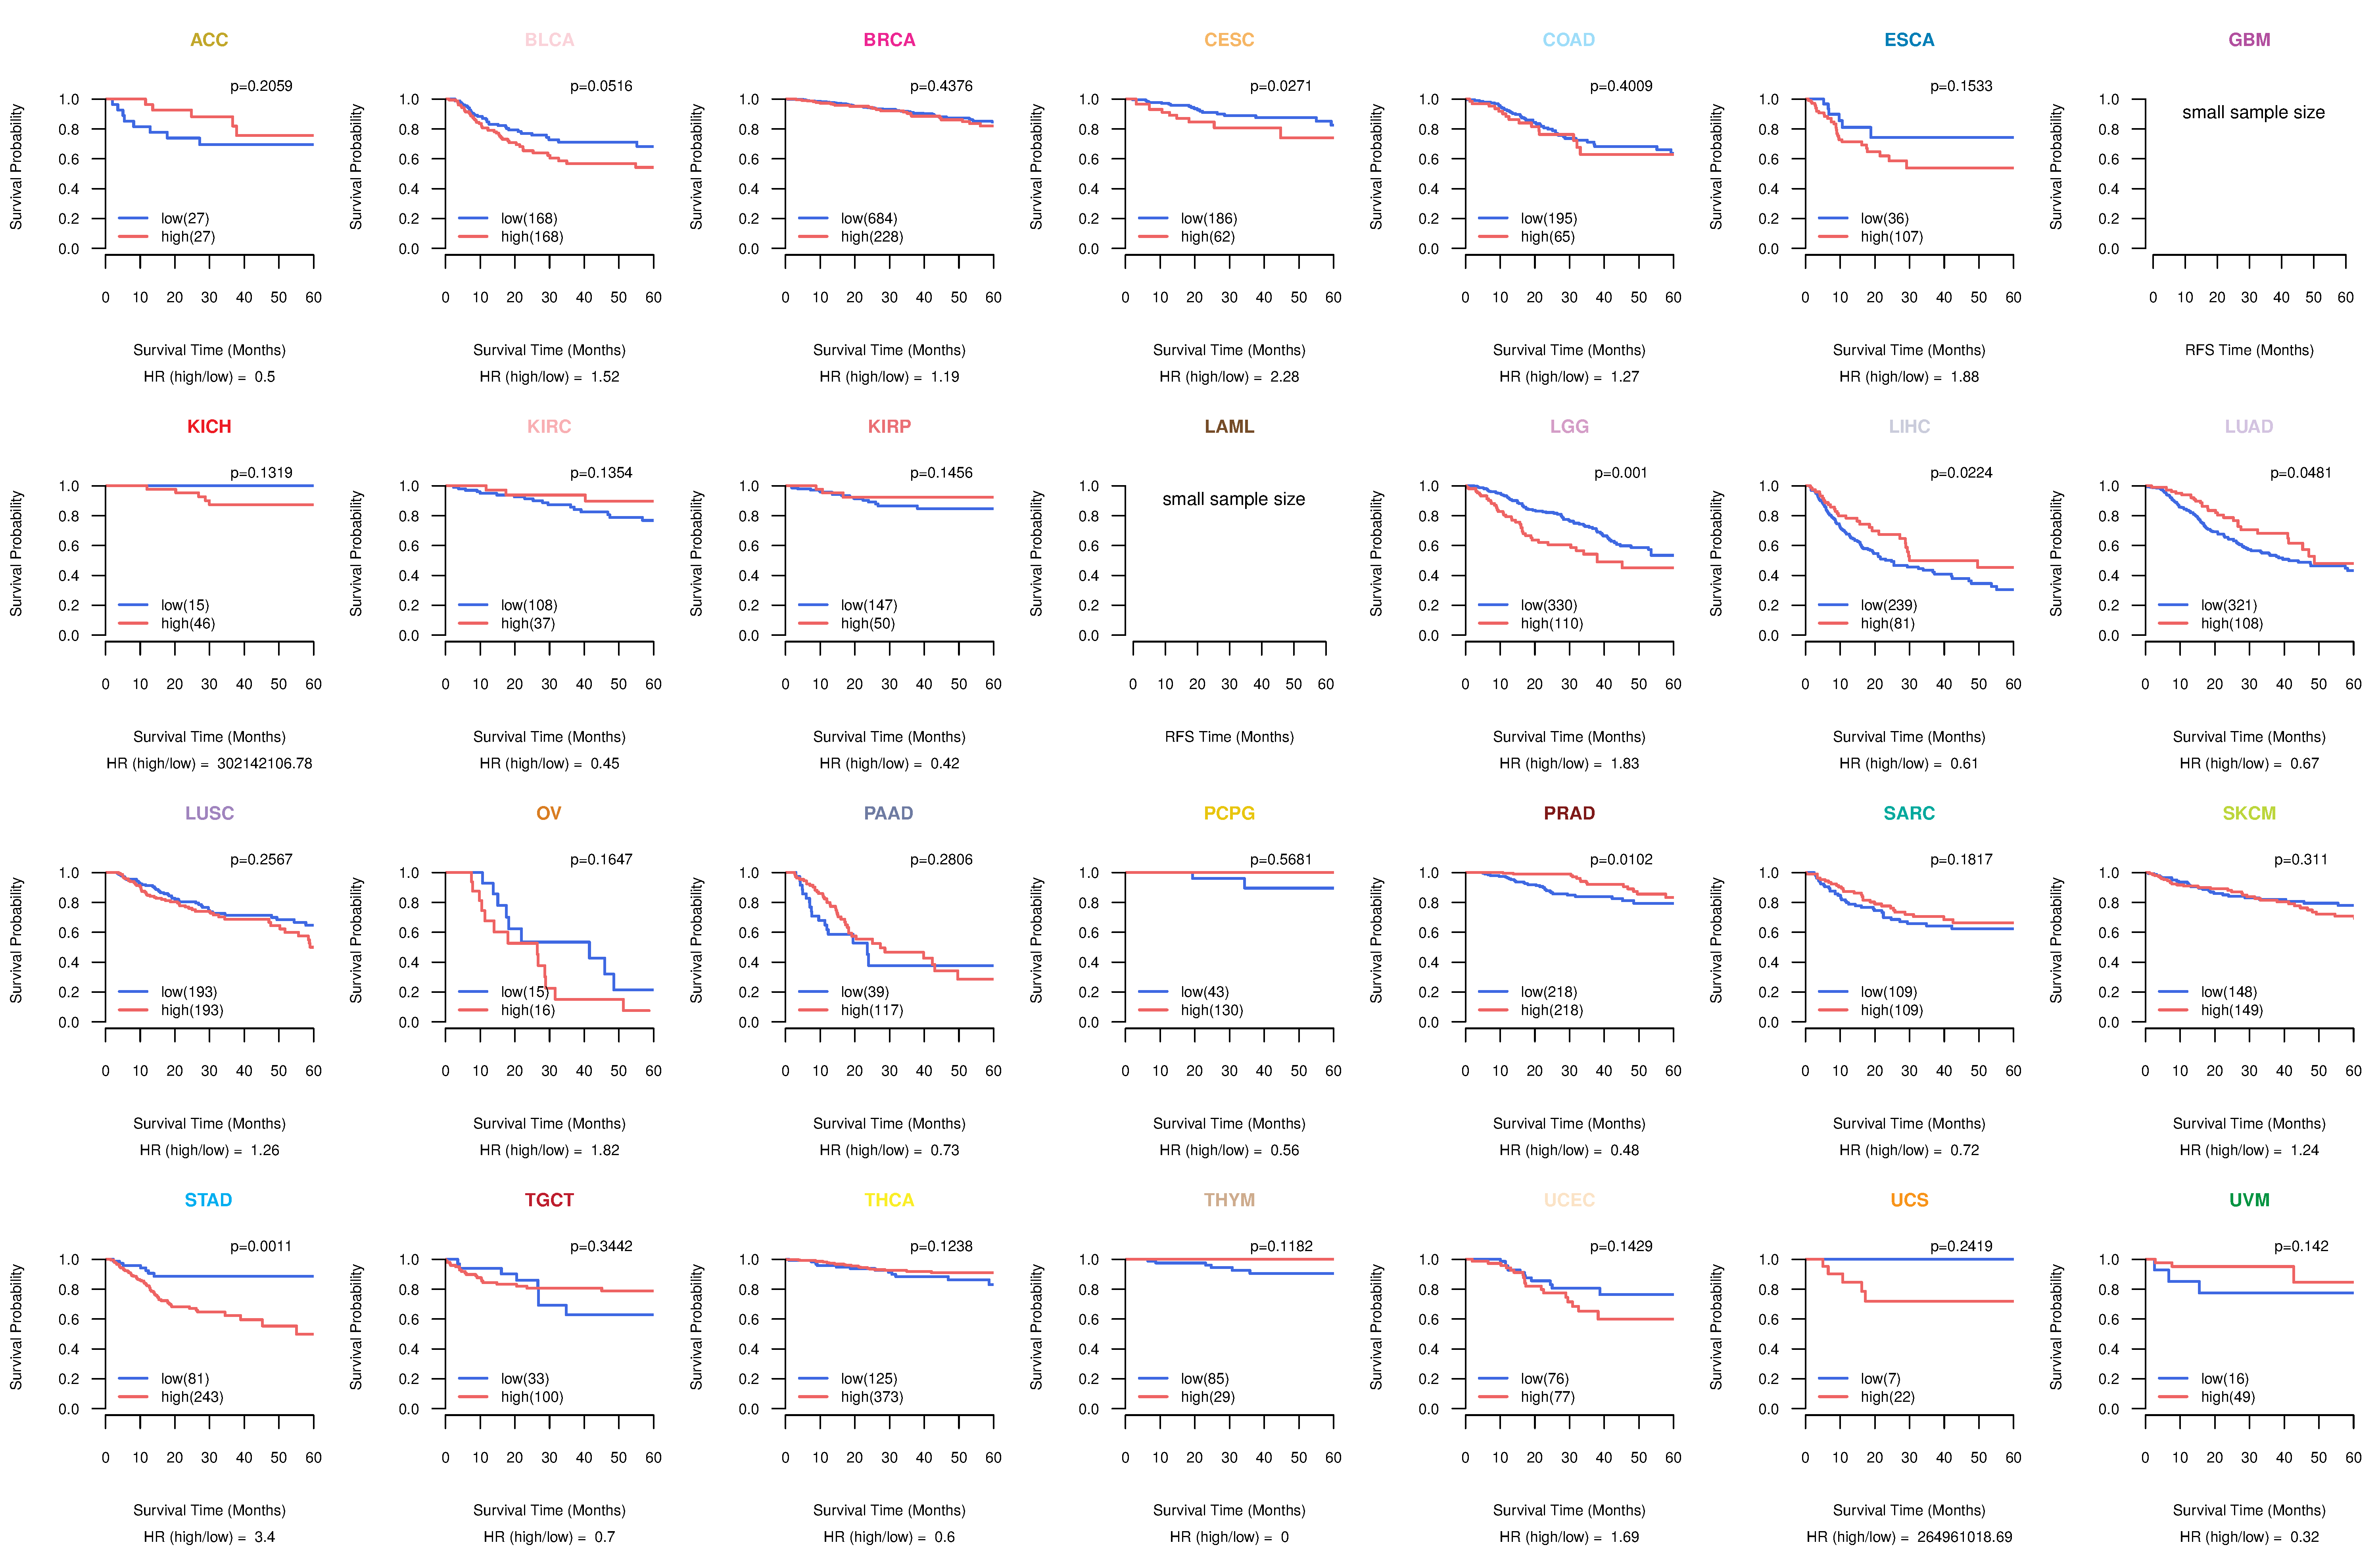
| Kaplan-Meier plots with logrank tests of overall survival (OS) using 28 cancer types (TCGA IlluminaHiSeq_RNASeqV2, pan-cancer normalized log2(norm_counts+1) data, version 2016-08-16) (TCGA clinicalMatrix, phenotype data, version 2016-04-27) * Click on the image to enlarge it in a new window. |
 |
| Kaplan-Meier plots with logrank test of relapse free survival (RFS) using 28 cancer types (TCGA IlluminaHiSeq_RNASeqV2, pan-cancer normalized log2(norm_counts+1) data, version 2016-08-16) (TCGA clinicalMatrix, phenotype data, version 2016-04-27) * Click on the image enlarge it in a new window. |
 |
| Forest plot of Cox proportional hazard ratio (HR) and 95% CI of overall survival (OS) using 28 cancer types (TCGA IlluminaHiSeq_RNASeqV2, pan-cancer normalized log2(norm_counts+1) data, version 2016-08-16) (TCGA clinicalMatrix, phenotype data, version 2016-04-27) * Click on the image enlarge it in a new window. |
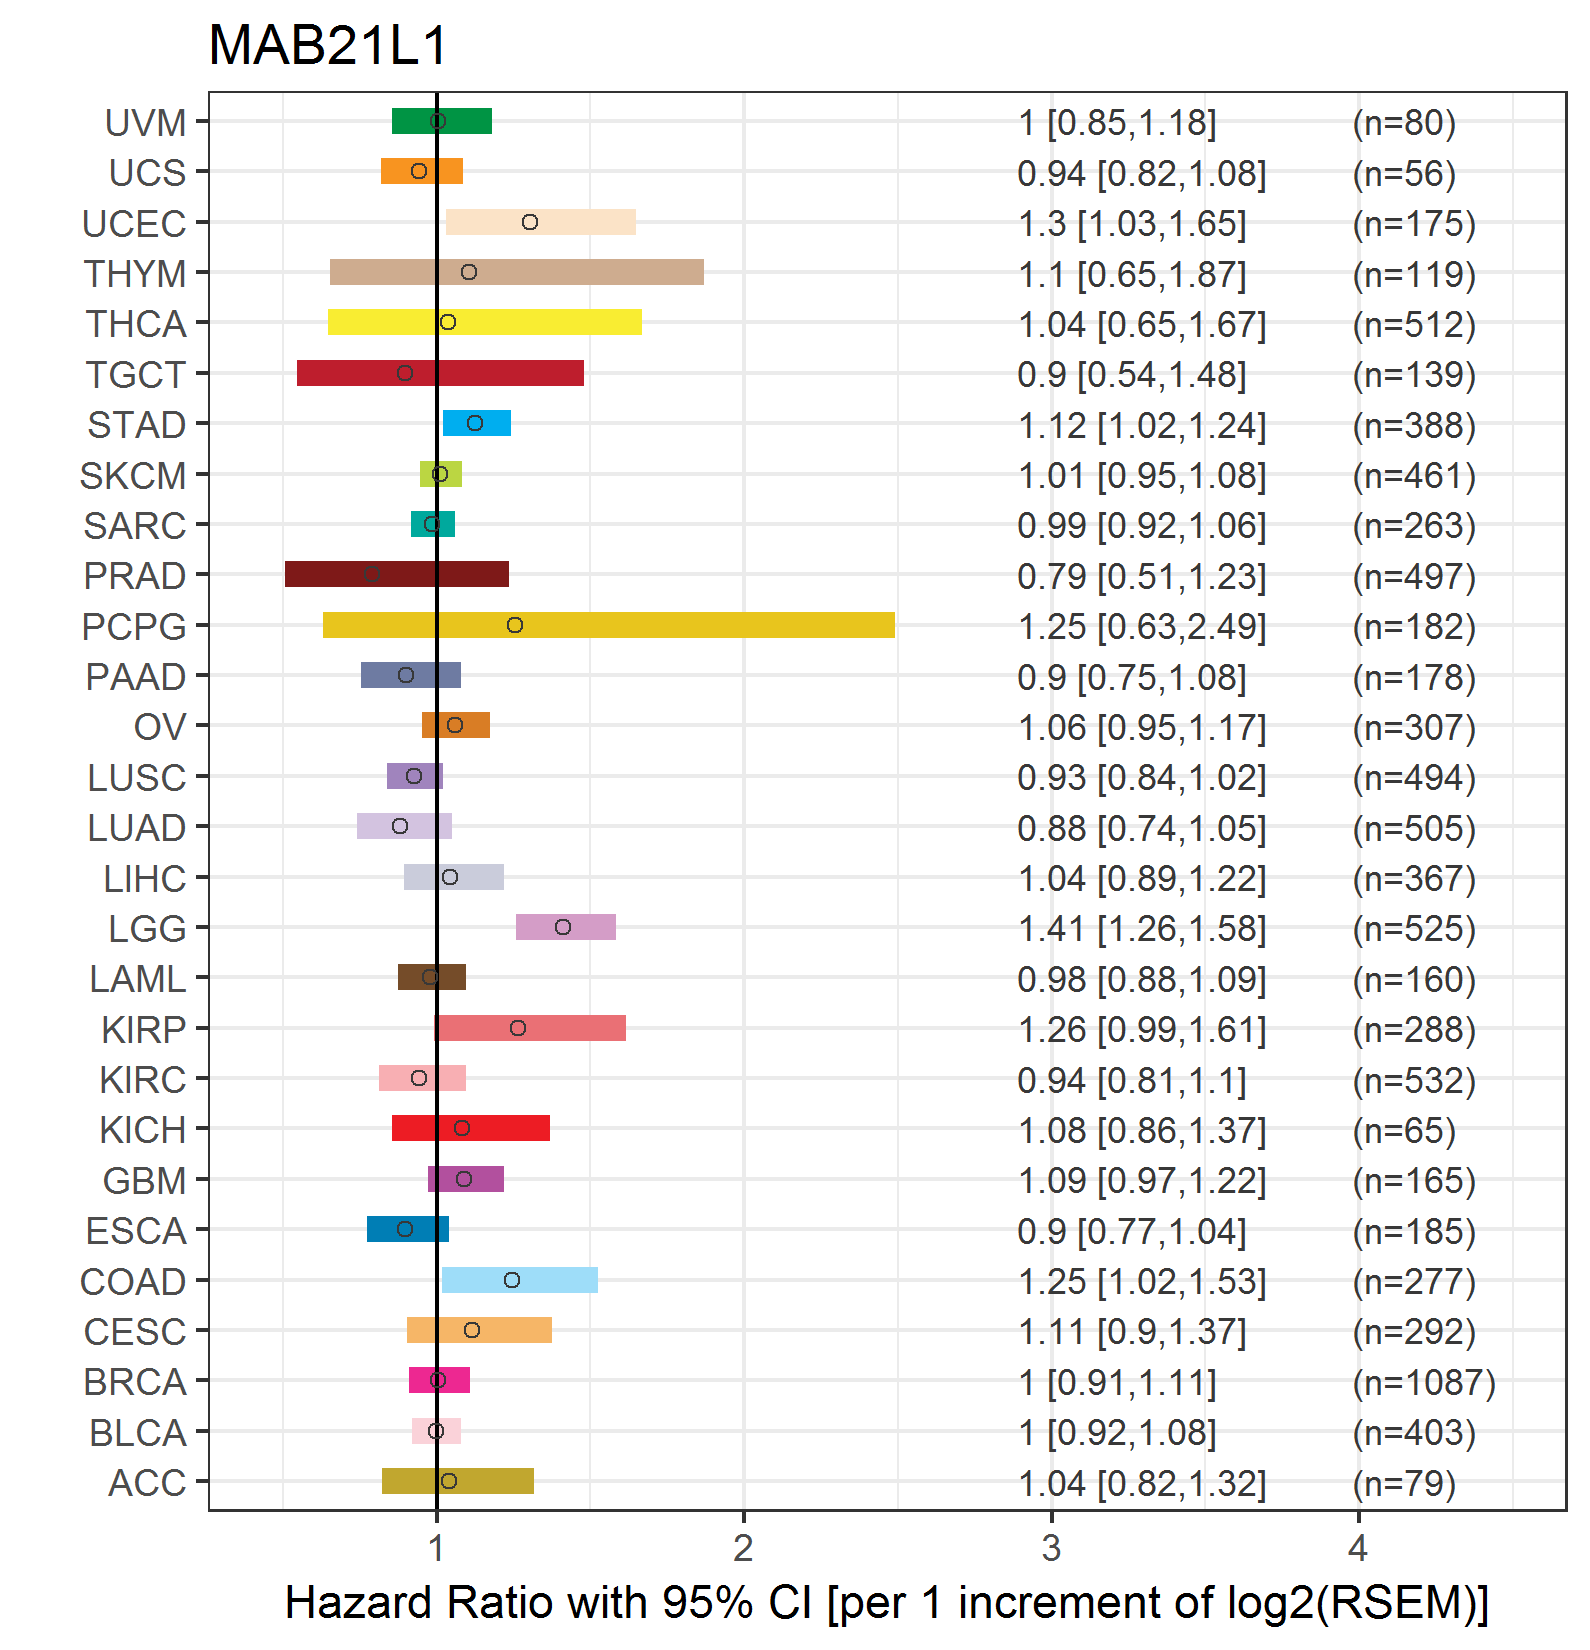 |
| Forest plot of Cox proportional hazard ratio (HR) and 95% CI of relapse free survival (RFS) using 28 cancer types (TCGA IlluminaHiSeq_RNASeqV2, pan-cancer normalized log2(norm_counts+1) data, version 2016-08-16) (TCGA clinicalMatrix, phenotype data, version 2016-04-27) * Click on the image enlarge it in a new window. |
 |
| Top |
| TissGeneClin for MAB21L1 |
| TissGeneDrug for MAB21L1 |
| Drug information targeting TissGene (DrugBank Version 5.0.6, 2017-04-01) |
| DrugBank ID | Drug name | Drug activity | Drug type | Drug status |
| Top |
| TissGeneDisease for MAB21L1 |
| Disease information associated with TissGene (DisGeNet, 2016-06-01) |
| Disease ID | Disease name | # pubmeds | Source |
| umls:C0027765 | nervous system disorder | 1 | BeFree |
|
Copyright 2016-Present - The University of Texas Health Science Center at Houston (UTHealth) Web File Viewing | How to Report, Fraud, Waste and Abuse | State of Texas | Statewide Search | Texas Homeland Security | Site Policies |