 |
| |
| |
| |
| |
| |
| |
|

| TissGeneSummary for ASGR2 |
 Gene summary Gene summary |
| Basic gene information | Gene symbol | ASGR2 |
| Gene name | asialoglycoprotein receptor 2 | |
| Synonyms | ASGP-R2|ASGPR2|CLEC4H2|HBXBP|HL-2 | |
| Cytomap | UCSC genome browser: 17p | |
| Type of gene | protein-coding | |
| RefGenes | NM_001181.4, NM_001201352.1,NM_080912.3,NM_080913.3,NM_080914.2, | |
| Description | C-type lectin domain family 4 member H2HBxAg-binding proteinhepatic lectin H2 | |
| Modification date | 20141207 | |
| dbXrefs | MIM : 108361 | |
| HGNC : HGNC | ||
| Ensembl : ENSG00000161944 | ||
| HPRD : 00152 | ||
| Vega : OTTHUMG00000102158 | ||
| Protein | UniProt: go to UniProt's Cross Reference DB Table | |
| Expression | CleanEX: HS_ASGR2 | |
| BioGPS: 433 | ||
| Pathway | NCI Pathway Interaction Database: ASGR2 | |
| KEGG: ASGR2 | ||
| REACTOME: ASGR2 | ||
| Pathway Commons: ASGR2 | ||
| Context | iHOP: ASGR2 | |
| ligand binding site mutation search in PubMed: ASGR2 | ||
| UCL Cancer Institute: ASGR2 | ||
| Assigned class in TissGDB* | B | |
| Included tissue-specific gene expression resources | HPA,TiGER,GTEx | |
| Specific-tissues in normal samples (assigned by TissGDB using HPA, TiGER, and GTEx) | Liver | |
| Cancer types related to the specific-tissues in cancer samples (assigned by TissGDB using TCGA) | LIHC | |
| Reference showing the relevant tissue of ASGR2 | ||
| Description by TissGene annotations | TissgsKTS CNV gained TissGeneKTS | |
| * Class A consists of genes with literature evidence and is part of the cTissGenes. Class B consists of only cTissGenes without additional evidence. The remaining genes belong to Class C. |
| Gene ontology having evidence of Inferred from Direct Assay (IDA) from Entrez |
| GO ID | GO term | PubMed ID |
| Top |
| TissGeneExp for ASGR2 |
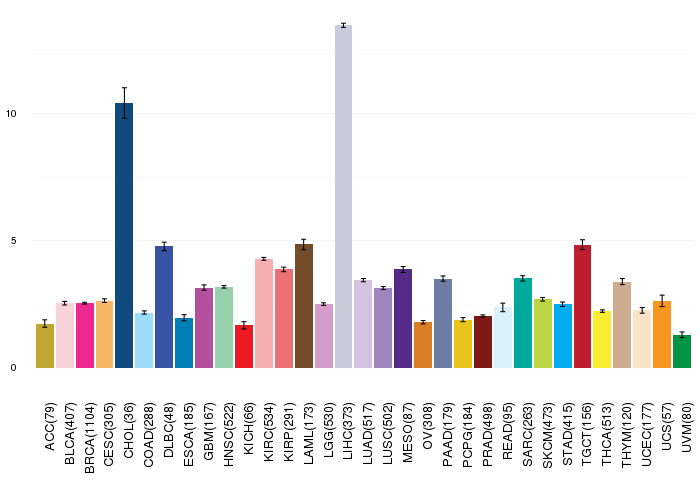
| Gene expressions across 28 cancer types (X-axis: cancer type and Y-axis: log2(norm_counts+1)) (TCGA IlluminaHiSeq_RNASeqV2, pan-cancer normalized log2(norm_counts+1) data, version 2016-08-16) |
 |
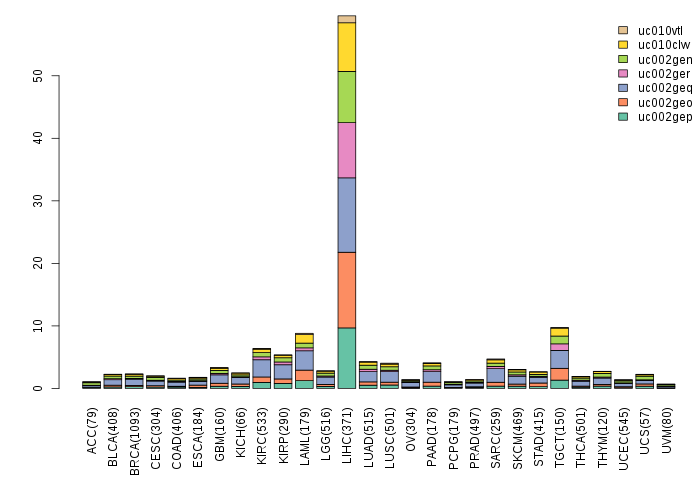
| Gene isoform expressions across 28 cancer types (X-axis: cancer type and Y-axis: log2(norm_counts+1)) (TCGA pan-cancer tcga_rsem_isoform_tpm, version 2016-09-01) |
 |
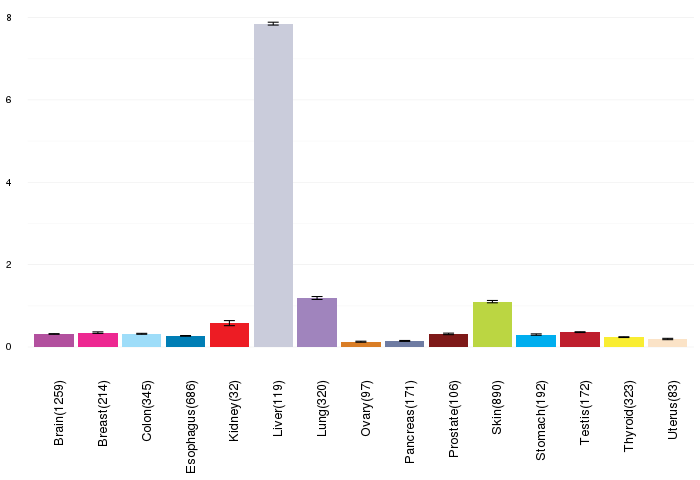
| Gene expressions across normal tissues of GTEx data (GTEx GTEx_Analysis_v6_RNA-seq_RNA-SeQCv1.1.8_gene_rpkm.gct) - Here, we shows the matched tissue types only among our 28 cancer types. |
 |
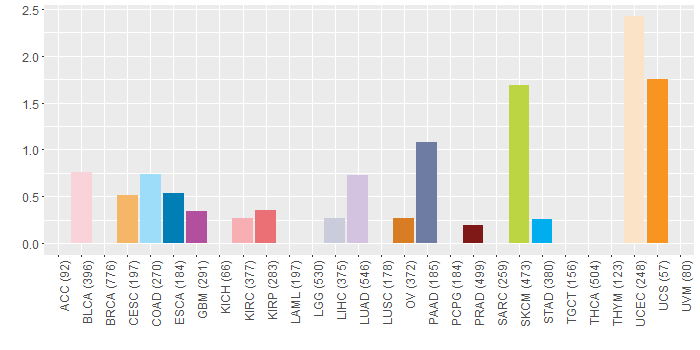
| Different expressions across 14 cancer types with more than 10 samples between matched tumors and normals (X-axis: cancer type and Y-axis: log2(norm_counts+1)) (TCGA IlluminaHiSeq_RNASeqV2, pan-cancer normalized log2(norm_counts+1) data, version 2016-08-16) |
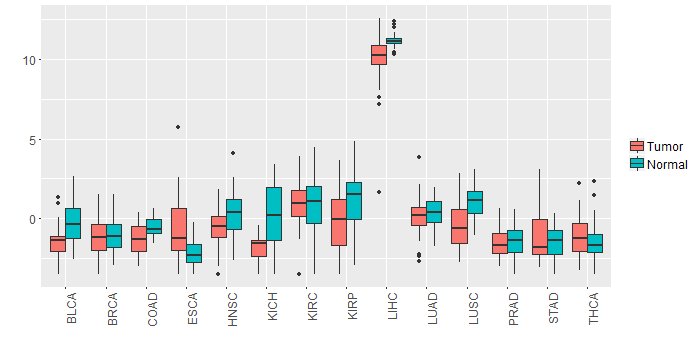 |
| - Significantly differentially expressed cancer types and information. (|Fold change|>1 and FDR<0.05) |
| Cancer type | Mean(exp) in tumor | Mean(exp) in matched normal | Log2FC | P-val. | FDR |
| LIHC | 10.04994971 | 11.18545771 | -1.135508 | 1.29E-05 | 5.28E-05 |
| LUSC | -0.452379386 | 1.020779438 | -1.473158824 | 3.67E-09 | 1.20E-08 |
| BLCA | -1.39607113 | -0.172165867 | -1.223905263 | 0.00743 | 0.035844512 |
| KIRP | -0.091562413 | 1.081643837 | -1.17320625 | 0.0124 | 0.026527481 |
| KICH | -1.822974288 | 0.102269712 | -1.925244 | 0.000103 | 0.000268019 |
| Top |
| TissGene-miRNA for ASGR2 |
| Significantly anti-correlated miRNAs of TissGene across 28 cancer types (Gene-miRNA relations from TargetScanHuman Relsease 7.1, Conserved_Site_Context_Scores.txt.zip, 06.01.2016) (TCGA IlluminaHiSeq_miRNASeq, log2(RPM+1) data, version 2016-11-21) (TCGA IlluminaHiSeq_RNASeqV2, log2(normalized_count+1) data, version 2016-08-16) (Spearman’s Rank Correlation (p-value<0.05 and coefficient<-0.25)) |
| Cancer type | miRNA id | miRNA accession | P-val. | Coeff. | # samples |
| Top |
| TissGeneMut for ASGR2 |
| TissGeneSNV for ASGR2 |
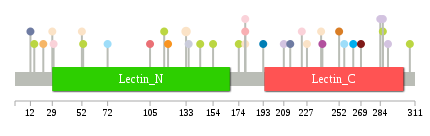
| nsSNV counts per each loci. Different colors of circles represent different cancer types. Circle size denotes number of samples. (TCGA somatic mutation (SNPs and small INDELs) data, version 2016-04-25) * Click on the image to enlarge it in a new window. |
 |
 |
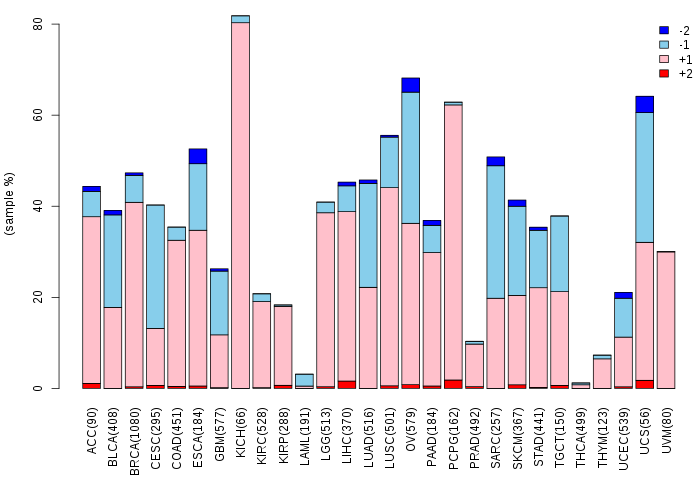
| Somatic nucleotide variants of TissGene across 28 cancer types (X-axis: cancer type and Y-axis: % of mutated samples) The numbers in parentheses are numbers of samples with mutation (nsSNVs). (TCGA somatic mutation (SNPs and small INDELs) data, version 2016-04-25) |
 |
| - nsSNVs sorted by frequency. |
| AAchange | Cancer type | # samples |
| p.E133D | UCEC | 2 |
| p.D144N | SKCM | 1 |
| p.T307P | SKCM | 1 |
| p.D290Y | LUAD | 1 |
| p.H227Y | UCEC | 1 |
| p.L237V | HNSC | 1 |
| p.F39S | HNSC | 1 |
| p.R286H | LUAD | 1 |
| p.P154L | SKCM | 1 |
| p.R174K | SKCM | 1 |
| p.F223C | BLCA | 1 |
| p.R30K | BLCA | 1 |
| p.S12I | PAAD | 1 |
| p.V179A | UCEC | 1 |
| p.D239E | GBM | 1 |
| p.N209K | LUAD | 1 |
| p.R29C | UCEC | 1 |
| p.L53F | SKCM | 1 |
| p.R52C | UCEC | 1 |
| p.Q135R | LIHC | 1 |
| p.T116I | SKCM | 1 |
| p.V179L | BLCA | 1 |
| p.Q22* | CESC | 1 |
| p.D284N | LUAD | 1 |
| p.R286C | SKCM | 1 |
| p.E15K | SKCM | 1 |
| p.V179F | KIRC | 1 |
| p.S105T | KIRP | 1 |
| p.Y256H | COAD | 1 |
| p.Q263H | STAD | 1 |
| p.V72M | COAD | 1 |
| p.T238A | UCEC | 1 |
| p.V214I | PAAD | 1 |
| p.G269R | PRAD | 1 |
| p.H193N | ESCA | 1 |
| p.Y252C | OV | 1 |
| p.G119D | UCS | 1 |
| Top |
| TissGeneCNV for ASGR2 |
| Copy number variations of TissGene across 28 cancer types (X-axis: cancer type and Y-axis: % of CNV samples) (TCGA Gistic2_CopyNumber_Gistic2_all_data_by_genes, Gistic2 copy number data, version 2016-08-16) |
 |
| Top |
| TissGeneFusions for ASGR2 |
| Fusion genes including TissGene (ChimerDB 3.0, 2016-12-01 and TCGA fusion Portal 2015-12-01) |
| Database | Src | Cancer type | Sample | Fusion gene | ORF | 5'-gene BP | 3'-gene BP |
| Chimerdb3.0 | ChiTaRs | NA | AI207464 | ASGR2-BLOC1S1 | chr17:7011857 | chr12:56109902 | |
| Chimerdb3.0 | ChiTaRs | NA | CB162748 | ASGR2-ASGR2 | chr17:7012176 | chr17:7004670 |
| Top |
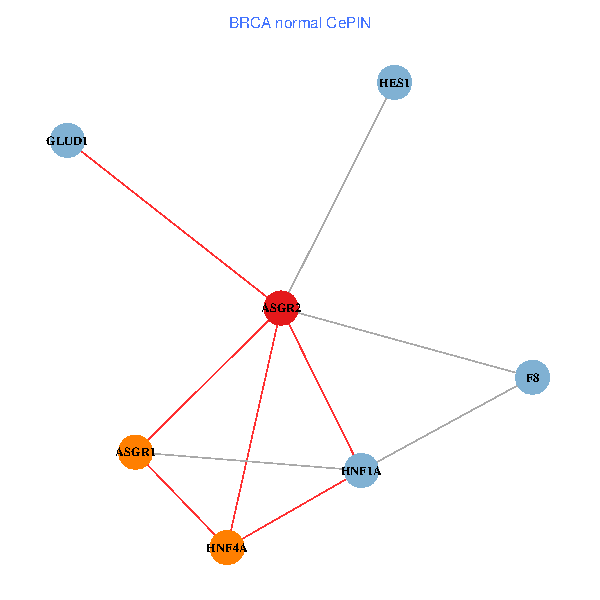
| TissGeneNet for ASGR2 |
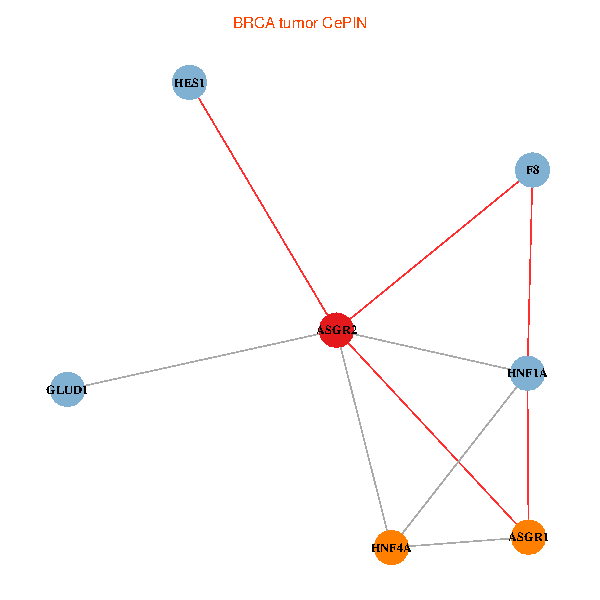
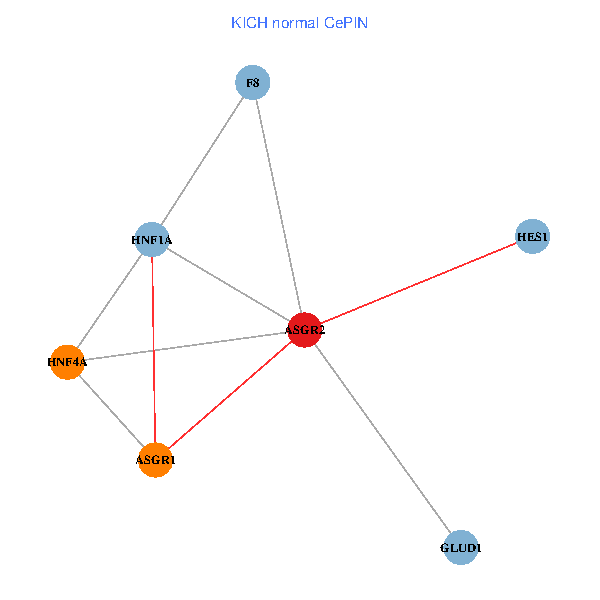
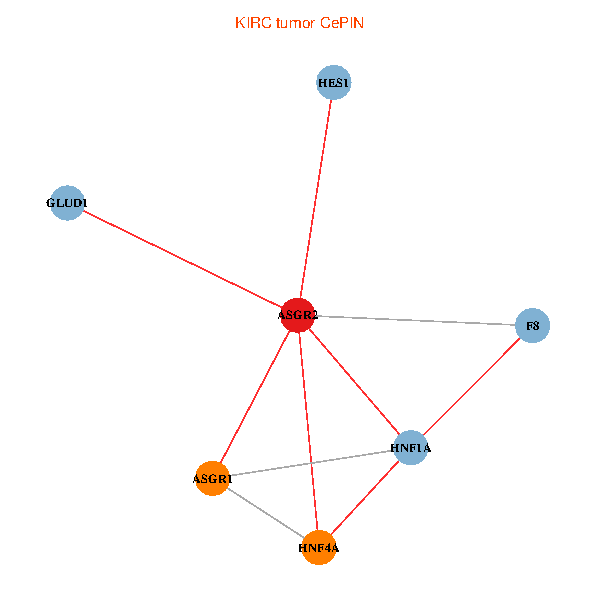
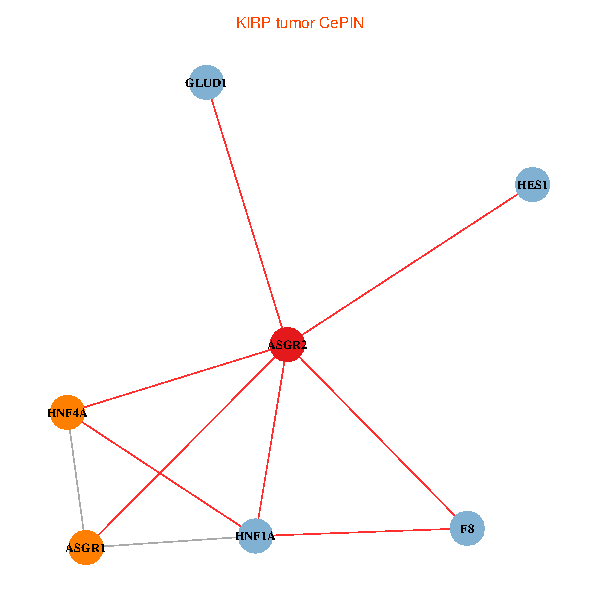
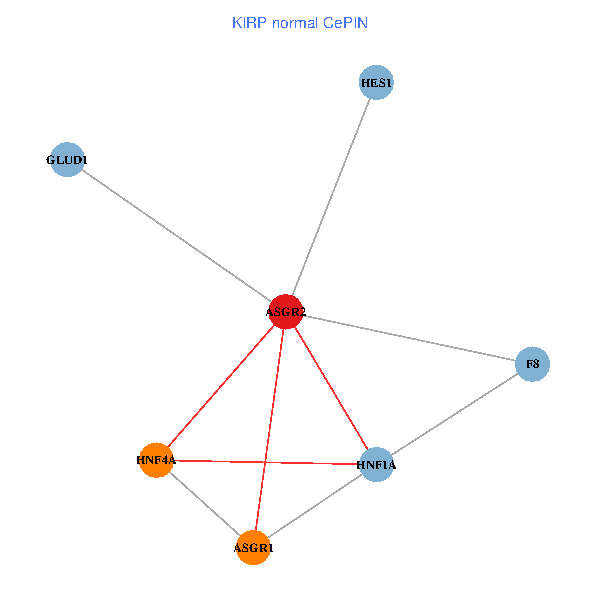
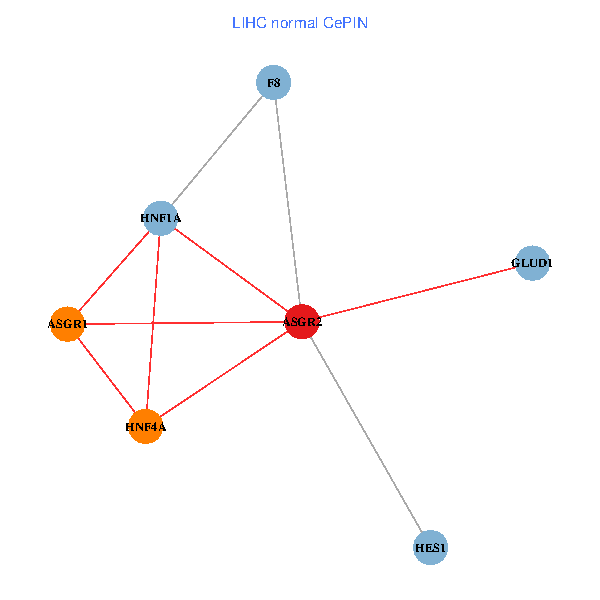
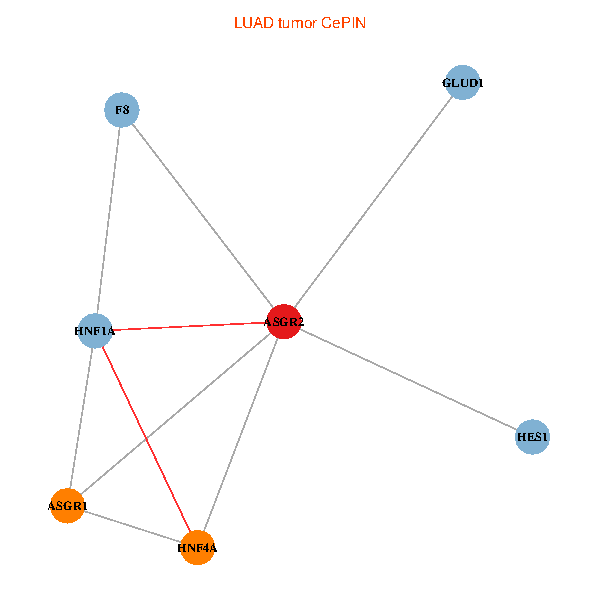
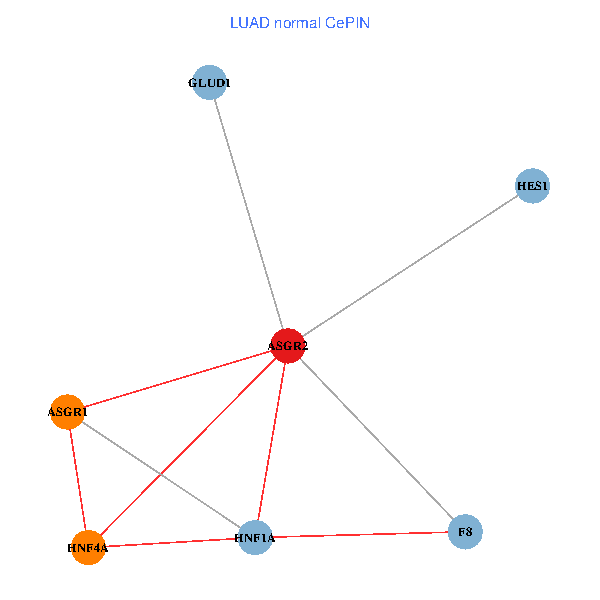
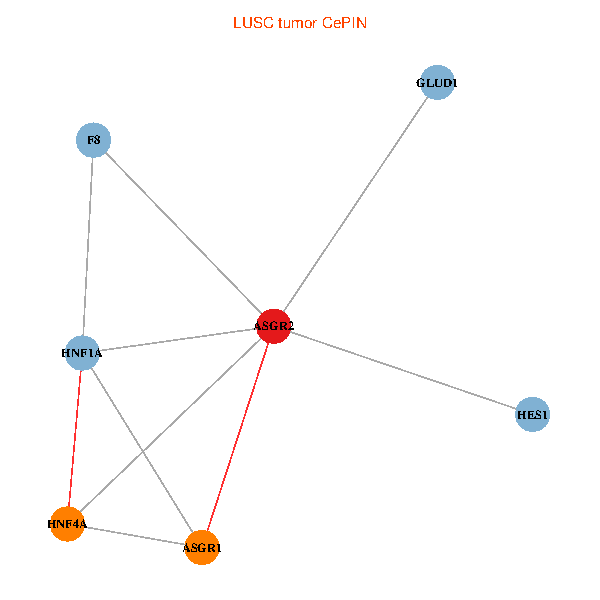
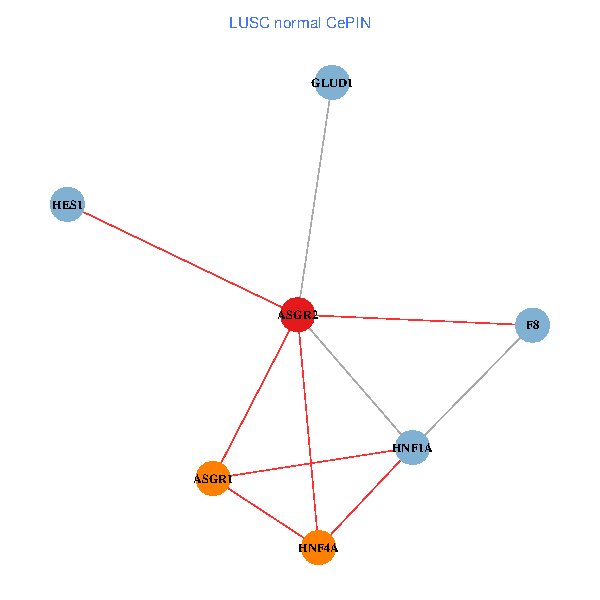
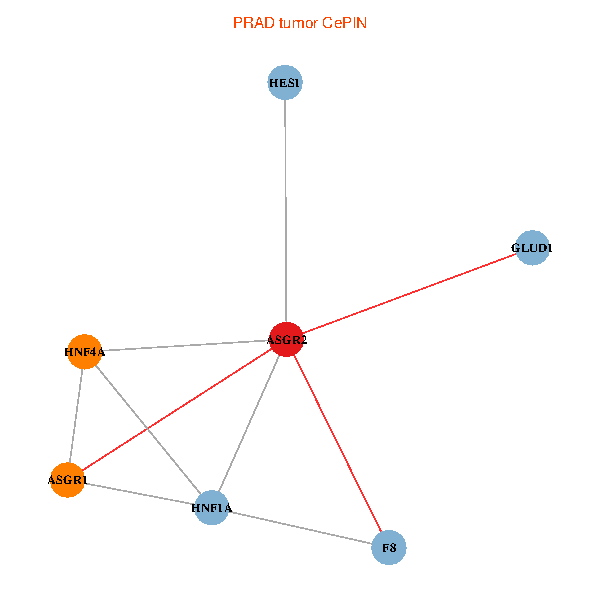
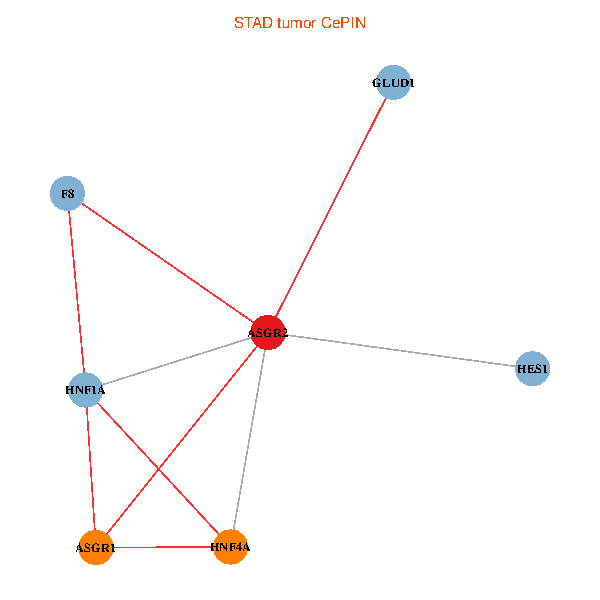
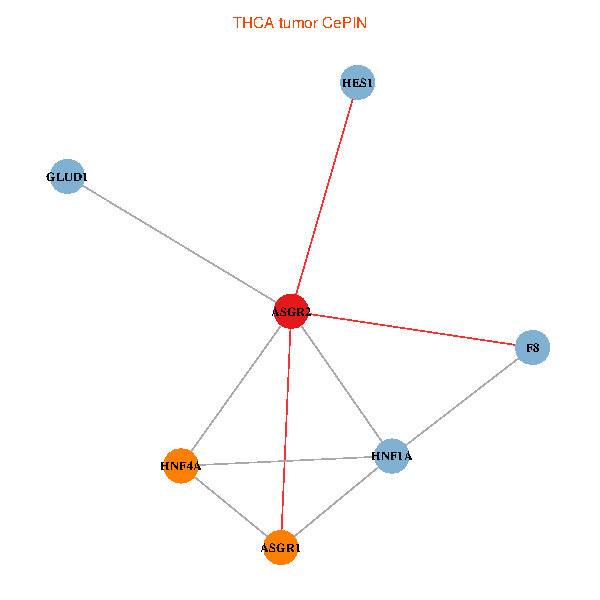
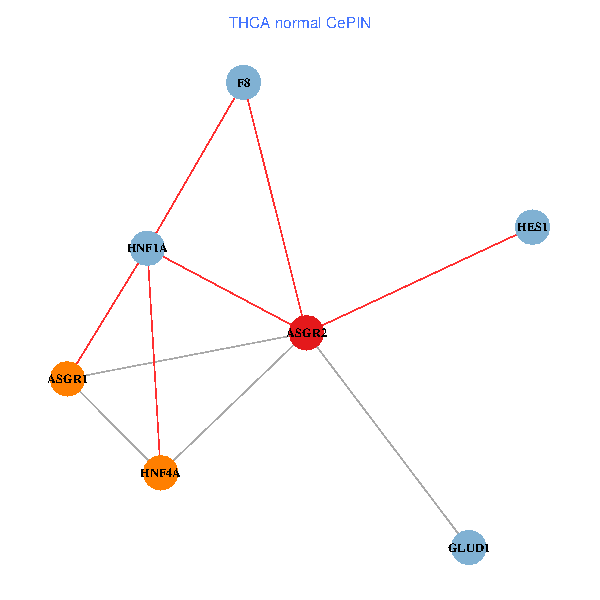
| Co-expressed gene networks based on protein-protein interaction data (CePIN) (TCGA IlluminaHiSeq_RNASeqV2, pan-cancer normalized log2(norm_counts+1) data, version 2016-08-16) (PINA2 ppi data) |
| BRCA (tumor) | BRCA (normal) |
| ASGR2, HNF4A, GLUD1, HNF1A, HES1, ASGR1, F8 (tumor) | ASGR2, HNF4A, GLUD1, HNF1A, HES1, ASGR1, F8 (normal) |
 |  |
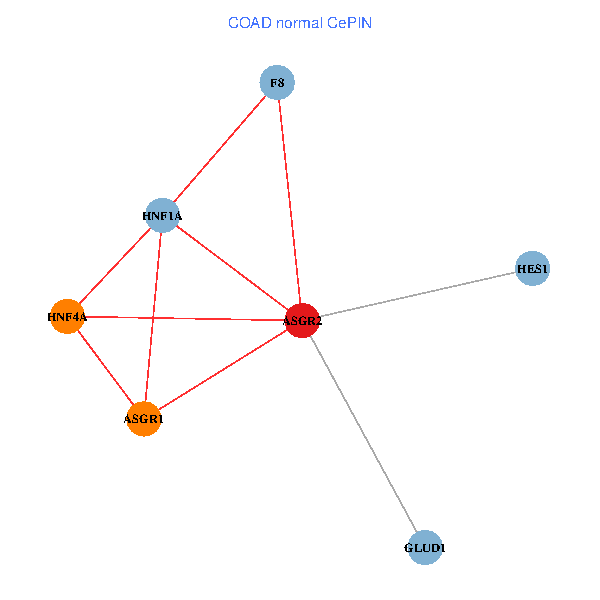
| COAD (tumor) | COAD (normal) |
| ASGR2, HNF4A, GLUD1, HNF1A, HES1, ASGR1, F8 (tumor) | ASGR2, HNF4A, GLUD1, HNF1A, HES1, ASGR1, F8 (normal) |
 |  |
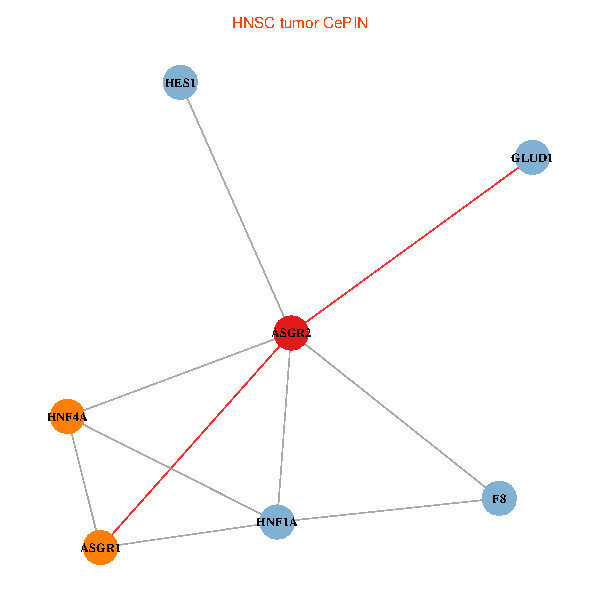
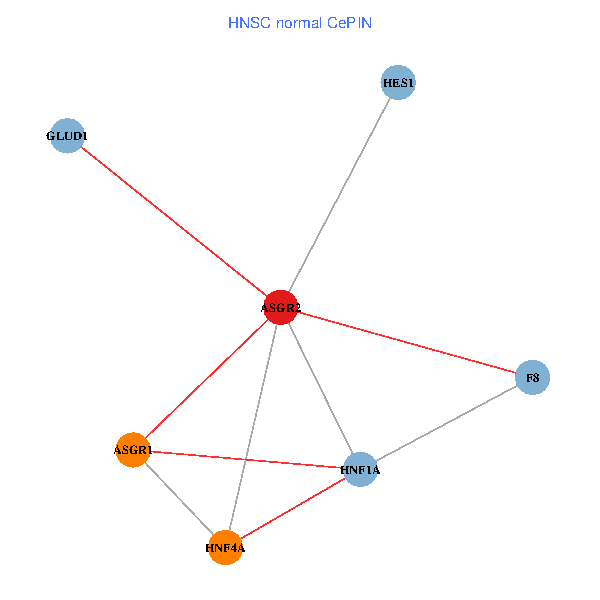
| HNSC (tumor) | HNSC (normal) |
| ASGR2, HNF4A, GLUD1, HNF1A, HES1, ASGR1, F8 (tumor) | ASGR2, HNF4A, GLUD1, HNF1A, HES1, ASGR1, F8 (normal) |
 |  |
| KICH (tumor) | KICH (normal) |
| ASGR2, HNF4A, GLUD1, HNF1A, HES1, ASGR1, F8 (tumor) | ASGR2, HNF4A, GLUD1, HNF1A, HES1, ASGR1, F8 (normal) |
 |  |
| KIRC (tumor) | KIRC (normal) |
| ASGR2, HNF4A, GLUD1, HNF1A, HES1, ASGR1, F8 (tumor) | ASGR2, HNF4A, GLUD1, HNF1A, HES1, ASGR1, F8 (normal) |
 |  |
| KIRP (tumor) | KIRP (normal) |
| ASGR2, HNF4A, GLUD1, HNF1A, HES1, ASGR1, F8 (tumor) | ASGR2, HNF4A, GLUD1, HNF1A, HES1, ASGR1, F8 (normal) |
 |  |
| LIHC (tumor) | LIHC (normal) |
| ASGR2, HNF4A, GLUD1, HNF1A, HES1, ASGR1, F8 (tumor) | ASGR2, HNF4A, GLUD1, HNF1A, HES1, ASGR1, F8 (normal) |
 |  |
| LUAD (tumor) | LUAD (normal) |
| ASGR2, HNF4A, GLUD1, HNF1A, HES1, ASGR1, F8 (tumor) | ASGR2, HNF4A, GLUD1, HNF1A, HES1, ASGR1, F8 (normal) |
 |  |
| LUSC (tumor) | LUSC (normal) |
| ASGR2, HNF4A, GLUD1, HNF1A, HES1, ASGR1, F8 (tumor) | ASGR2, HNF4A, GLUD1, HNF1A, HES1, ASGR1, F8 (normal) |
 |  |
| PRAD (tumor) | PRAD (normal) |
| ASGR2, HNF4A, GLUD1, HNF1A, HES1, ASGR1, F8 (tumor) | ASGR2, HNF4A, GLUD1, HNF1A, HES1, ASGR1, F8 (normal) |
 |  |
| STAD (tumor) | STAD (normal) |
| ASGR2, HNF4A, GLUD1, HNF1A, HES1, ASGR1, F8 (tumor) | ASGR2, HNF4A, GLUD1, HNF1A, HES1, ASGR1, F8 (normal) |
 |  |
| THCA (tumor) | THCA (normal) |
| ASGR2, HNF4A, GLUD1, HNF1A, HES1, ASGR1, F8 (tumor) | ASGR2, HNF4A, GLUD1, HNF1A, HES1, ASGR1, F8 (normal) |
 |  |
| Top |
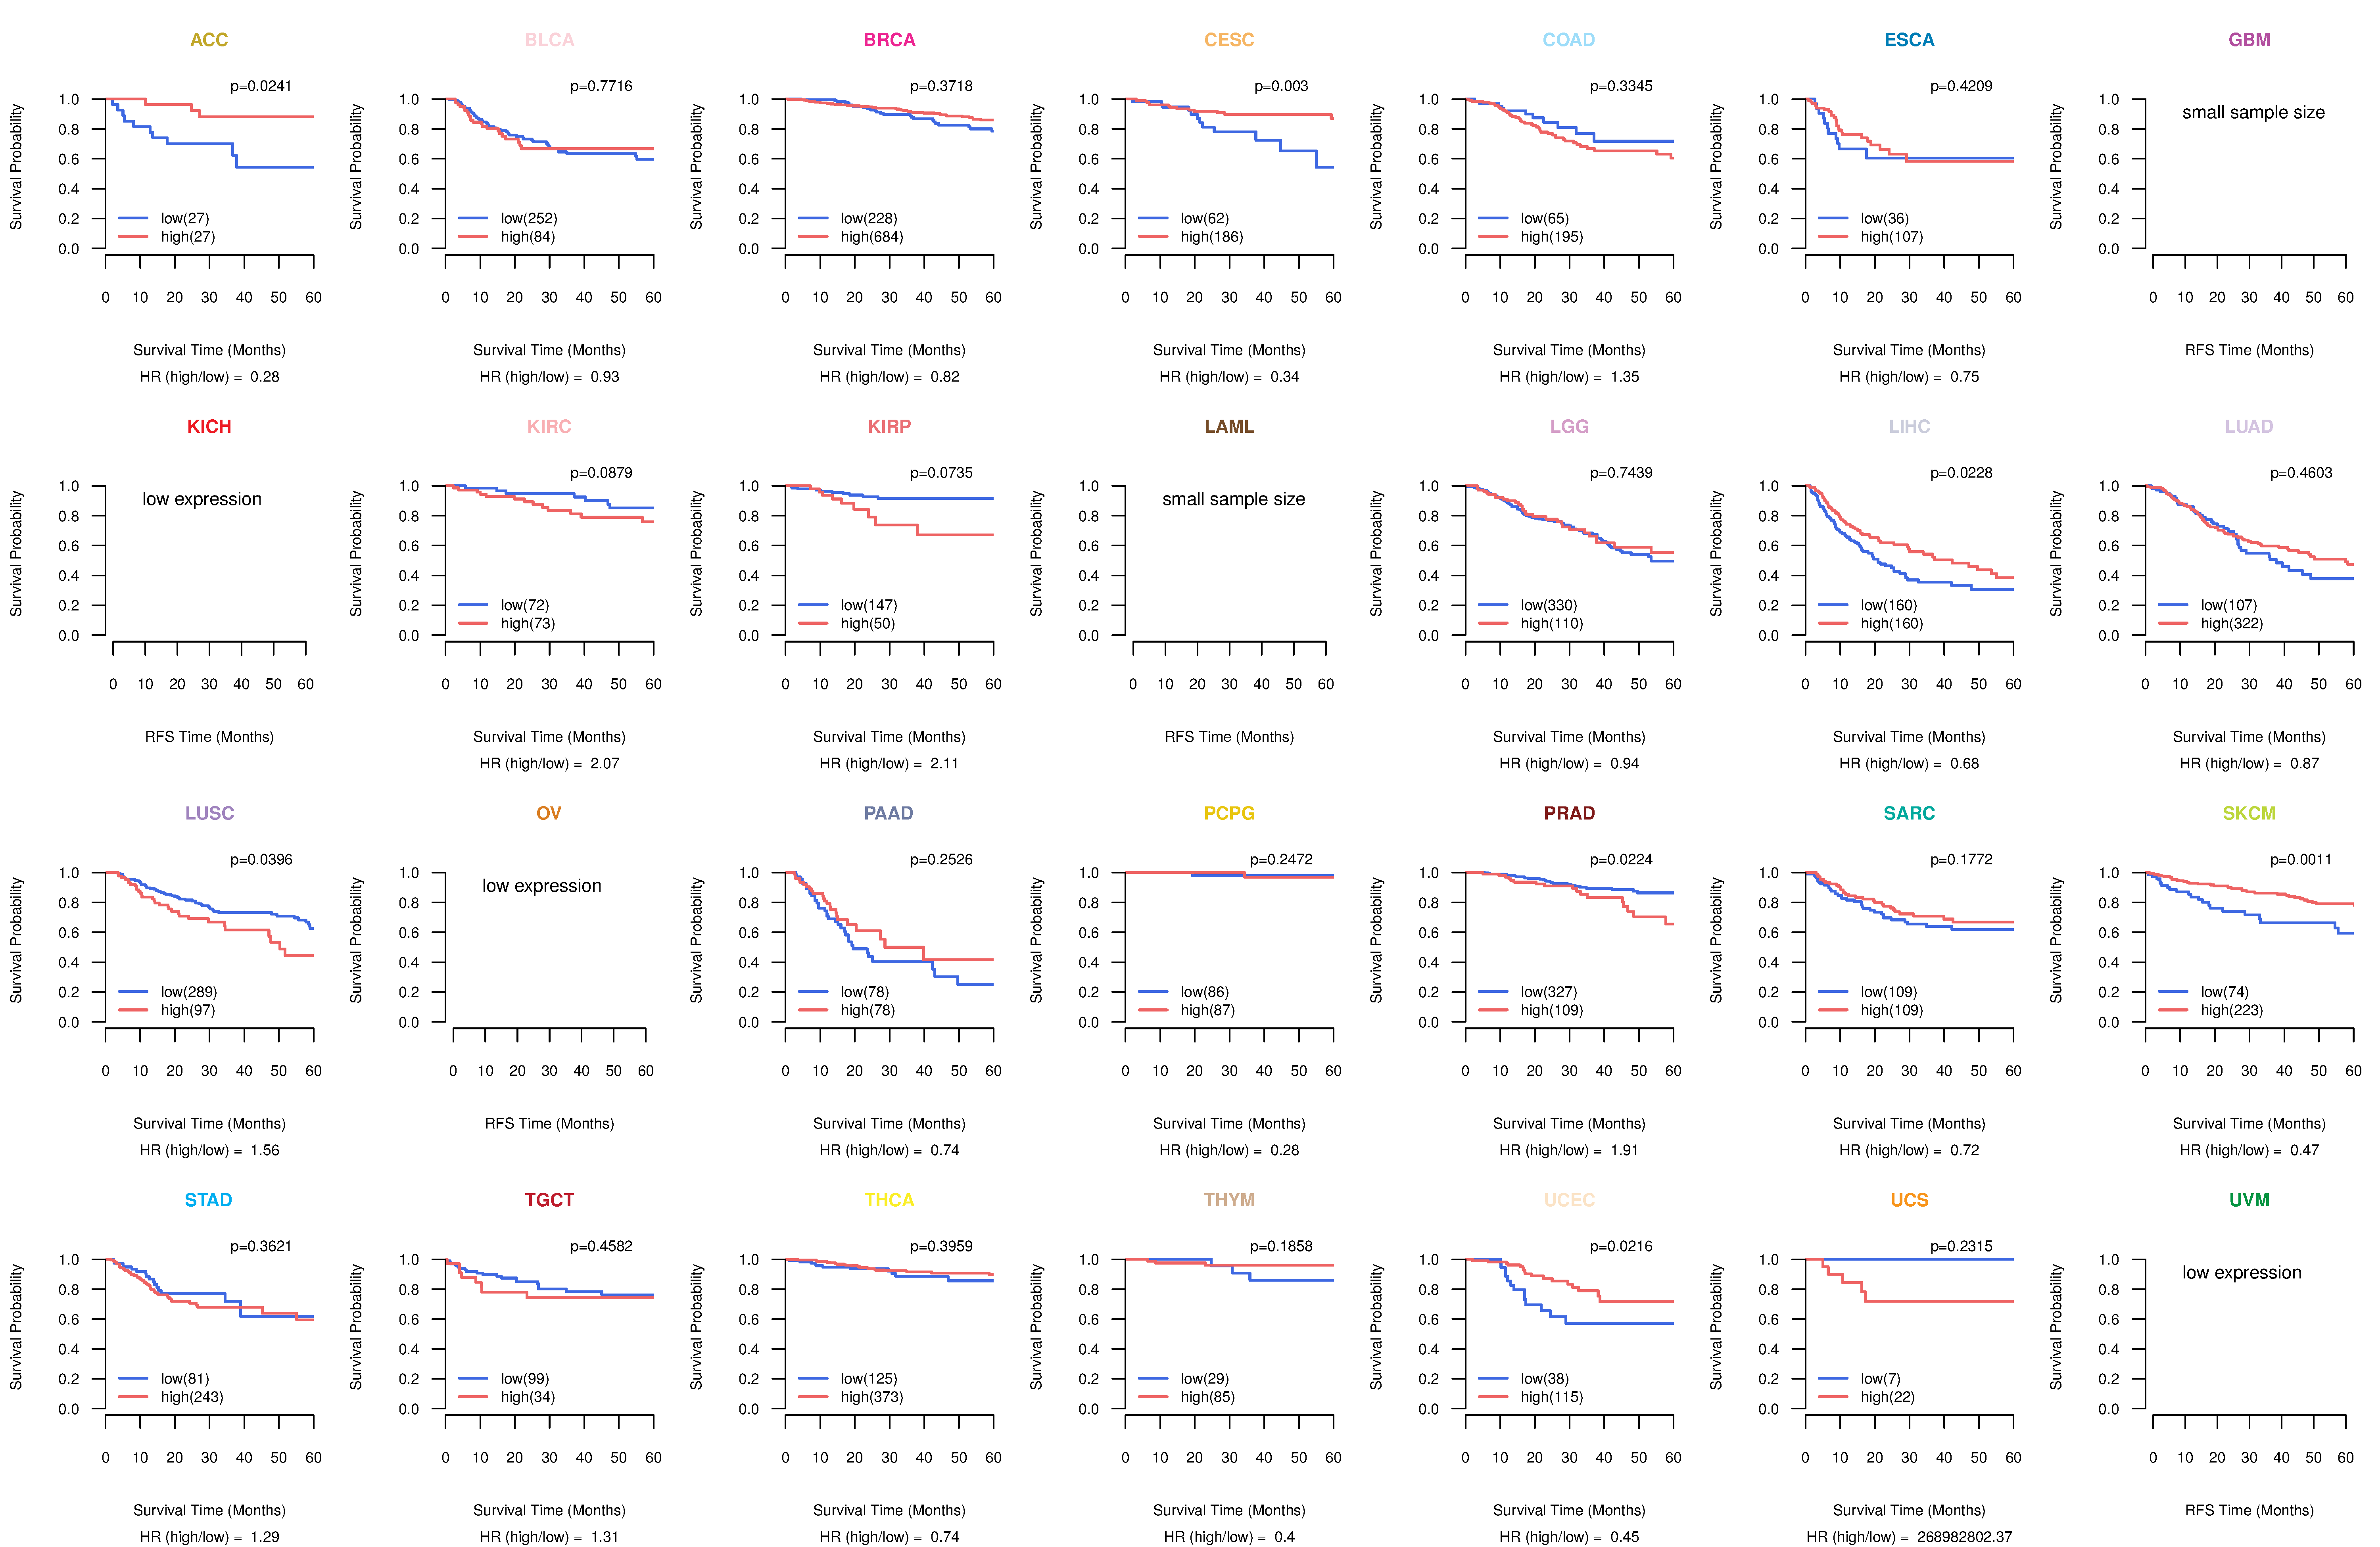
| TissGeneProg for ASGR2 |
| Kaplan-Meier plots with logrank tests of overall survival (OS) using 28 cancer types (TCGA IlluminaHiSeq_RNASeqV2, pan-cancer normalized log2(norm_counts+1) data, version 2016-08-16) (TCGA clinicalMatrix, phenotype data, version 2016-04-27) * Click on the image to enlarge it in a new window. |
 |
| Kaplan-Meier plots with logrank test of relapse free survival (RFS) using 28 cancer types (TCGA IlluminaHiSeq_RNASeqV2, pan-cancer normalized log2(norm_counts+1) data, version 2016-08-16) (TCGA clinicalMatrix, phenotype data, version 2016-04-27) * Click on the image enlarge it in a new window. |
 |
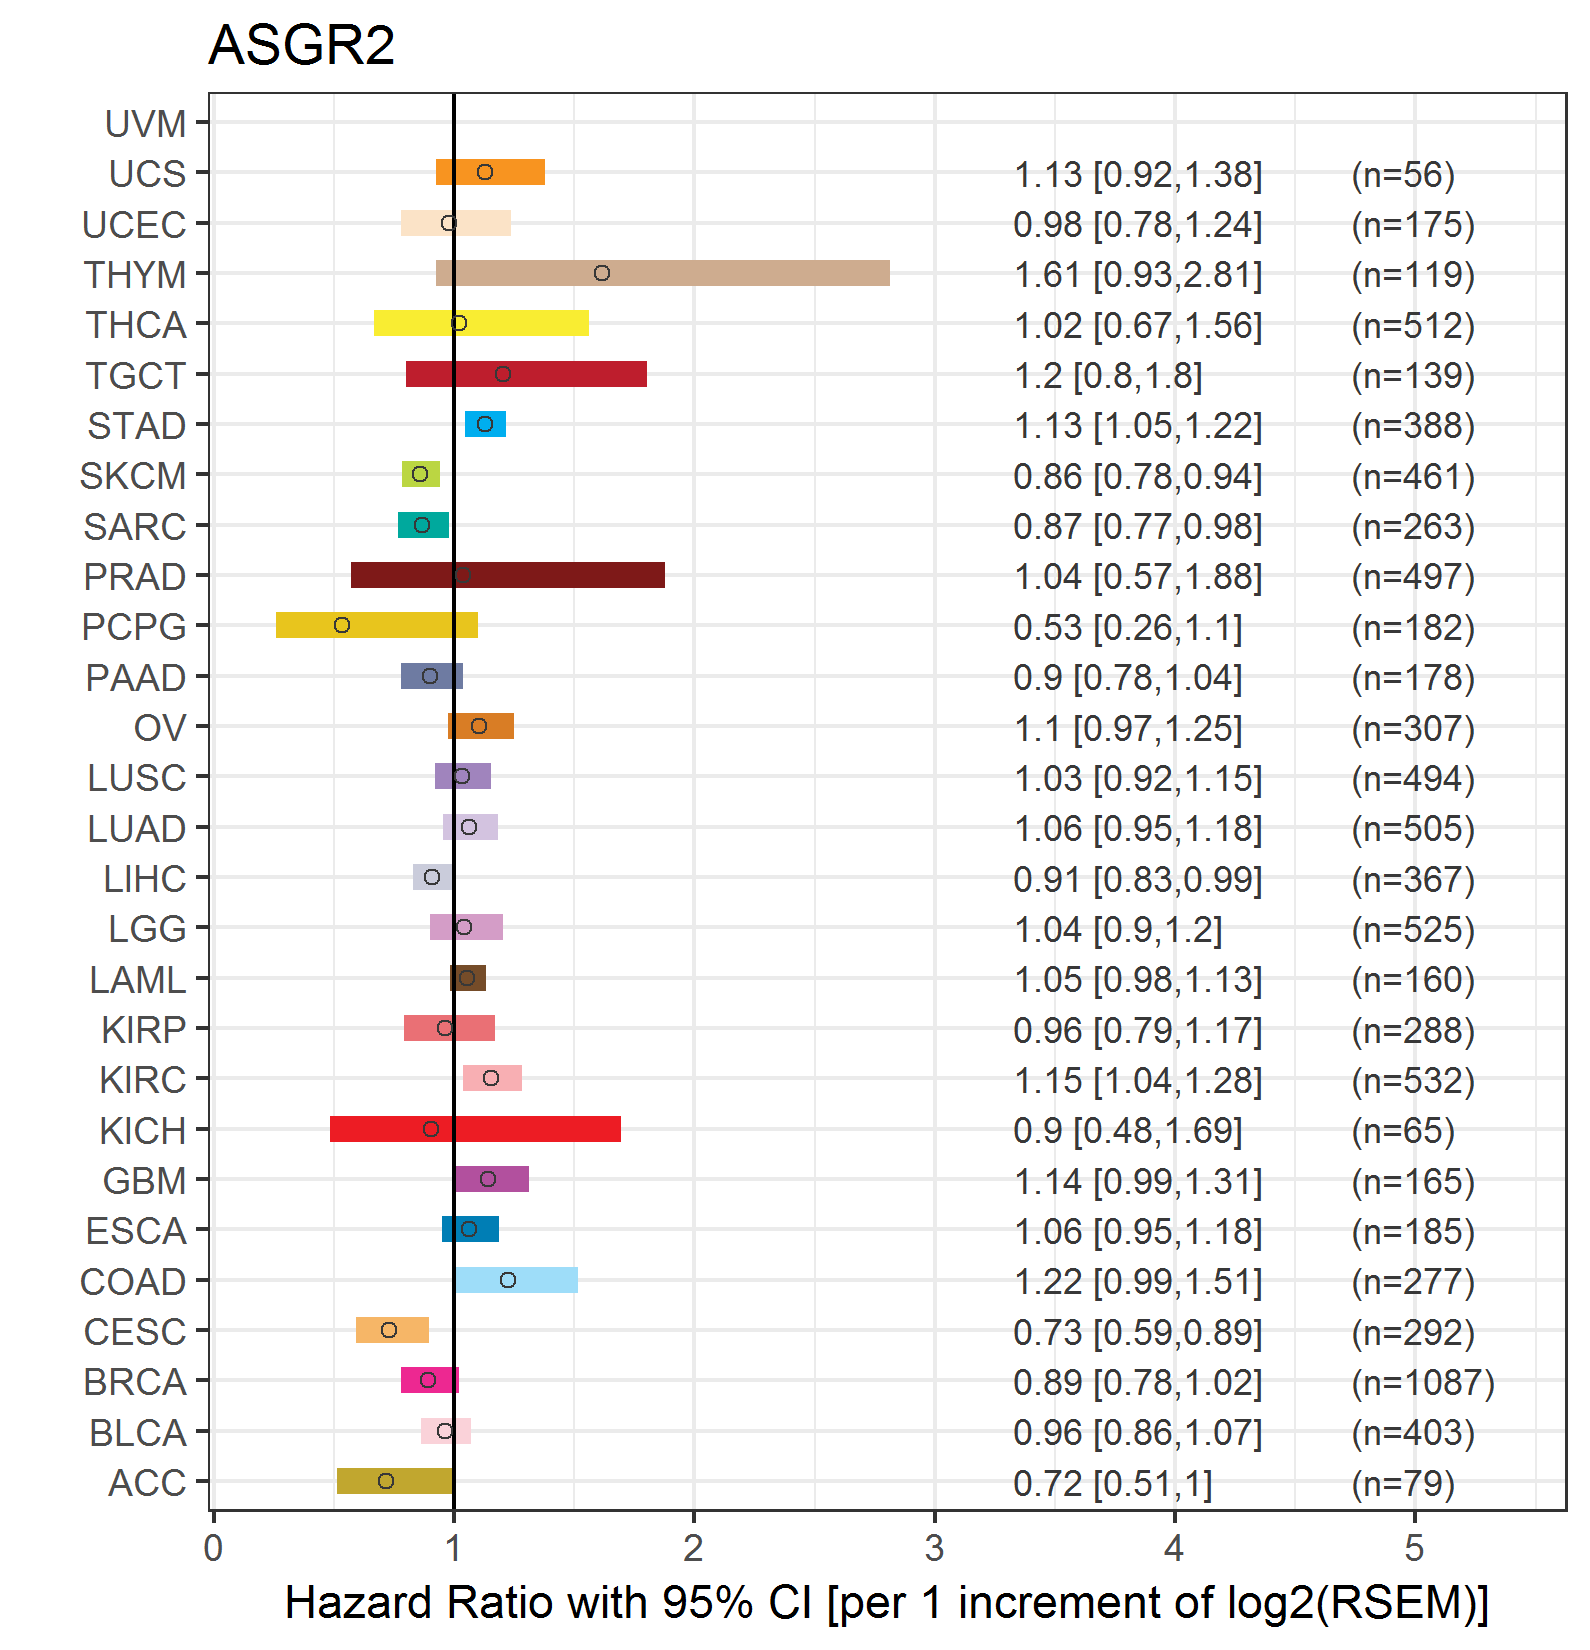
| Forest plot of Cox proportional hazard ratio (HR) and 95% CI of overall survival (OS) using 28 cancer types (TCGA IlluminaHiSeq_RNASeqV2, pan-cancer normalized log2(norm_counts+1) data, version 2016-08-16) (TCGA clinicalMatrix, phenotype data, version 2016-04-27) * Click on the image enlarge it in a new window. |
 |
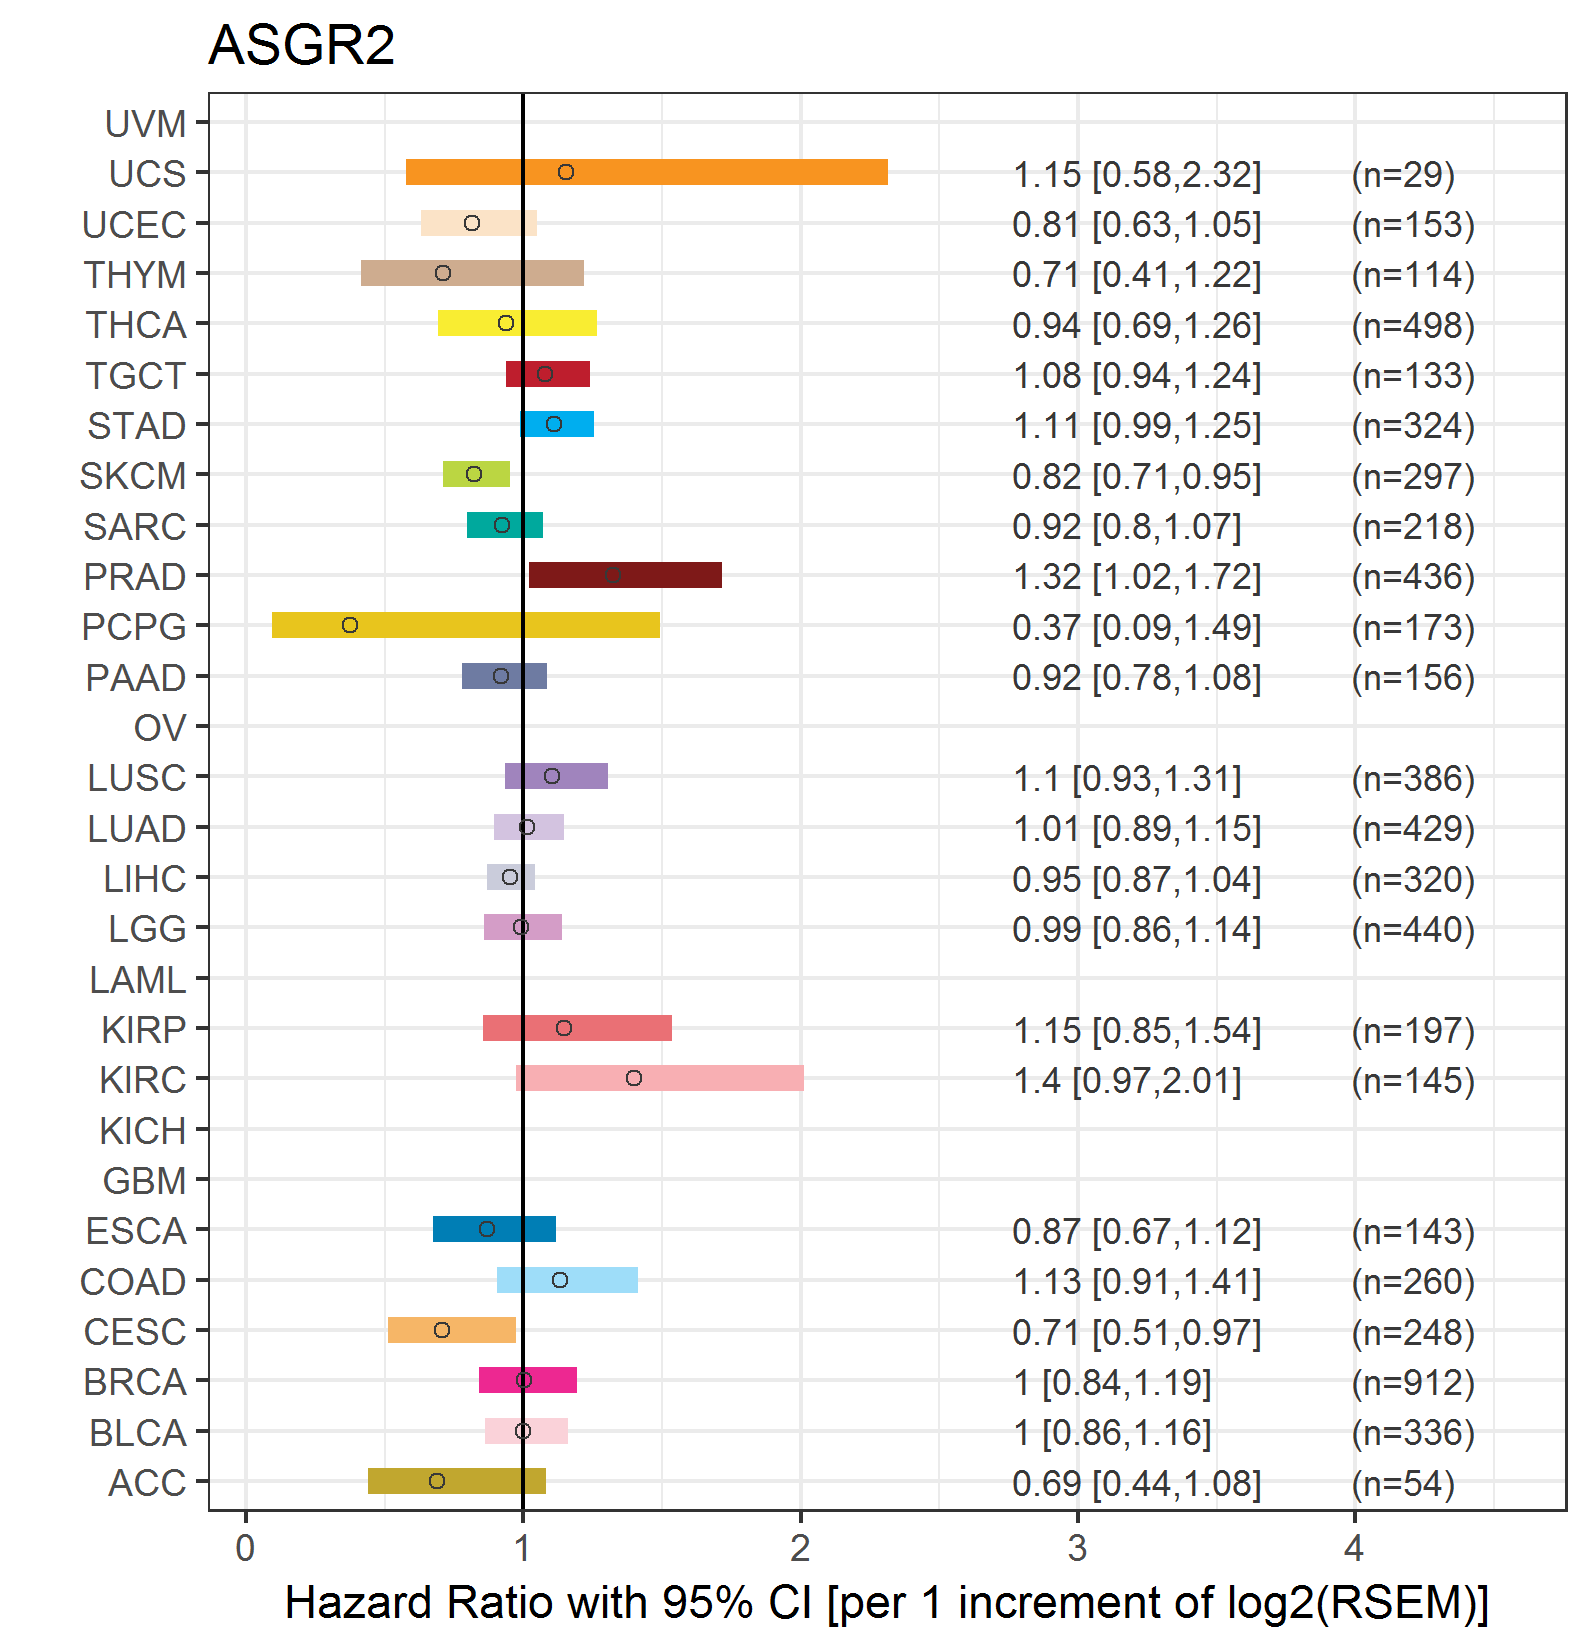
| Forest plot of Cox proportional hazard ratio (HR) and 95% CI of relapse free survival (RFS) using 28 cancer types (TCGA IlluminaHiSeq_RNASeqV2, pan-cancer normalized log2(norm_counts+1) data, version 2016-08-16) (TCGA clinicalMatrix, phenotype data, version 2016-04-27) * Click on the image enlarge it in a new window. |
 |
| Top |
| TissGeneClin for ASGR2 |
| TissGeneDrug for ASGR2 |
| Drug information targeting TissGene (DrugBank Version 5.0.6, 2017-04-01) |
| DrugBank ID | Drug name | Drug activity | Drug type | Drug status |
| DB00025 | Antihemophilic Factor (Recombinant) | Binder | Biotech | Approved|Investigational |
| Top |
| TissGeneDisease for ASGR2 |
| Disease information associated with TissGene (DisGeNet, 2016-06-01) |
| Disease ID | Disease name | # pubmeds | Source |
|
Copyright 2016-Present - The University of Texas Health Science Center at Houston (UTHealth) Web File Viewing | How to Report, Fraud, Waste and Abuse | State of Texas | Statewide Search | Texas Homeland Security | Site Policies |