 |
| |
| |
| |
| |
| |
| |
|

| TissGeneSummary for CAPN14 |
 Gene summary Gene summary |
| Basic gene information | Gene symbol | CAPN14 |
| Gene name | calpain 14 | |
| Synonyms | - | |
| Cytomap | UCSC genome browser: 2p23.1-p21 | |
| Type of gene | protein-coding | |
| RefGenes | NM_001145122.1, | |
| Description | CANP 14calcium-activated neutral proteinase 14calpain-14 | |
| Modification date | 20141207 | |
| dbXrefs | MIM : 610229 | |
| HGNC : HGNC | ||
| Ensembl : ENSG00000214711 | ||
| Protein | UniProt: go to UniProt's Cross Reference DB Table | |
| Expression | CleanEX: HS_CAPN14 | |
| BioGPS: 440854 | ||
| Pathway | NCI Pathway Interaction Database: CAPN14 | |
| KEGG: CAPN14 | ||
| REACTOME: CAPN14 | ||
| Pathway Commons: CAPN14 | ||
| Context | iHOP: CAPN14 | |
| ligand binding site mutation search in PubMed: CAPN14 | ||
| UCL Cancer Institute: CAPN14 | ||
| Assigned class in TissGDB* | C | |
| Included tissue-specific gene expression resources | HPA,GTEx | |
| Specific-tissues in normal samples (assigned by TissGDB using HPA, TiGER, and GTEx) | Esophagus | |
| Cancer types related to the specific-tissues in cancer samples (assigned by TissGDB using TCGA) | ESCA | |
| Reference showing the relevant tissue of CAPN14 | ||
| Description by TissGene annotations | ||
| * Class A consists of genes with literature evidence and is part of the cTissGenes. Class B consists of only cTissGenes without additional evidence. The remaining genes belong to Class C. |
| Gene ontology having evidence of Inferred from Direct Assay (IDA) from Entrez |
| GO ID | GO term | PubMed ID |
| Top |
| TissGeneExp for CAPN14 |
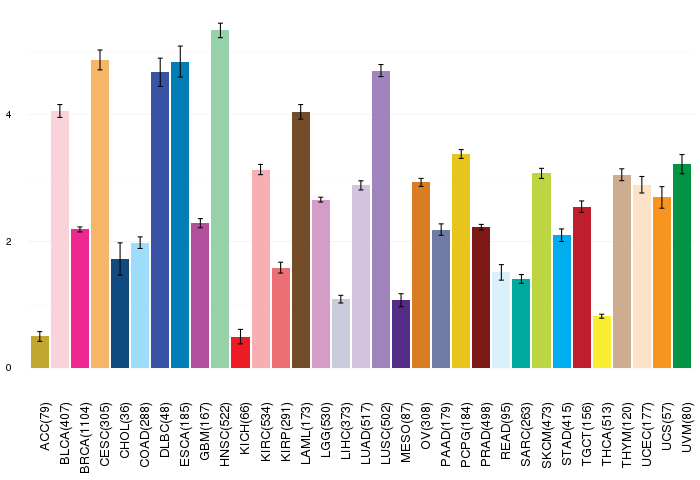
| Gene expressions across 28 cancer types (X-axis: cancer type and Y-axis: log2(norm_counts+1)) (TCGA IlluminaHiSeq_RNASeqV2, pan-cancer normalized log2(norm_counts+1) data, version 2016-08-16) |
 |
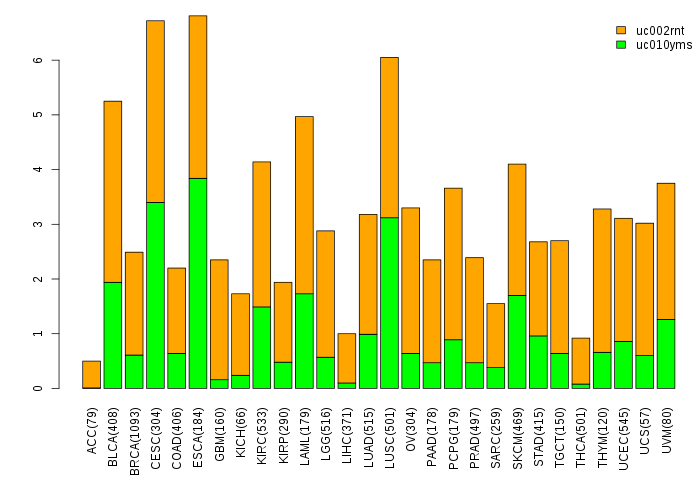
| Gene isoform expressions across 28 cancer types (X-axis: cancer type and Y-axis: log2(norm_counts+1)) (TCGA pan-cancer tcga_rsem_isoform_tpm, version 2016-09-01) |
 |
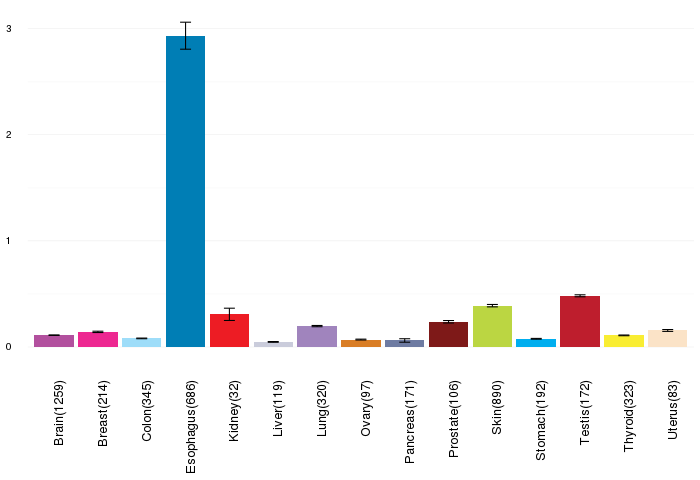
| Gene expressions across normal tissues of GTEx data (GTEx GTEx_Analysis_v6_RNA-seq_RNA-SeQCv1.1.8_gene_rpkm.gct) - Here, we shows the matched tissue types only among our 28 cancer types. |
 |
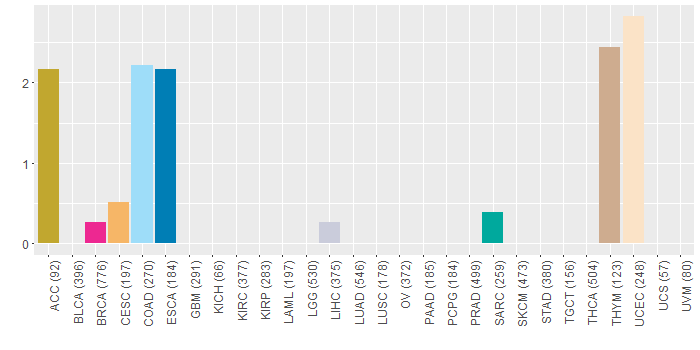
| Different expressions across 14 cancer types with more than 10 samples between matched tumors and normals (X-axis: cancer type and Y-axis: log2(norm_counts+1)) (TCGA IlluminaHiSeq_RNASeqV2, pan-cancer normalized log2(norm_counts+1) data, version 2016-08-16) |
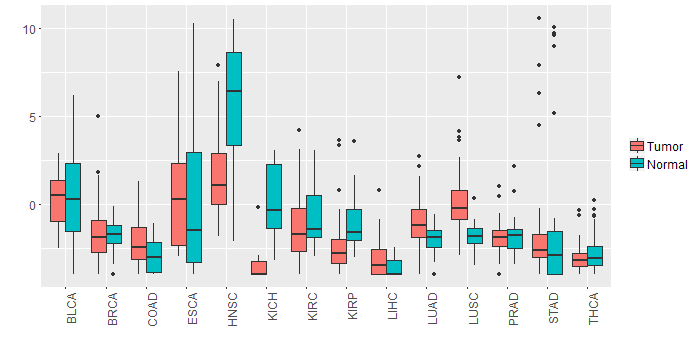 |
| - Significantly differentially expressed cancer types and information. (|Fold change|>1 and FDR<0.05) |
| Cancer type | Mean(exp) in tumor | Mean(exp) in matched normal | Log2FC | P-val. | FDR |
| LUAD | -0.991507322 | -2.050771115 | 1.059263793 | 1.71E-05 | 4.87E-05 |
| LUSC | 0.186917052 | -1.771375104 | 1.958292157 | 1.41E-09 | 4.75E-09 |
| HNSC | 1.728682534 | 5.31194765 | -3.583265116 | 2.86E-06 | 1.91E-05 |
| KICH | -3.462920908 | 0.179611092 | -3.642532 | 2.07E-09 | 1.22E-08 |
| KIRP | -2.196191158 | -1.134409908 | -1.06178125 | 0.0136 | 0.028738172 |
| Top |
| TissGene-miRNA for CAPN14 |
| Significantly anti-correlated miRNAs of TissGene across 28 cancer types (Gene-miRNA relations from TargetScanHuman Relsease 7.1, Conserved_Site_Context_Scores.txt.zip, 06.01.2016) (TCGA IlluminaHiSeq_miRNASeq, log2(RPM+1) data, version 2016-11-21) (TCGA IlluminaHiSeq_RNASeqV2, log2(normalized_count+1) data, version 2016-08-16) (Spearman’s Rank Correlation (p-value<0.05 and coefficient<-0.25)) |
| Cancer type | miRNA id | miRNA accession | P-val. | Coeff. | # samples |
| Top |
| TissGeneMut for CAPN14 |
| TissGeneSNV for CAPN14 |
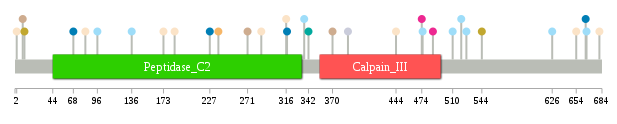
| nsSNV counts per each loci. Different colors of circles represent different cancer types. Circle size denotes number of samples. (TCGA somatic mutation (SNPs and small INDELs) data, version 2016-04-25) * Click on the image to enlarge it in a new window. |
 |
 |
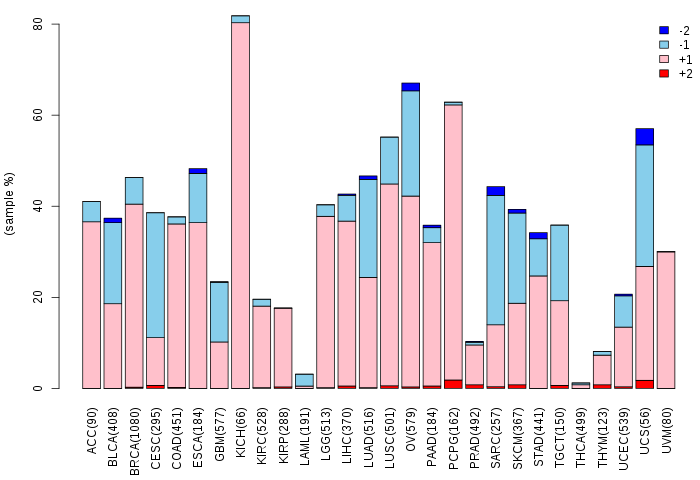
| Somatic nucleotide variants of TissGene across 28 cancer types (X-axis: cancer type and Y-axis: % of mutated samples) The numbers in parentheses are numbers of samples with mutation (nsSNVs). (TCGA somatic mutation (SNPs and small INDELs) data, version 2016-04-25) |
 |
| - nsSNVs sorted by frequency. |
| AAchange | Cancer type | # samples |
| p.F316L | UCEC | 1 |
| p.P475T | COAD | 1 |
| p.C237F | CESC | 1 |
| p.R444I | UCEC | 1 |
| p.R68C | ESCA | 1 |
| p.E227K | ESCA | 1 |
| p.Q342* | SARC | 1 |
| p.E227K | READ | 1 |
| p.F526L | COAD | 1 |
| p.W317X | ESCA | 1 |
| p.A681T | UCEC | 1 |
| p.V474M | BRCA | 1 |
| p.E388K | LIHC | 1 |
| p.E271G | THYM | 1 |
| p.Q544H | ACC | 1 |
| p.R136W | COAD | 1 |
| p.G96R | COAD | 1 |
| p.L370M | THYM | 1 |
| p.N312S | DLBC | 1 |
| p.K510N | COAD | 1 |
| p.V487I | BRCA | 1 |
| p.E654* | UCEC | 1 |
| p.Q82K | UCEC | 1 |
| p.P337Q | COAD | 1 |
| p.G287V | UCEC | 1 |
| p.L538I | MESO | 1 |
| p.Q665K | ESCA | 1 |
| p.C9X | THYM | 1 |
| p.D520N | COAD | 1 |
| p.A561V | CHOL | 1 |
| p.S2Y | UCEC | 1 |
| p.W11L | ACC | 1 |
| p.S186Y | UCEC | 1 |
| p.F173L | UCEC | 1 |
| p.D666N | COAD | 1 |
| p.V626I | COAD | 1 |
| Top |
| TissGeneCNV for CAPN14 |
| Copy number variations of TissGene across 28 cancer types (X-axis: cancer type and Y-axis: % of CNV samples) (TCGA Gistic2_CopyNumber_Gistic2_all_data_by_genes, Gistic2 copy number data, version 2016-08-16) |
 |
| Top |
| TissGeneFusions for CAPN14 |
| Fusion genes including TissGene (ChimerDB 3.0, 2016-12-01 and TCGA fusion Portal 2015-12-01) |
| Database | Src | Cancer type | Sample | Fusion gene | ORF | 5'-gene BP | 3'-gene BP |
| Chimerdb3.0 | ChiTaRs | NA | AI908960 | CAPN14-HERC3 | chr2:31397364 | chr4:89629028 |
| Top |
| TissGeneNet for CAPN14 |
| Co-expressed gene networks based on protein-protein interaction data (CePIN) (TCGA IlluminaHiSeq_RNASeqV2, pan-cancer normalized log2(norm_counts+1) data, version 2016-08-16) (PINA2 ppi data) |
| Top |
| TissGeneProg for CAPN14 |
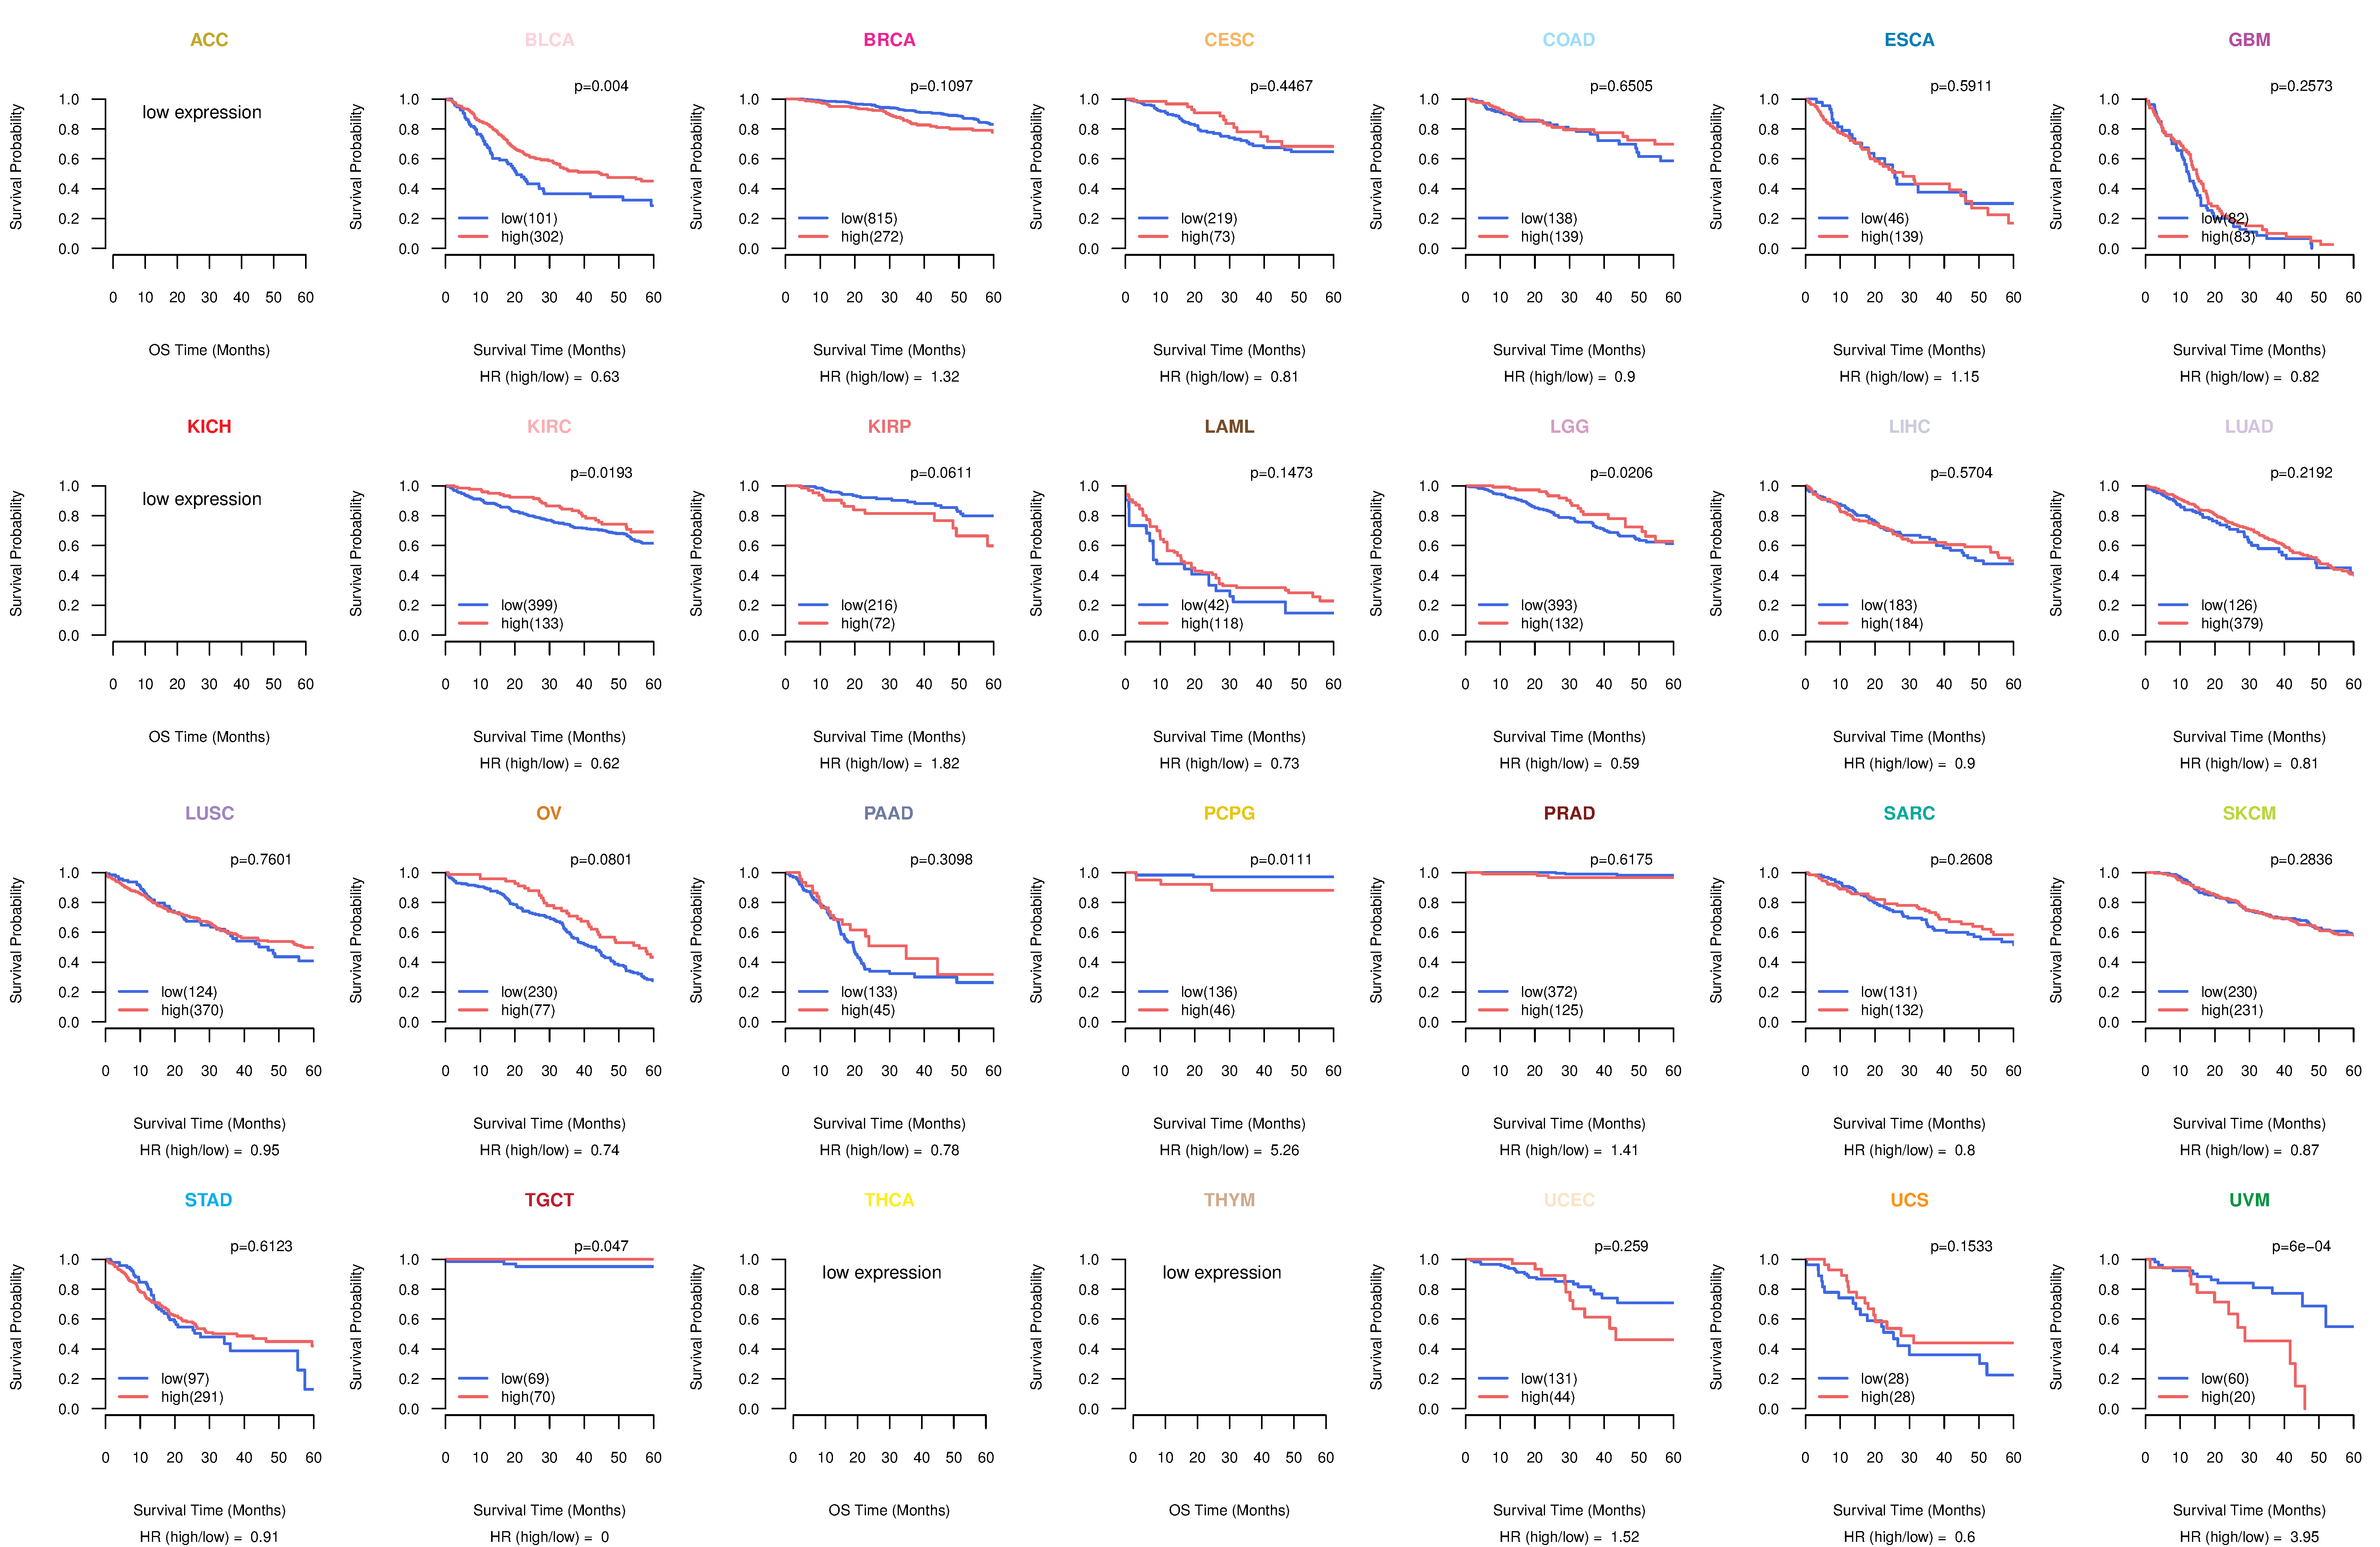
| Kaplan-Meier plots with logrank tests of overall survival (OS) using 28 cancer types (TCGA IlluminaHiSeq_RNASeqV2, pan-cancer normalized log2(norm_counts+1) data, version 2016-08-16) (TCGA clinicalMatrix, phenotype data, version 2016-04-27) * Click on the image to enlarge it in a new window. |
 |
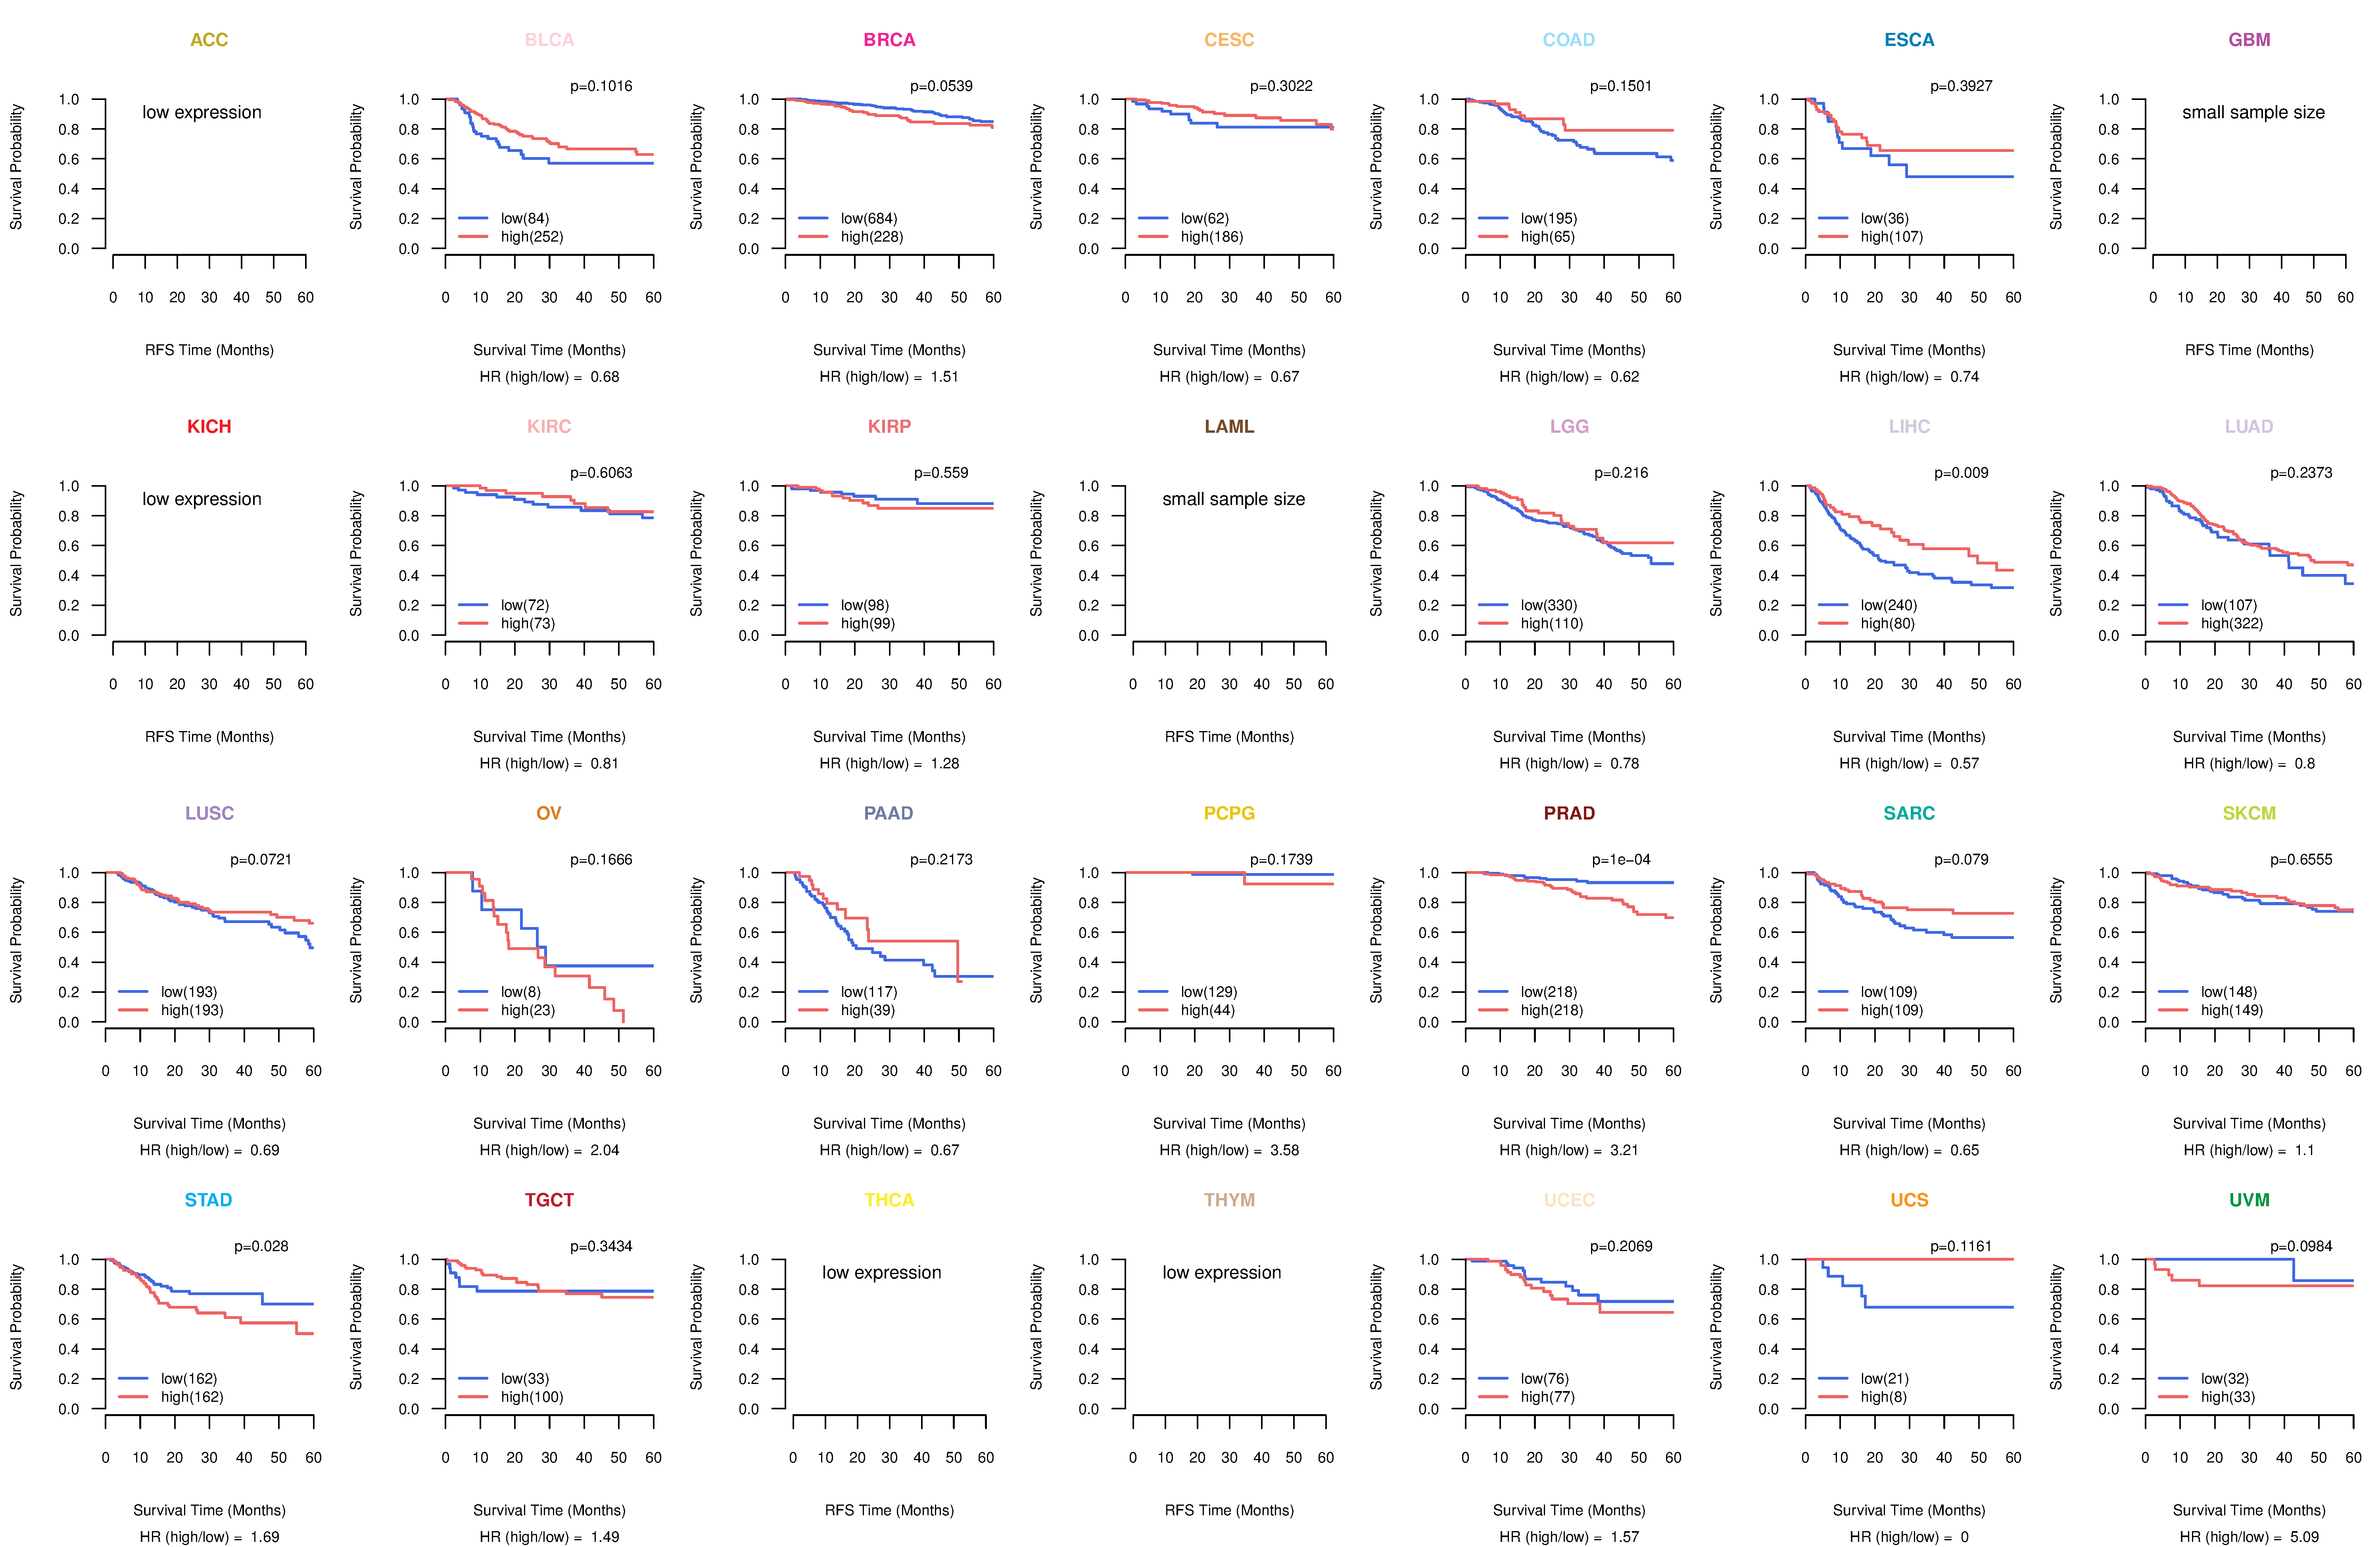
| Kaplan-Meier plots with logrank test of relapse free survival (RFS) using 28 cancer types (TCGA IlluminaHiSeq_RNASeqV2, pan-cancer normalized log2(norm_counts+1) data, version 2016-08-16) (TCGA clinicalMatrix, phenotype data, version 2016-04-27) * Click on the image enlarge it in a new window. |
 |
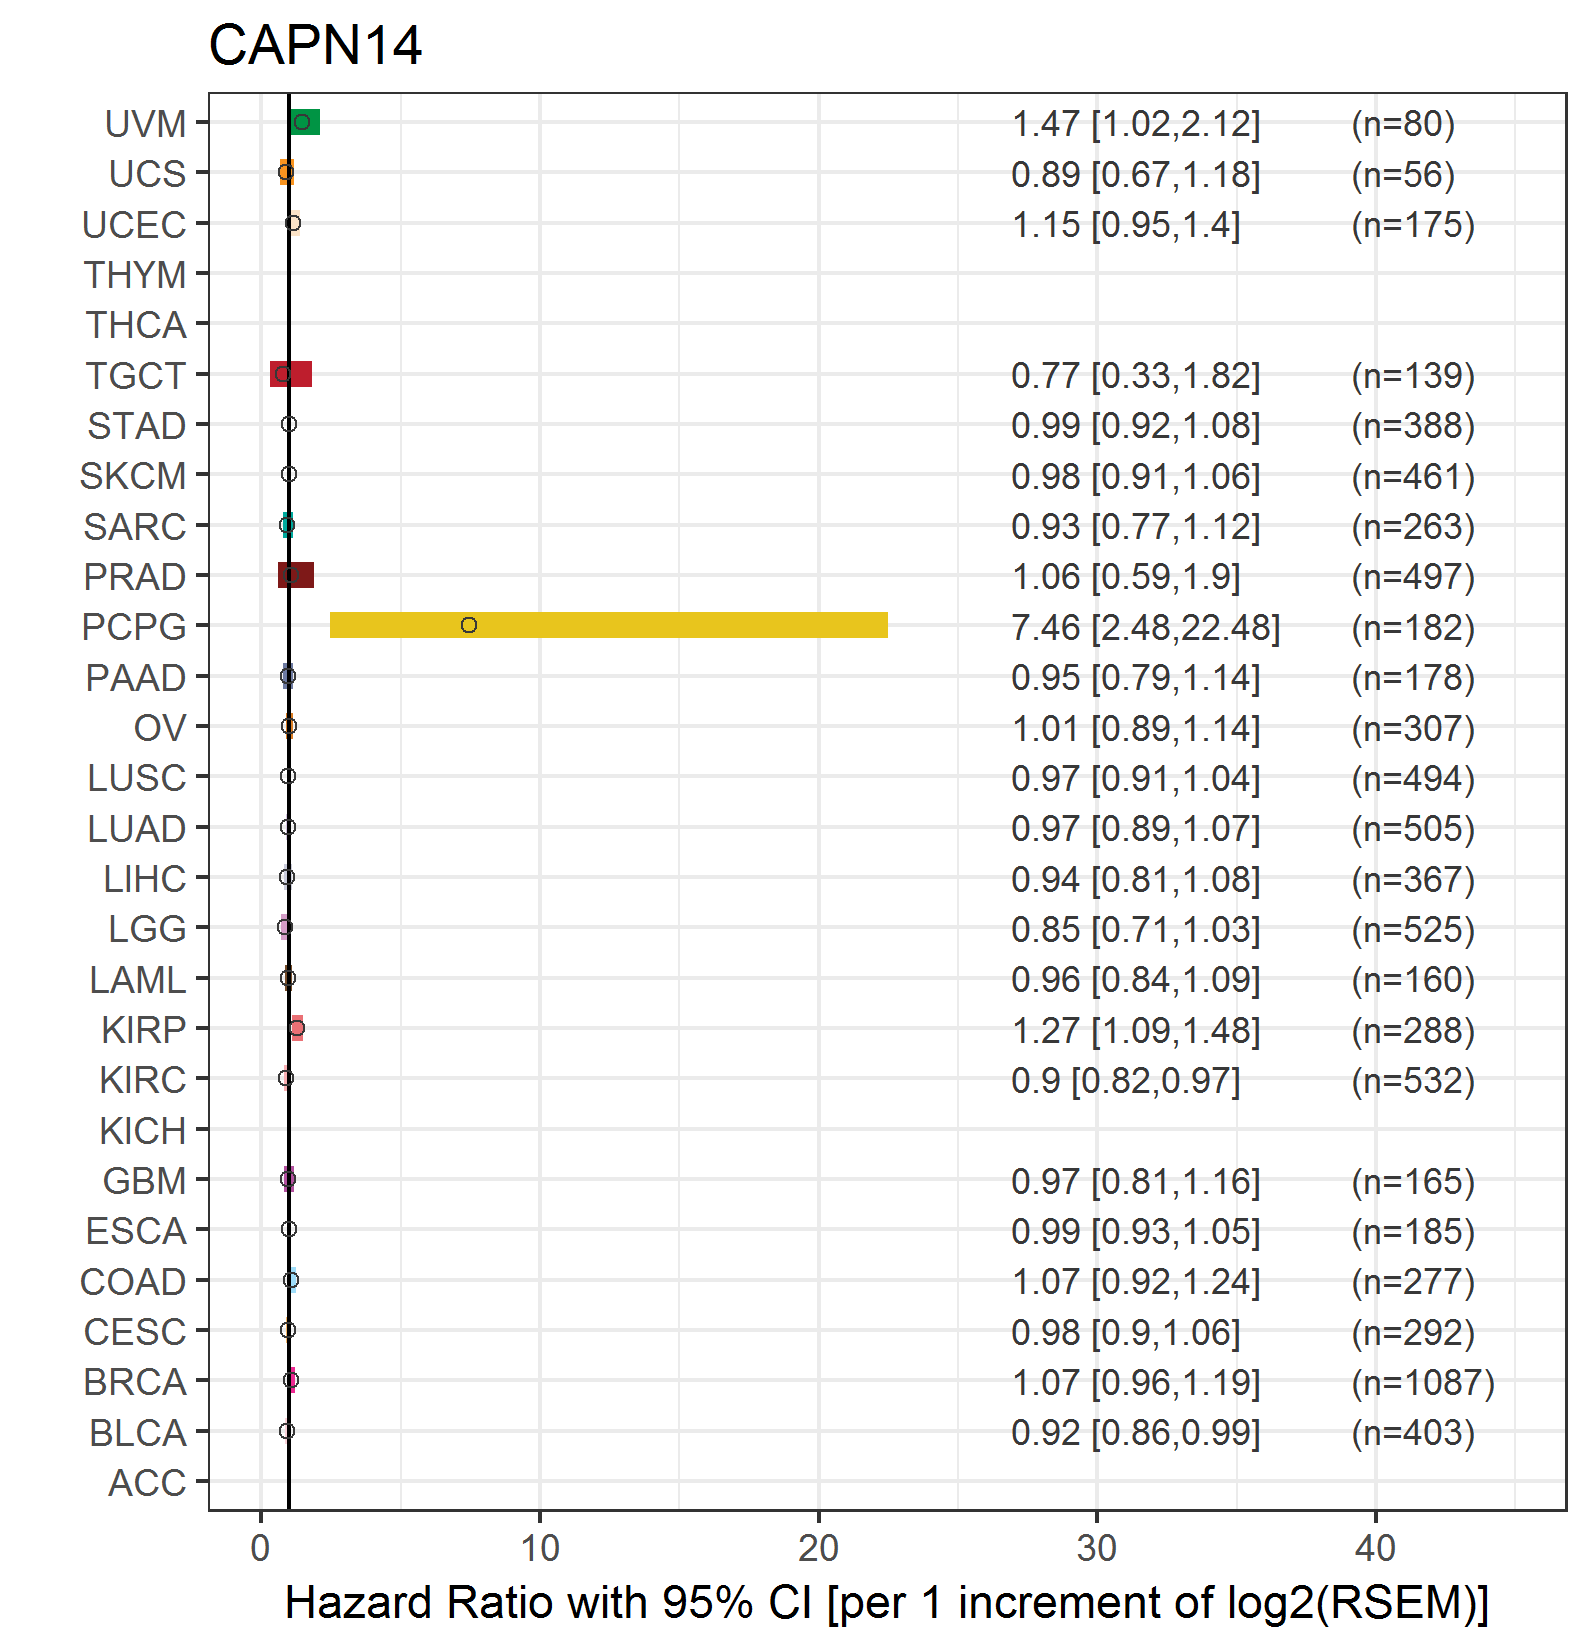
| Forest plot of Cox proportional hazard ratio (HR) and 95% CI of overall survival (OS) using 28 cancer types (TCGA IlluminaHiSeq_RNASeqV2, pan-cancer normalized log2(norm_counts+1) data, version 2016-08-16) (TCGA clinicalMatrix, phenotype data, version 2016-04-27) * Click on the image enlarge it in a new window. |
 |
| Forest plot of Cox proportional hazard ratio (HR) and 95% CI of relapse free survival (RFS) using 28 cancer types (TCGA IlluminaHiSeq_RNASeqV2, pan-cancer normalized log2(norm_counts+1) data, version 2016-08-16) (TCGA clinicalMatrix, phenotype data, version 2016-04-27) * Click on the image enlarge it in a new window. |
 |
| Top |
| TissGeneClin for CAPN14 |
| TissGeneDrug for CAPN14 |
| Drug information targeting TissGene (DrugBank Version 5.0.6, 2017-04-01) |
| DrugBank ID | Drug name | Drug activity | Drug type | Drug status |
| Top |
| TissGeneDisease for CAPN14 |
| Disease information associated with TissGene (DisGeNet, 2016-06-01) |
| Disease ID | Disease name | # pubmeds | Source |
| umls:C0341106 | Eosinophilic esophagitis | 2 | CTD_human,GWASCAT |
| umls:C0029882 | Otitis Media | 1 | BeFree |
| umls:C2827407 | Infectious Otitis Media | 1 | BeFree |
| umls:C3662483 | Allergic sensitization | 1 | BeFree |
|
Copyright 2016-Present - The University of Texas Health Science Center at Houston (UTHealth) Web File Viewing | How to Report, Fraud, Waste and Abuse | State of Texas | Statewide Search | Texas Homeland Security | Site Policies |