 |
| |
| |
| |
| |
| |
| |
|

| TissGeneSummary for CITED1 |
 Gene summary Gene summary |
| Basic gene information | Gene symbol | CITED1 |
| Gene name | Cbp/p300-interacting transactivator, with Glu/Asp-rich carboxy-terminal domain, 1 | |
| Synonyms | MSG1 | |
| Cytomap | UCSC genome browser: Xq13.1 | |
| Type of gene | protein-coding | |
| RefGenes | NM_001144885.1, NM_001144886.1,NM_001144887.1,NM_004143.3, | |
| Description | cbp/p300-interacting transactivator 1melanocyte-specific gene 1melanocyte-specific protein 1 | |
| Modification date | 20141207 | |
| dbXrefs | MIM : 300149 | |
| HGNC : HGNC | ||
| Ensembl : ENSG00000125931 | ||
| HPRD : 02146 | ||
| Vega : OTTHUMG00000021812 | ||
| Protein | UniProt: go to UniProt's Cross Reference DB Table | |
| Expression | CleanEX: HS_CITED1 | |
| BioGPS: 4435 | ||
| Pathway | NCI Pathway Interaction Database: CITED1 | |
| KEGG: CITED1 | ||
| REACTOME: CITED1 | ||
| Pathway Commons: CITED1 | ||
| Context | iHOP: CITED1 | |
| ligand binding site mutation search in PubMed: CITED1 | ||
| UCL Cancer Institute: CITED1 | ||
| Assigned class in TissGDB* | C | |
| Included tissue-specific gene expression resources | TiGER,GTEx | |
| Specific-tissues in normal samples (assigned by TissGDB using HPA, TiGER, and GTEx) | SkinTestis | |
| Cancer types related to the specific-tissues in cancer samples (assigned by TissGDB using TCGA) | SKCMTGCT | |
| Reference showing the relevant tissue of CITED1 | ||
| Description by TissGene annotations | Cancer gene | |
| * Class A consists of genes with literature evidence and is part of the cTissGenes. Class B consists of only cTissGenes without additional evidence. The remaining genes belong to Class C. |
| Gene ontology having evidence of Inferred from Direct Assay (IDA) from Entrez |
| GO ID | GO term | PubMed ID | GO:0006913 | nucleocytoplasmic transport | 16864582 | GO:0007179 | transforming growth factor beta receptor signaling pathway | 9707553 | GO:0043524 | negative regulation of neuron apoptotic process | 21172805 | GO:0043627 | response to estrogen | 11581164 | GO:0045892 | negative regulation of transcription, DNA-templated | 11581164 | GO:0045893 | positive regulation of transcription, DNA-templated | 9434189 | GO:0060395 | SMAD protein signal transduction | 9707553 | GO:0071559 | response to transforming growth factor beta | 9707553 | GO:0006913 | nucleocytoplasmic transport | 16864582 | GO:0007179 | transforming growth factor beta receptor signaling pathway | 9707553 | GO:0043524 | negative regulation of neuron apoptotic process | 21172805 | GO:0043627 | response to estrogen | 11581164 | GO:0045892 | negative regulation of transcription, DNA-templated | 11581164 | GO:0045893 | positive regulation of transcription, DNA-templated | 9434189 | GO:0060395 | SMAD protein signal transduction | 9707553 | GO:0071559 | response to transforming growth factor beta | 9707553 |
| Top |
| TissGeneExp for CITED1 |
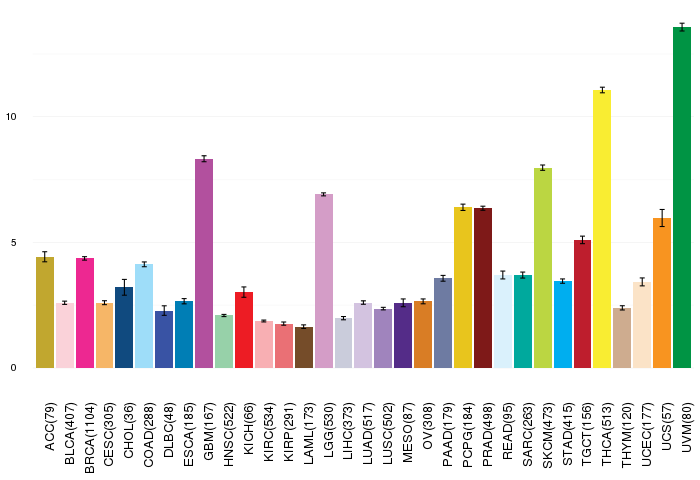
| Gene expressions across 28 cancer types (X-axis: cancer type and Y-axis: log2(norm_counts+1)) (TCGA IlluminaHiSeq_RNASeqV2, pan-cancer normalized log2(norm_counts+1) data, version 2016-08-16) |
 |
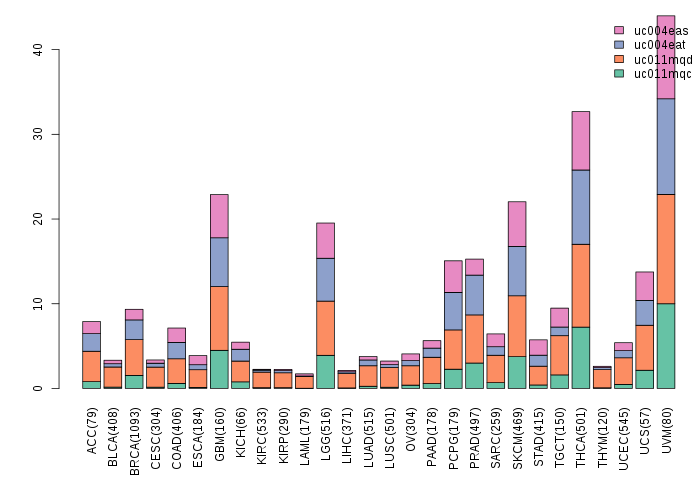
| Gene isoform expressions across 28 cancer types (X-axis: cancer type and Y-axis: log2(norm_counts+1)) (TCGA pan-cancer tcga_rsem_isoform_tpm, version 2016-09-01) |
 |
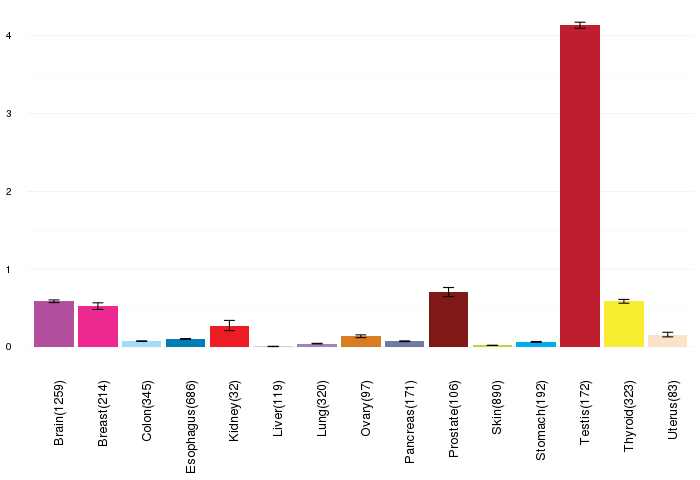
| Gene expressions across normal tissues of GTEx data (GTEx GTEx_Analysis_v6_RNA-seq_RNA-SeQCv1.1.8_gene_rpkm.gct) - Here, we shows the matched tissue types only among our 28 cancer types. |
 |
| Different expressions across 14 cancer types with more than 10 samples between matched tumors and normals (X-axis: cancer type and Y-axis: log2(norm_counts+1)) (TCGA IlluminaHiSeq_RNASeqV2, pan-cancer normalized log2(norm_counts+1) data, version 2016-08-16) |
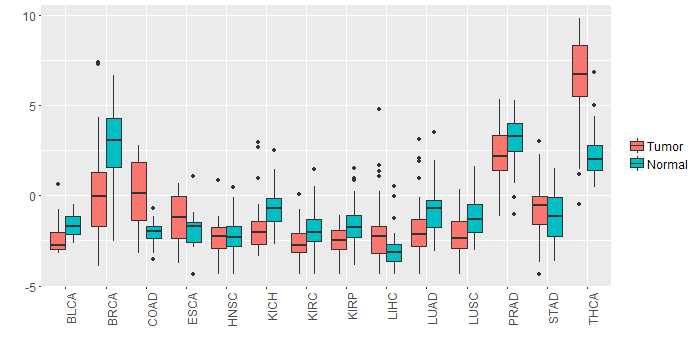 |
| - Significantly differentially expressed cancer types and information. (|Fold change|>1 and FDR<0.05) |
| Cancer type | Mean(exp) in tumor | Mean(exp) in matched normal | Log2FC | P-val. | FDR |
| COAD | 0.170714022 | -2.058316747 | 2.229030769 | 1.46E-06 | 7.94E-06 |
| THCA | 6.443377712 | 2.273982797 | 4.169394915 | 1.73E-20 | 7.66E-19 |
| LUAD | -1.953087834 | -0.810213697 | -1.142874138 | 1.74E-05 | 4.94E-05 |
| LUSC | -2.197022554 | -1.180391181 | -1.016631373 | 2.08E-05 | 4.60E-05 |
| BRCA | -0.019286383 | 2.776460109 | -2.795746491 | 2.82E-18 | 1.78E-17 |
| LIHC | -2.055724593 | -3.083704593 | 1.02798 | 0.000508 | 0.001480667 |
| Top |
| TissGene-miRNA for CITED1 |
| Significantly anti-correlated miRNAs of TissGene across 28 cancer types (Gene-miRNA relations from TargetScanHuman Relsease 7.1, Conserved_Site_Context_Scores.txt.zip, 06.01.2016) (TCGA IlluminaHiSeq_miRNASeq, log2(RPM+1) data, version 2016-11-21) (TCGA IlluminaHiSeq_RNASeqV2, log2(normalized_count+1) data, version 2016-08-16) (Spearman’s Rank Correlation (p-value<0.05 and coefficient<-0.25)) |
| Cancer type | miRNA id | miRNA accession | P-val. | Coeff. | # samples |
| Top |
| TissGeneMut for CITED1 |
| TissGeneSNV for CITED1 |
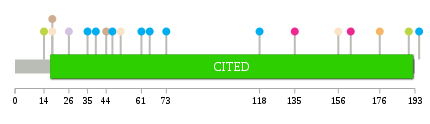
| nsSNV counts per each loci. Different colors of circles represent different cancer types. Circle size denotes number of samples. (TCGA somatic mutation (SNPs and small INDELs) data, version 2016-04-25) * Click on the image to enlarge it in a new window. |
 |
 |
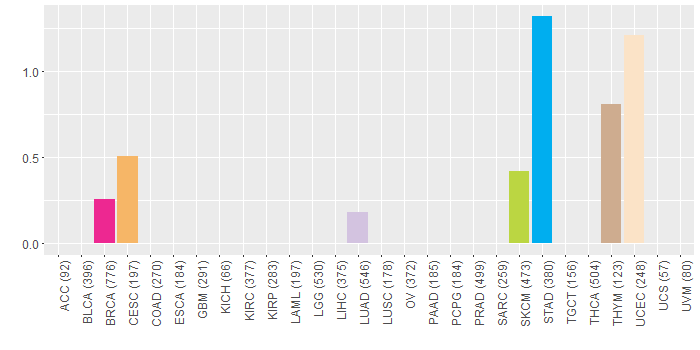
| Somatic nucleotide variants of TissGene across 28 cancer types (X-axis: cancer type and Y-axis: % of mutated samples) The numbers in parentheses are numbers of samples with mutation (nsSNVs). (TCGA somatic mutation (SNPs and small INDELs) data, version 2016-04-25) |
 |
| - nsSNVs sorted by frequency. |
| AAchange | Cancer type | # samples |
| p.E51D | UCEC | 1 |
| p.S139Y | HNSC | 1 |
| p.R195X | STAD | 1 |
| p.A156T | UCEC | 1 |
| p.R39H | STAD | 1 |
| p.R65H | STAD | 1 |
| p.R18* | UCEC | 1 |
| p.A61V | STAD | 1 |
| p.E26K | LUAD | 1 |
| p.A35V | STAD | 1 |
| p.A118E | STAD | 1 |
| p.Y47C | STAD | 1 |
| p.A135V | BRCA | 1 |
| p.G14D | SKCM | 1 |
| p.A18V | THYM | 1 |
| p.Y73C | STAD | 1 |
| p.S176L | CESC | 1 |
| p.A44V | THYM | 1 |
| p.L162P | BRCA | 1 |
| p.P190S | SKCM | 1 |
| Top |
| TissGeneCNV for CITED1 |
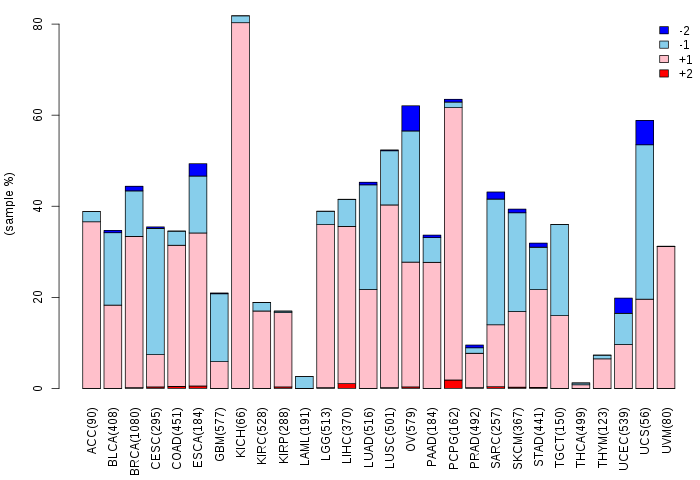
| Copy number variations of TissGene across 28 cancer types (X-axis: cancer type and Y-axis: % of CNV samples) (TCGA Gistic2_CopyNumber_Gistic2_all_data_by_genes, Gistic2 copy number data, version 2016-08-16) |
 |
| Top |
| TissGeneFusions for CITED1 |
| Fusion genes including TissGene (ChimerDB 3.0, 2016-12-01 and TCGA fusion Portal 2015-12-01) |
| Database | Src | Cancer type | Sample | Fusion gene | ORF | 5'-gene BP | 3'-gene BP |
| Top |
| TissGeneNet for CITED1 |
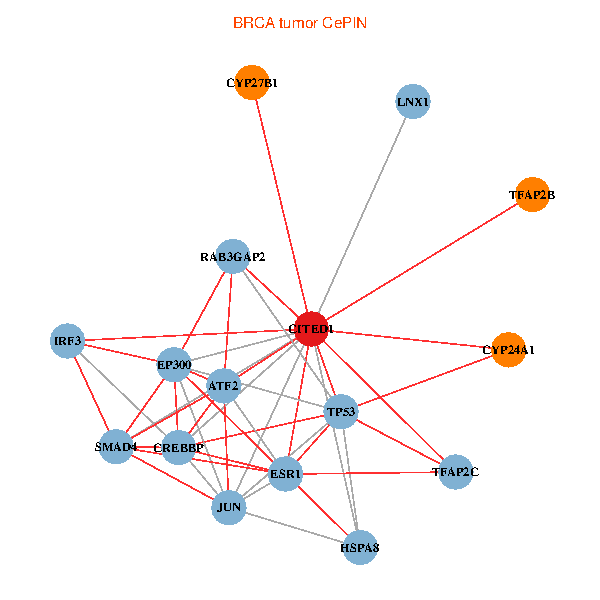
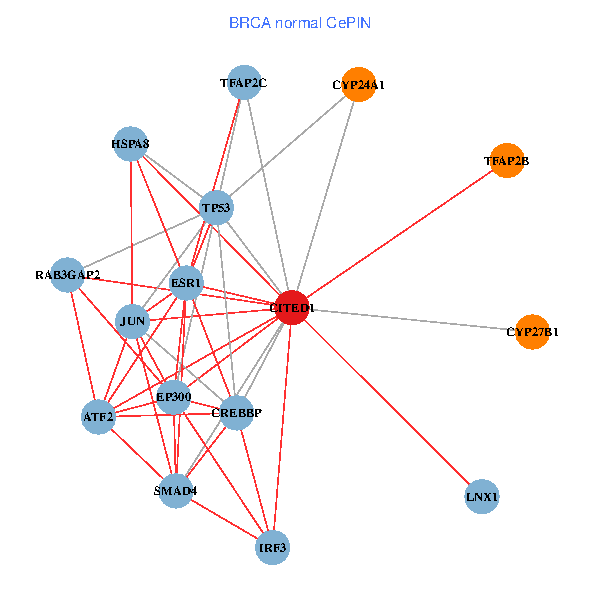
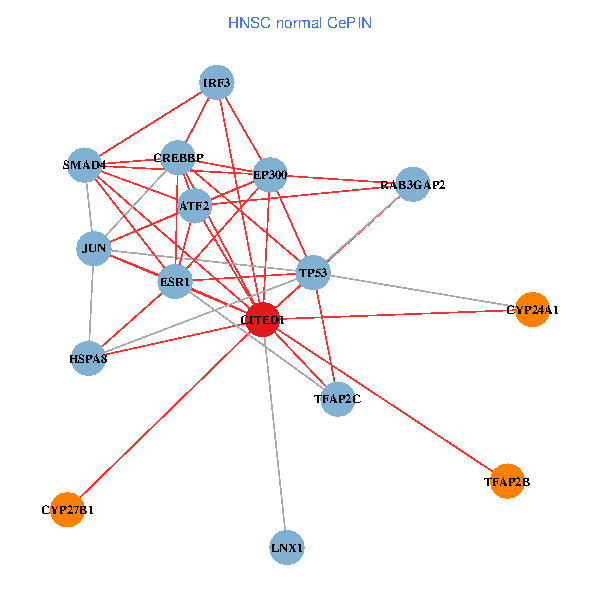
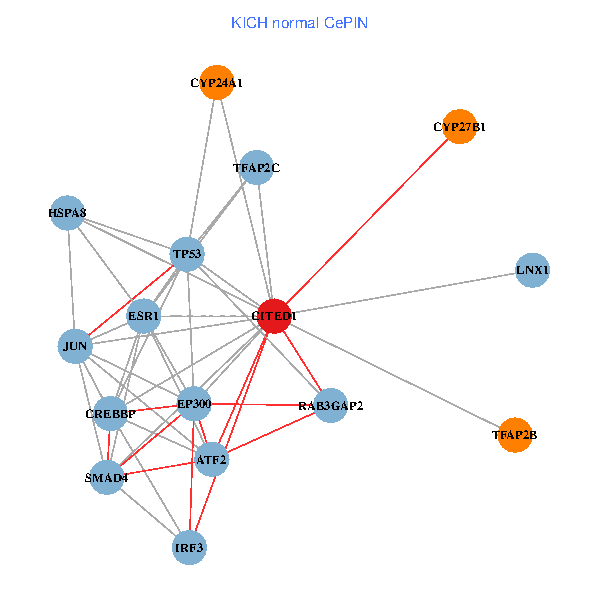
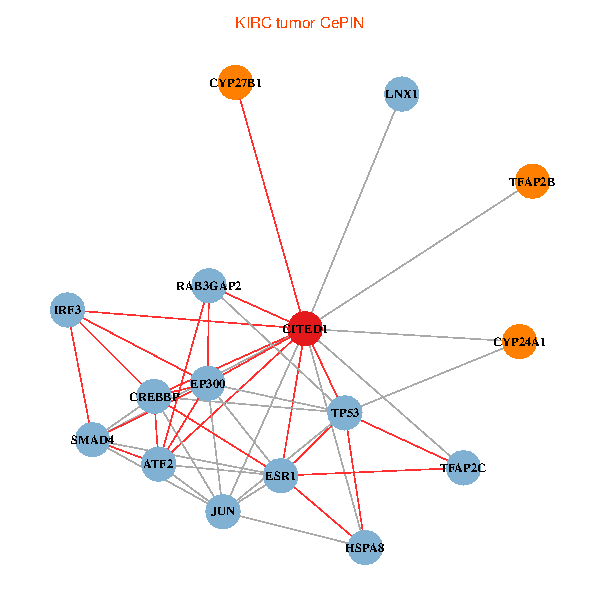
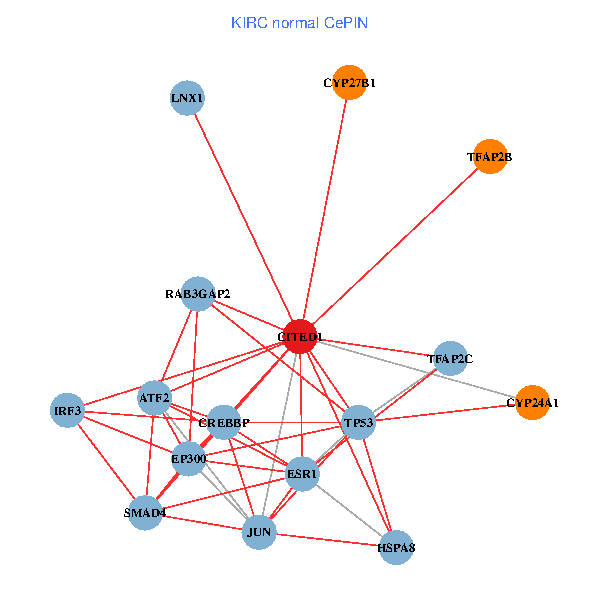
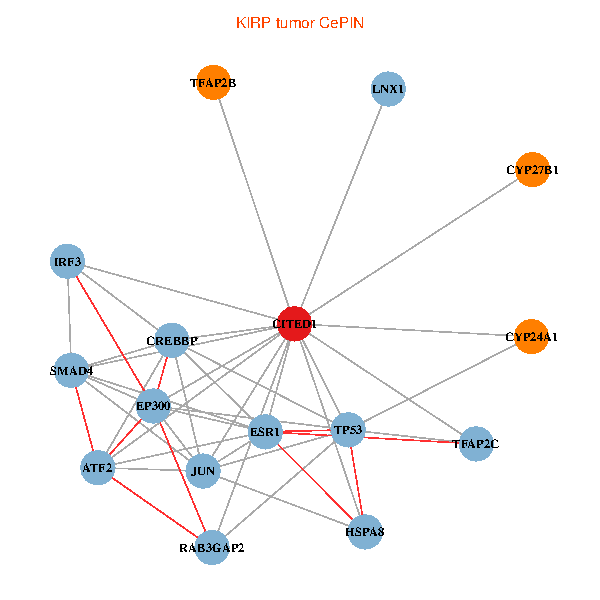
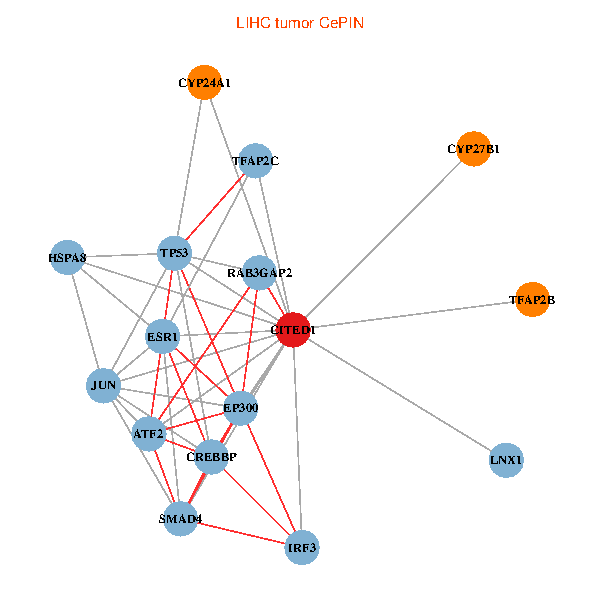
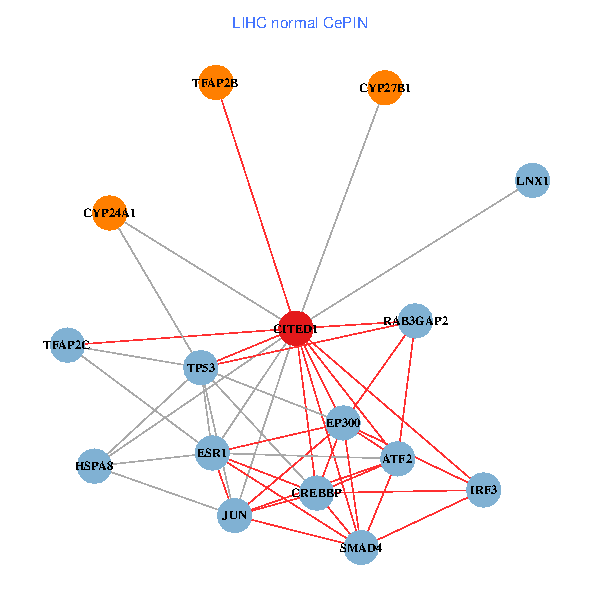
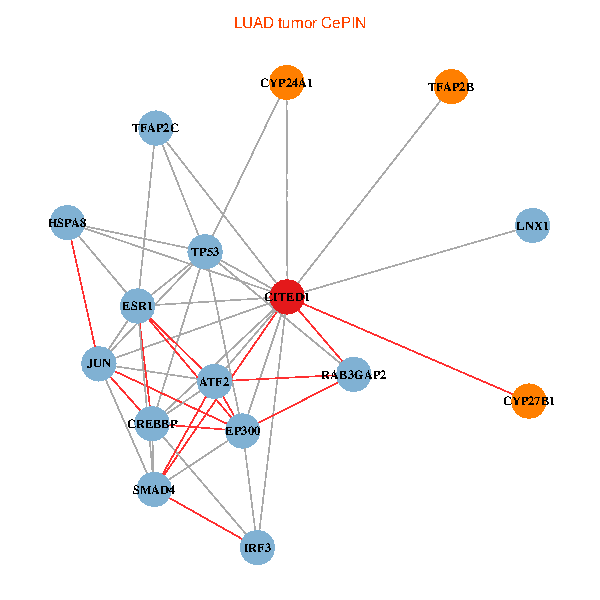
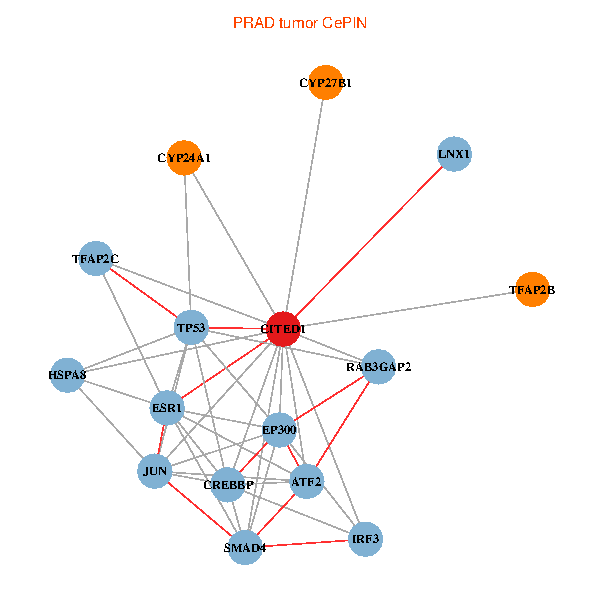
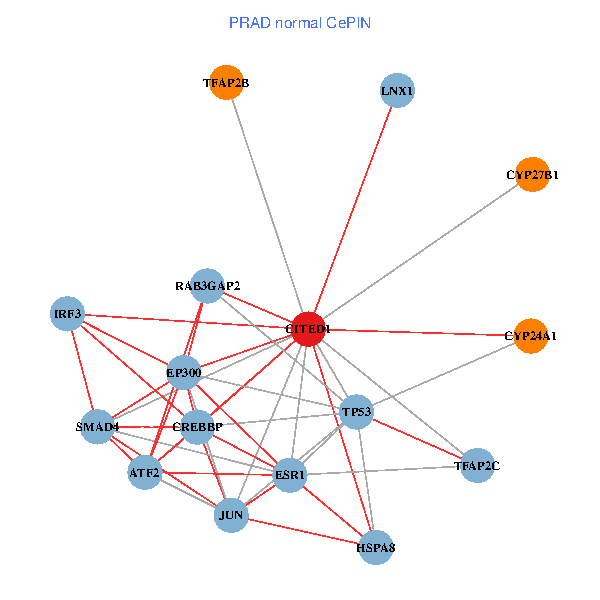
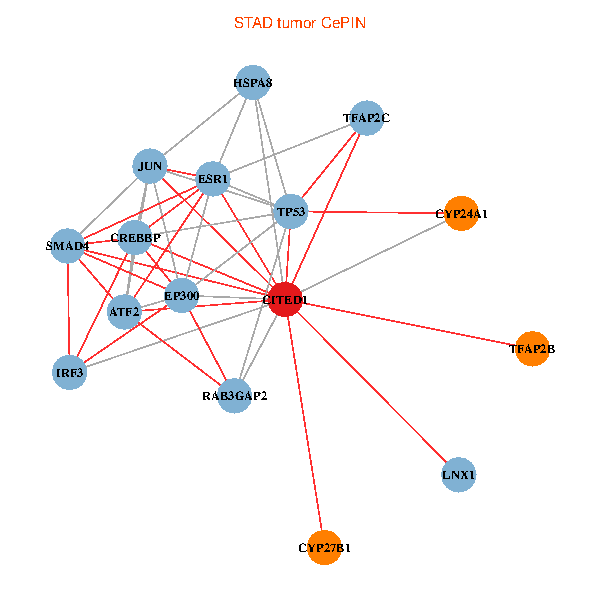
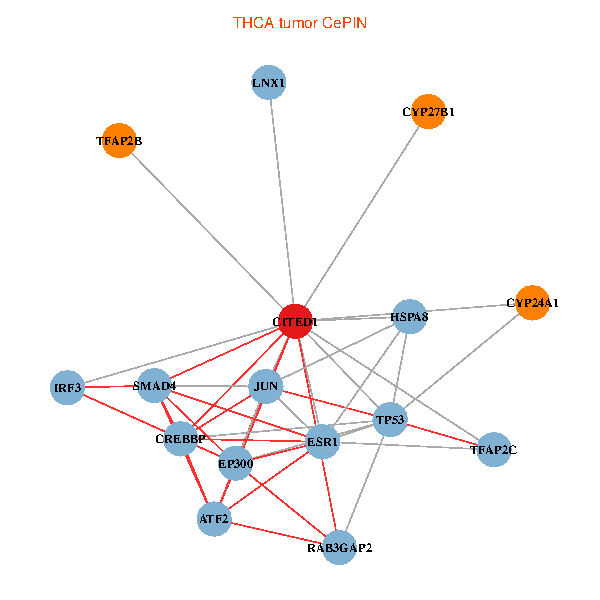
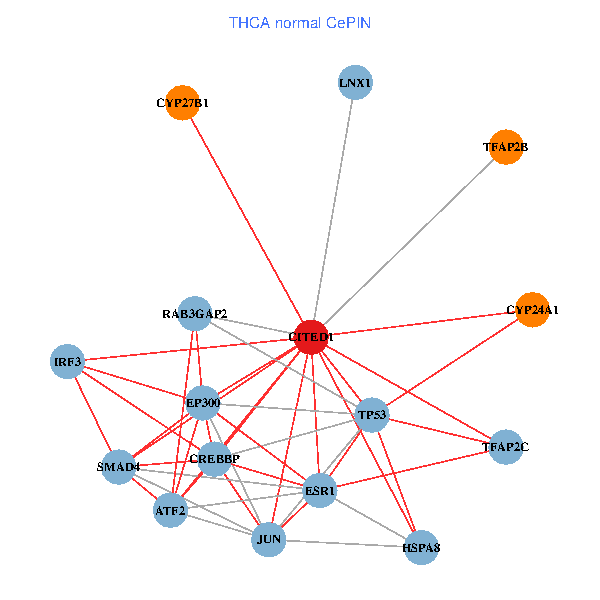
| Co-expressed gene networks based on protein-protein interaction data (CePIN) (TCGA IlluminaHiSeq_RNASeqV2, pan-cancer normalized log2(norm_counts+1) data, version 2016-08-16) (PINA2 ppi data) |
| BRCA (tumor) | BRCA (normal) |
| CITED1, TP53, JUN, ESR1, CREBBP, HSPA8, SMAD4, EP300, RAB3GAP2, ATF2, IRF3, LNX1, TFAP2C, TFAP2B, CYP27B1, CYP24A1 (tumor) | CITED1, TP53, JUN, ESR1, CREBBP, HSPA8, SMAD4, EP300, RAB3GAP2, ATF2, IRF3, LNX1, TFAP2C, TFAP2B, CYP27B1, CYP24A1 (normal) |
 |  |
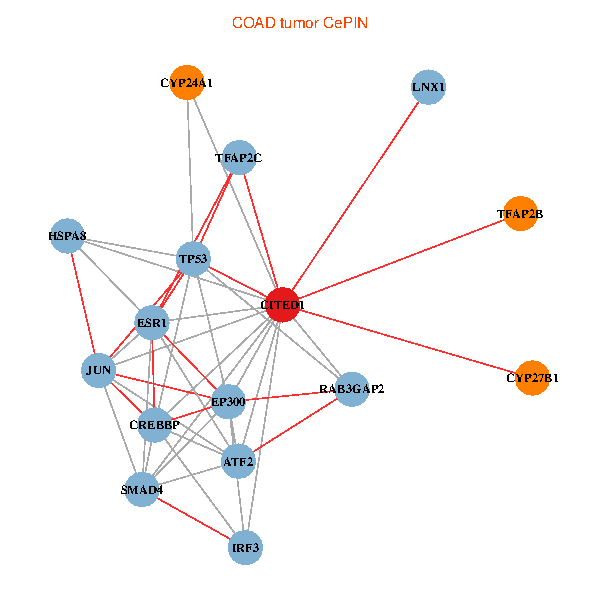
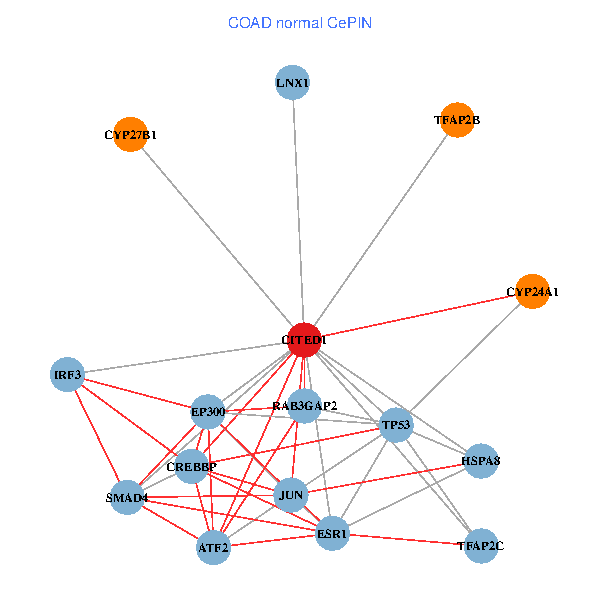
| COAD (tumor) | COAD (normal) |
| CITED1, TP53, JUN, ESR1, CREBBP, HSPA8, SMAD4, EP300, RAB3GAP2, ATF2, IRF3, LNX1, TFAP2C, TFAP2B, CYP27B1, CYP24A1 (tumor) | CITED1, TP53, JUN, ESR1, CREBBP, HSPA8, SMAD4, EP300, RAB3GAP2, ATF2, IRF3, LNX1, TFAP2C, TFAP2B, CYP27B1, CYP24A1 (normal) |
 |  |
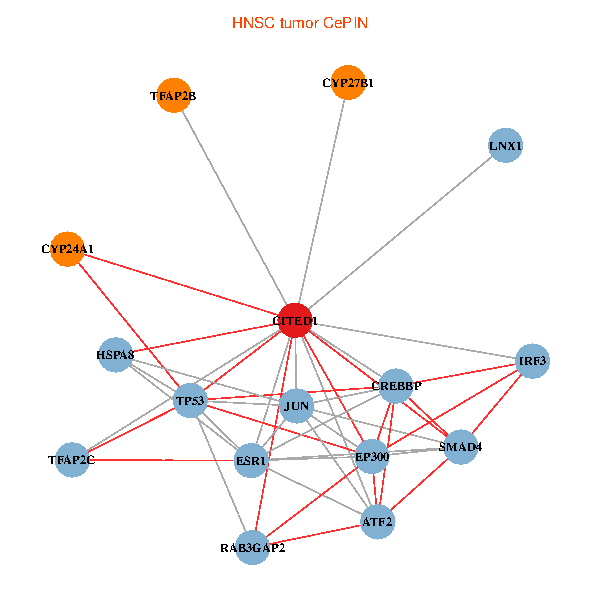
| HNSC (tumor) | HNSC (normal) |
| CITED1, TP53, JUN, ESR1, CREBBP, HSPA8, SMAD4, EP300, RAB3GAP2, ATF2, IRF3, LNX1, TFAP2C, TFAP2B, CYP27B1, CYP24A1 (tumor) | CITED1, TP53, JUN, ESR1, CREBBP, HSPA8, SMAD4, EP300, RAB3GAP2, ATF2, IRF3, LNX1, TFAP2C, TFAP2B, CYP27B1, CYP24A1 (normal) |
 |  |
| KICH (tumor) | KICH (normal) |
| CITED1, TP53, JUN, ESR1, CREBBP, HSPA8, SMAD4, EP300, RAB3GAP2, ATF2, IRF3, LNX1, TFAP2C, TFAP2B, CYP27B1, CYP24A1 (tumor) | CITED1, TP53, JUN, ESR1, CREBBP, HSPA8, SMAD4, EP300, RAB3GAP2, ATF2, IRF3, LNX1, TFAP2C, TFAP2B, CYP27B1, CYP24A1 (normal) |
 |  |
| KIRC (tumor) | KIRC (normal) |
| CITED1, TP53, JUN, ESR1, CREBBP, HSPA8, SMAD4, EP300, RAB3GAP2, ATF2, IRF3, LNX1, TFAP2C, TFAP2B, CYP27B1, CYP24A1 (tumor) | CITED1, TP53, JUN, ESR1, CREBBP, HSPA8, SMAD4, EP300, RAB3GAP2, ATF2, IRF3, LNX1, TFAP2C, TFAP2B, CYP27B1, CYP24A1 (normal) |
 |  |
| KIRP (tumor) | KIRP (normal) |
| CITED1, TP53, JUN, ESR1, CREBBP, HSPA8, SMAD4, EP300, RAB3GAP2, ATF2, IRF3, LNX1, TFAP2C, TFAP2B, CYP27B1, CYP24A1 (tumor) | CITED1, TP53, JUN, ESR1, CREBBP, HSPA8, SMAD4, EP300, RAB3GAP2, ATF2, IRF3, LNX1, TFAP2C, TFAP2B, CYP27B1, CYP24A1 (normal) |
 |  |
| LIHC (tumor) | LIHC (normal) |
| CITED1, TP53, JUN, ESR1, CREBBP, HSPA8, SMAD4, EP300, RAB3GAP2, ATF2, IRF3, LNX1, TFAP2C, TFAP2B, CYP27B1, CYP24A1 (tumor) | CITED1, TP53, JUN, ESR1, CREBBP, HSPA8, SMAD4, EP300, RAB3GAP2, ATF2, IRF3, LNX1, TFAP2C, TFAP2B, CYP27B1, CYP24A1 (normal) |
 |  |
| LUAD (tumor) | LUAD (normal) |
| CITED1, TP53, JUN, ESR1, CREBBP, HSPA8, SMAD4, EP300, RAB3GAP2, ATF2, IRF3, LNX1, TFAP2C, TFAP2B, CYP27B1, CYP24A1 (tumor) | CITED1, TP53, JUN, ESR1, CREBBP, HSPA8, SMAD4, EP300, RAB3GAP2, ATF2, IRF3, LNX1, TFAP2C, TFAP2B, CYP27B1, CYP24A1 (normal) |
 |  |
| LUSC (tumor) | LUSC (normal) |
| CITED1, TP53, JUN, ESR1, CREBBP, HSPA8, SMAD4, EP300, RAB3GAP2, ATF2, IRF3, LNX1, TFAP2C, TFAP2B, CYP27B1, CYP24A1 (tumor) | CITED1, TP53, JUN, ESR1, CREBBP, HSPA8, SMAD4, EP300, RAB3GAP2, ATF2, IRF3, LNX1, TFAP2C, TFAP2B, CYP27B1, CYP24A1 (normal) |
 |  |
| PRAD (tumor) | PRAD (normal) |
| CITED1, TP53, JUN, ESR1, CREBBP, HSPA8, SMAD4, EP300, RAB3GAP2, ATF2, IRF3, LNX1, TFAP2C, TFAP2B, CYP27B1, CYP24A1 (tumor) | CITED1, TP53, JUN, ESR1, CREBBP, HSPA8, SMAD4, EP300, RAB3GAP2, ATF2, IRF3, LNX1, TFAP2C, TFAP2B, CYP27B1, CYP24A1 (normal) |
 |  |
| STAD (tumor) | STAD (normal) |
| CITED1, TP53, JUN, ESR1, CREBBP, HSPA8, SMAD4, EP300, RAB3GAP2, ATF2, IRF3, LNX1, TFAP2C, TFAP2B, CYP27B1, CYP24A1 (tumor) | CITED1, TP53, JUN, ESR1, CREBBP, HSPA8, SMAD4, EP300, RAB3GAP2, ATF2, IRF3, LNX1, TFAP2C, TFAP2B, CYP27B1, CYP24A1 (normal) |
 |  |
| THCA (tumor) | THCA (normal) |
| CITED1, TP53, JUN, ESR1, CREBBP, HSPA8, SMAD4, EP300, RAB3GAP2, ATF2, IRF3, LNX1, TFAP2C, TFAP2B, CYP27B1, CYP24A1 (tumor) | CITED1, TP53, JUN, ESR1, CREBBP, HSPA8, SMAD4, EP300, RAB3GAP2, ATF2, IRF3, LNX1, TFAP2C, TFAP2B, CYP27B1, CYP24A1 (normal) |
 |  |
| Top |
| TissGeneProg for CITED1 |
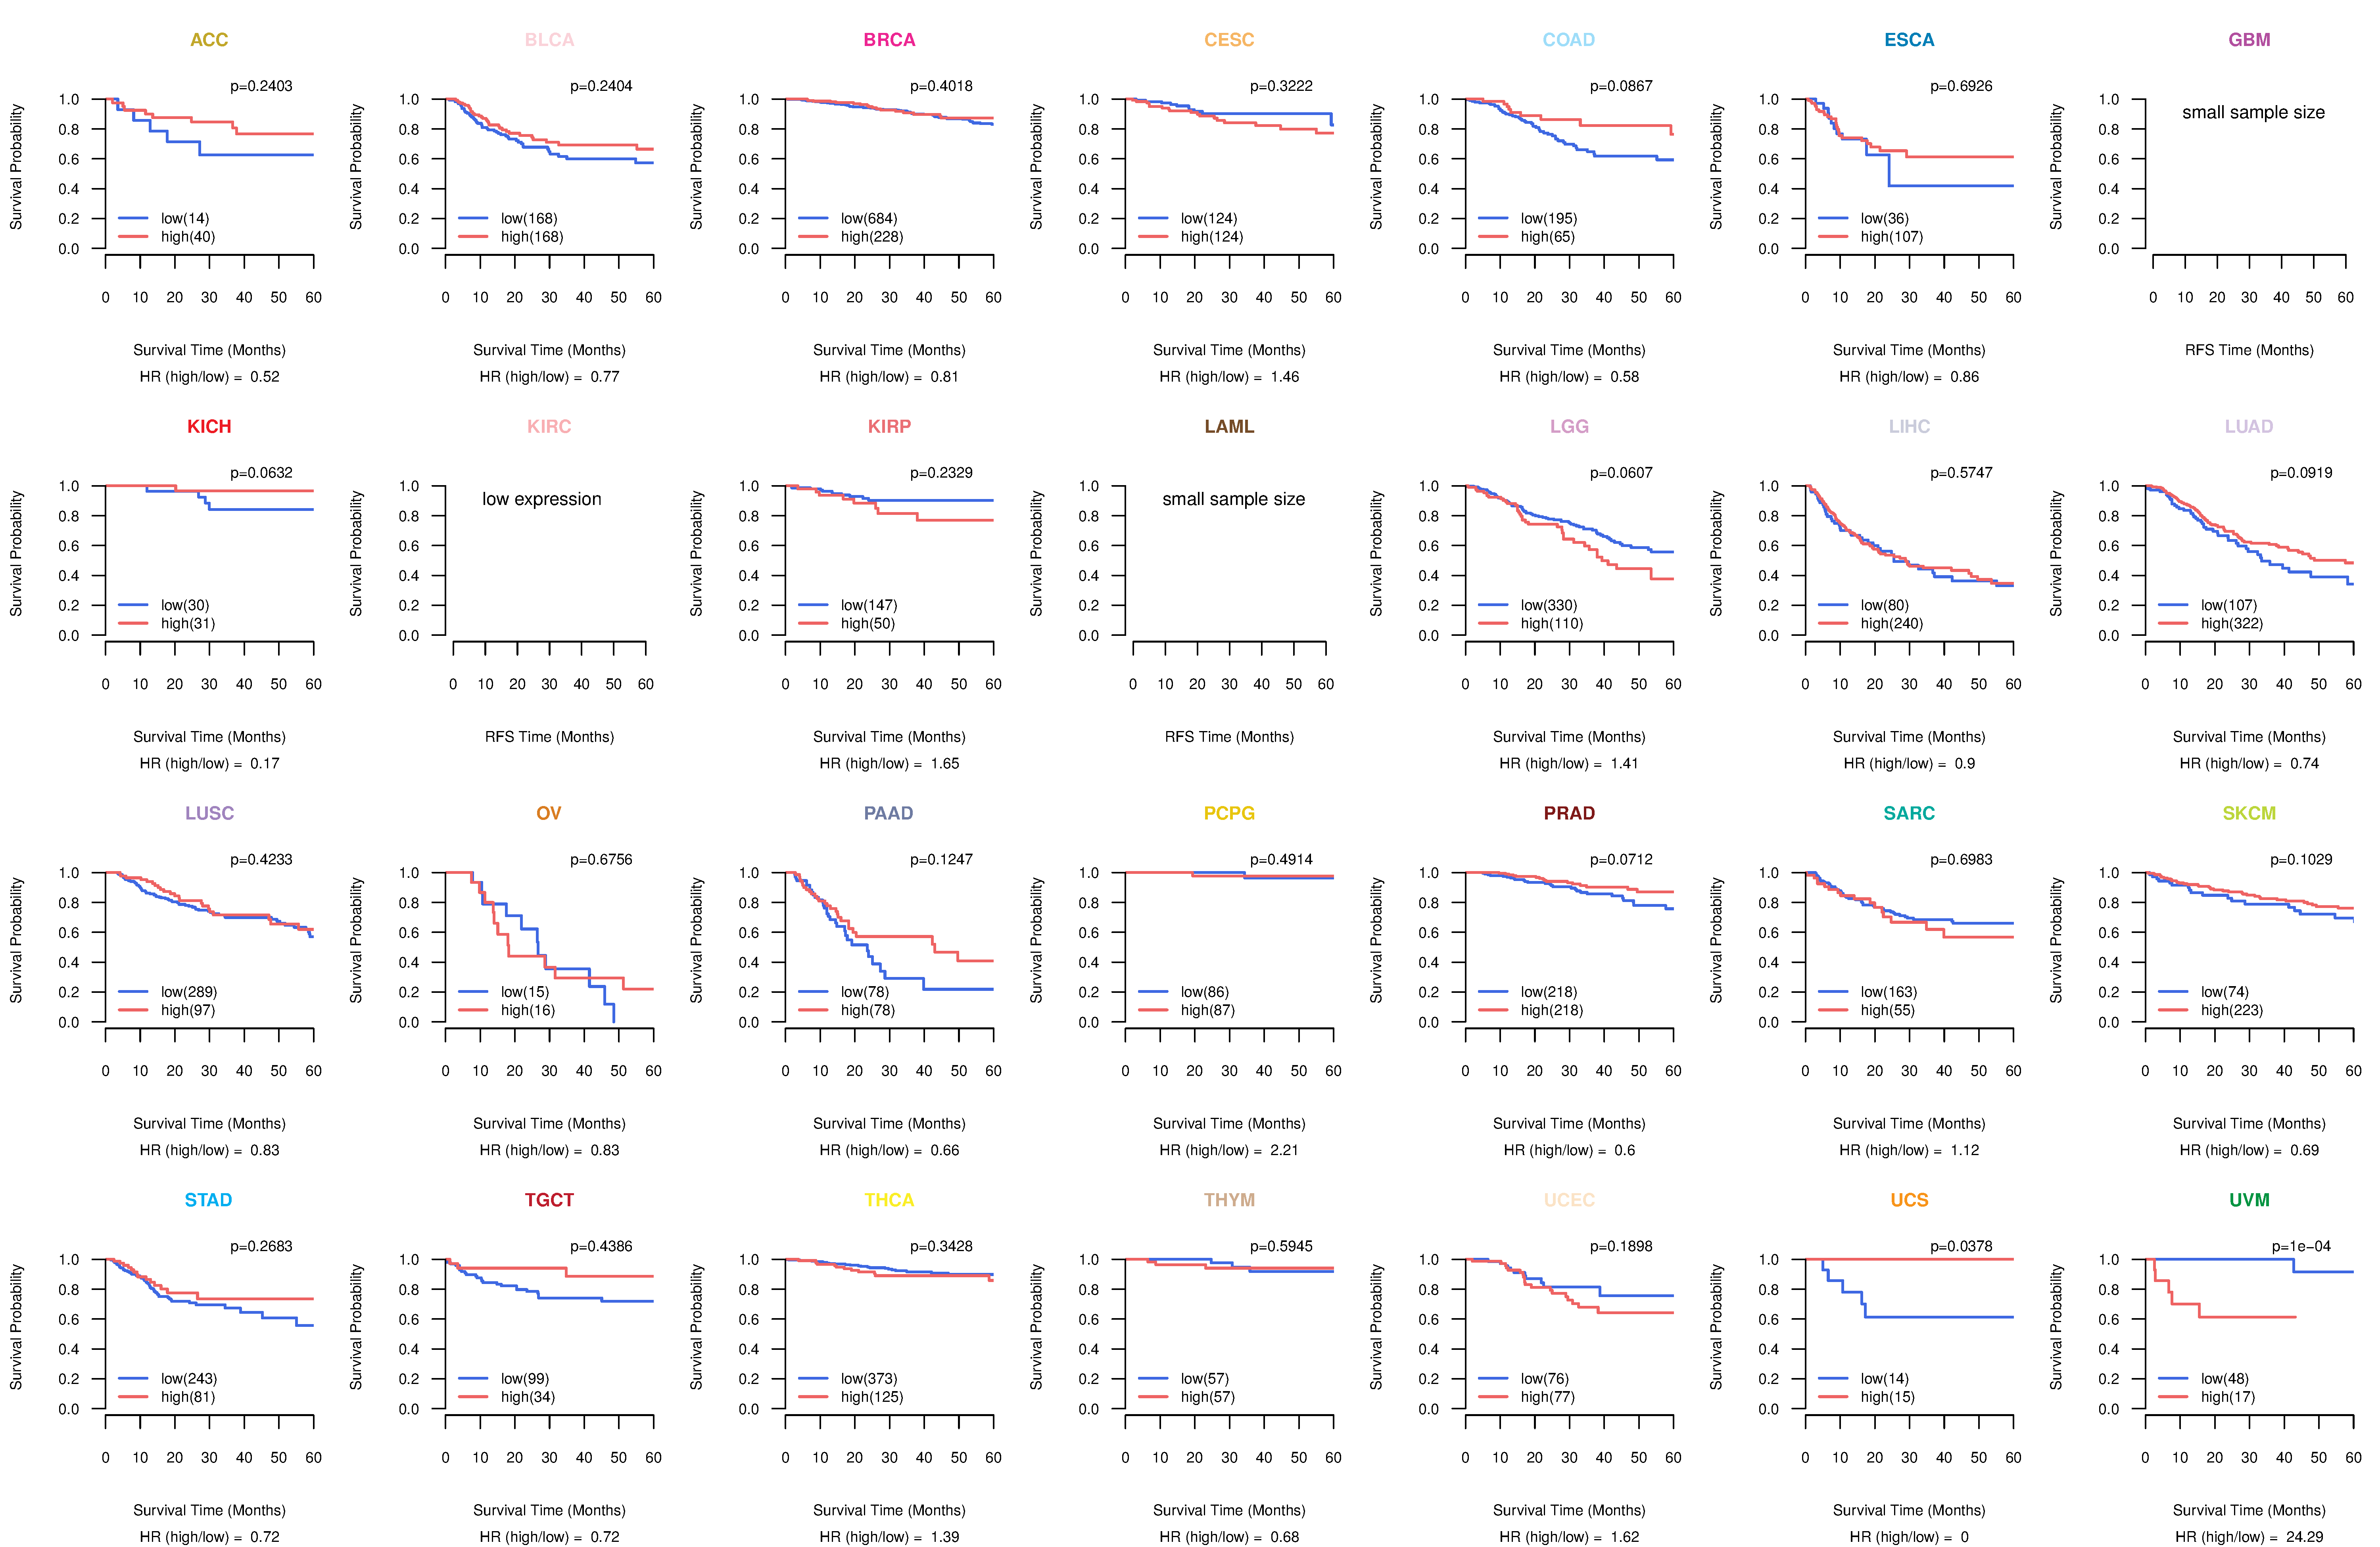
| Kaplan-Meier plots with logrank tests of overall survival (OS) using 28 cancer types (TCGA IlluminaHiSeq_RNASeqV2, pan-cancer normalized log2(norm_counts+1) data, version 2016-08-16) (TCGA clinicalMatrix, phenotype data, version 2016-04-27) * Click on the image to enlarge it in a new window. |
 |
| Kaplan-Meier plots with logrank test of relapse free survival (RFS) using 28 cancer types (TCGA IlluminaHiSeq_RNASeqV2, pan-cancer normalized log2(norm_counts+1) data, version 2016-08-16) (TCGA clinicalMatrix, phenotype data, version 2016-04-27) * Click on the image enlarge it in a new window. |
 |
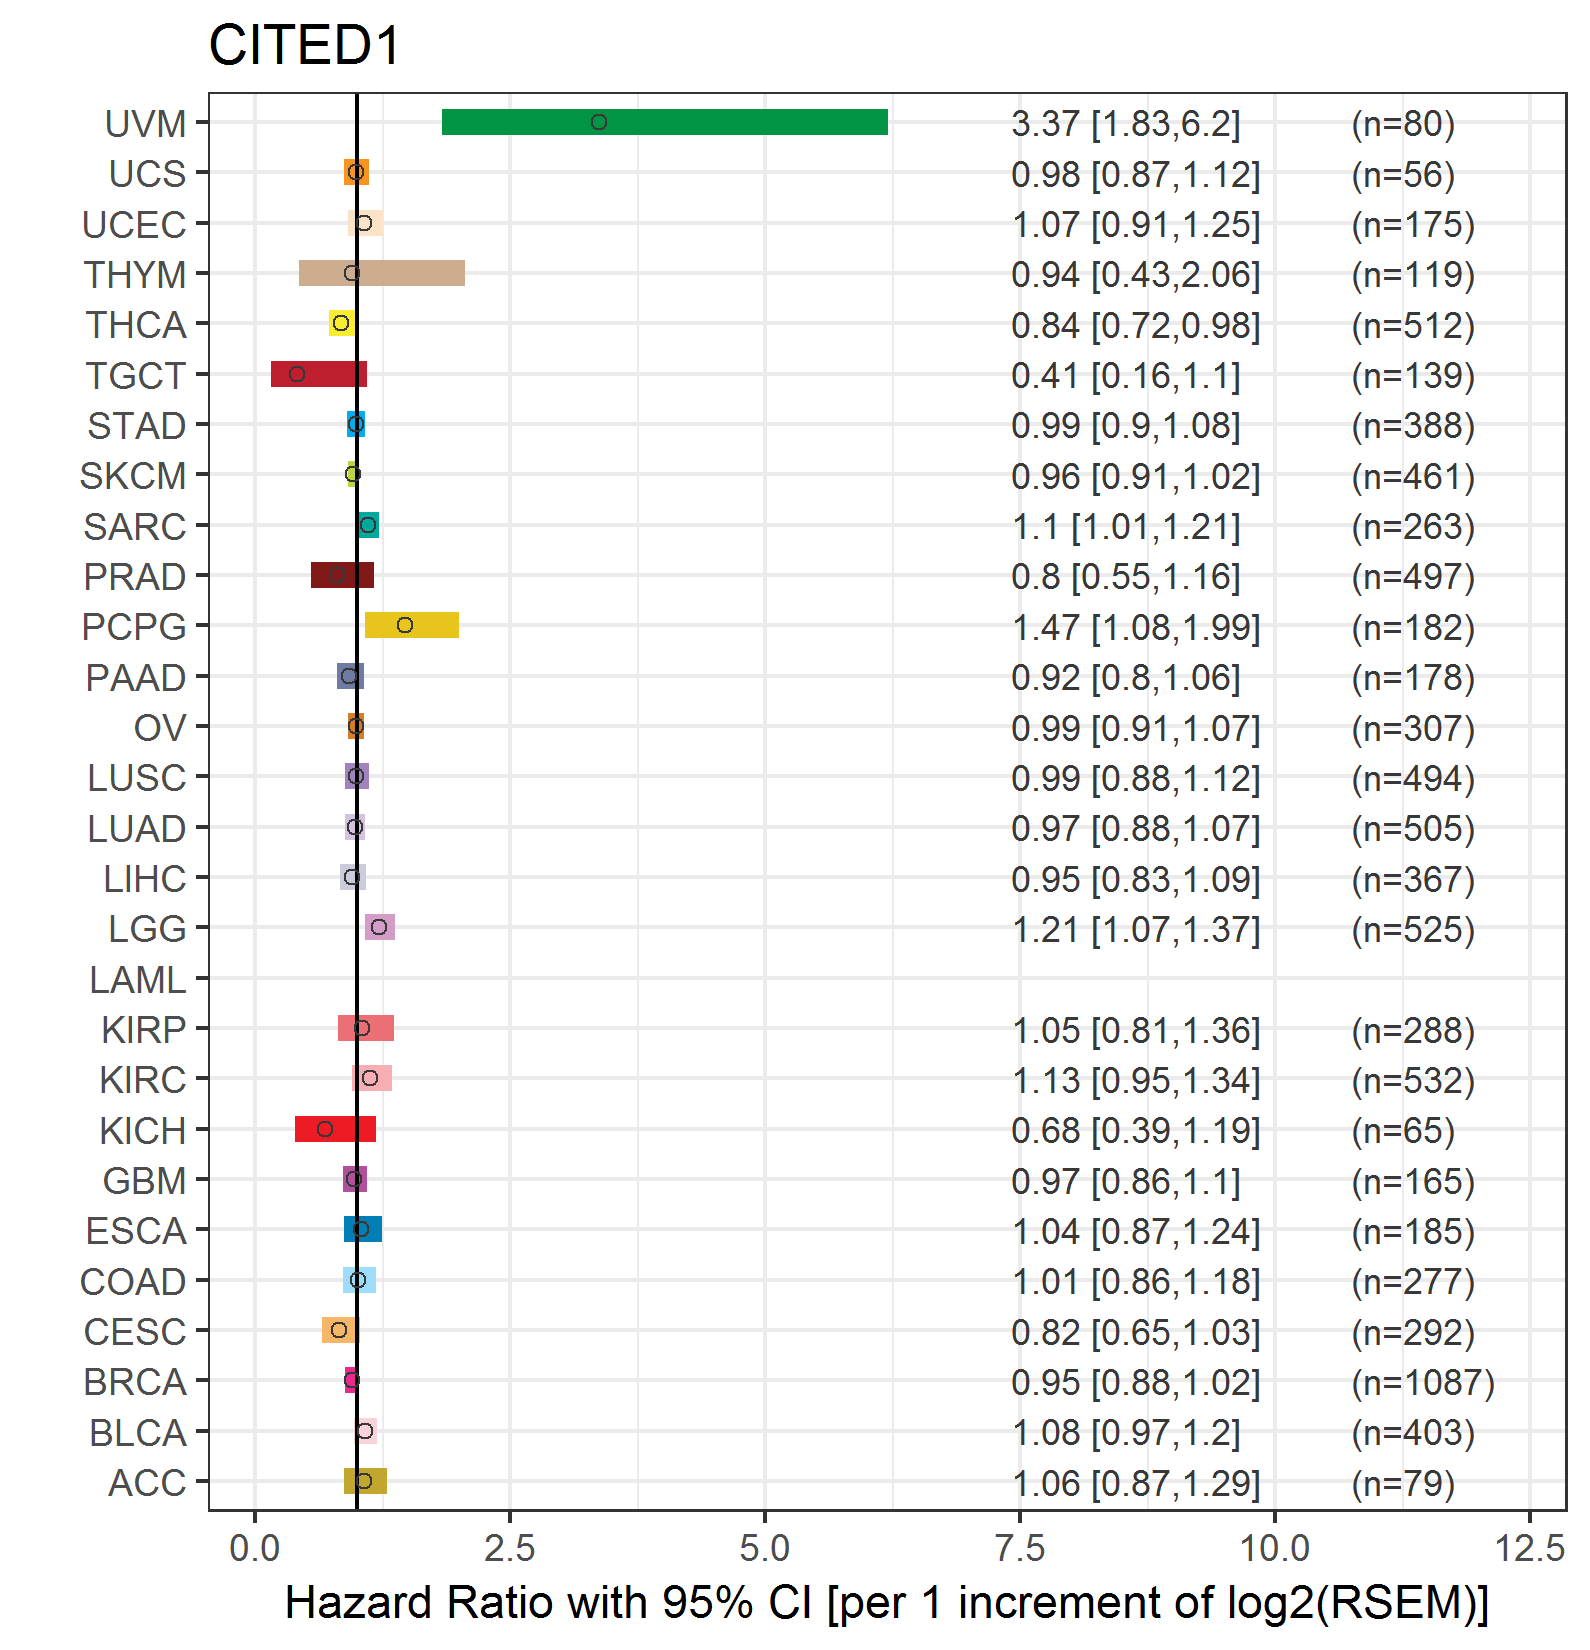
| Forest plot of Cox proportional hazard ratio (HR) and 95% CI of overall survival (OS) using 28 cancer types (TCGA IlluminaHiSeq_RNASeqV2, pan-cancer normalized log2(norm_counts+1) data, version 2016-08-16) (TCGA clinicalMatrix, phenotype data, version 2016-04-27) * Click on the image enlarge it in a new window. |
 |
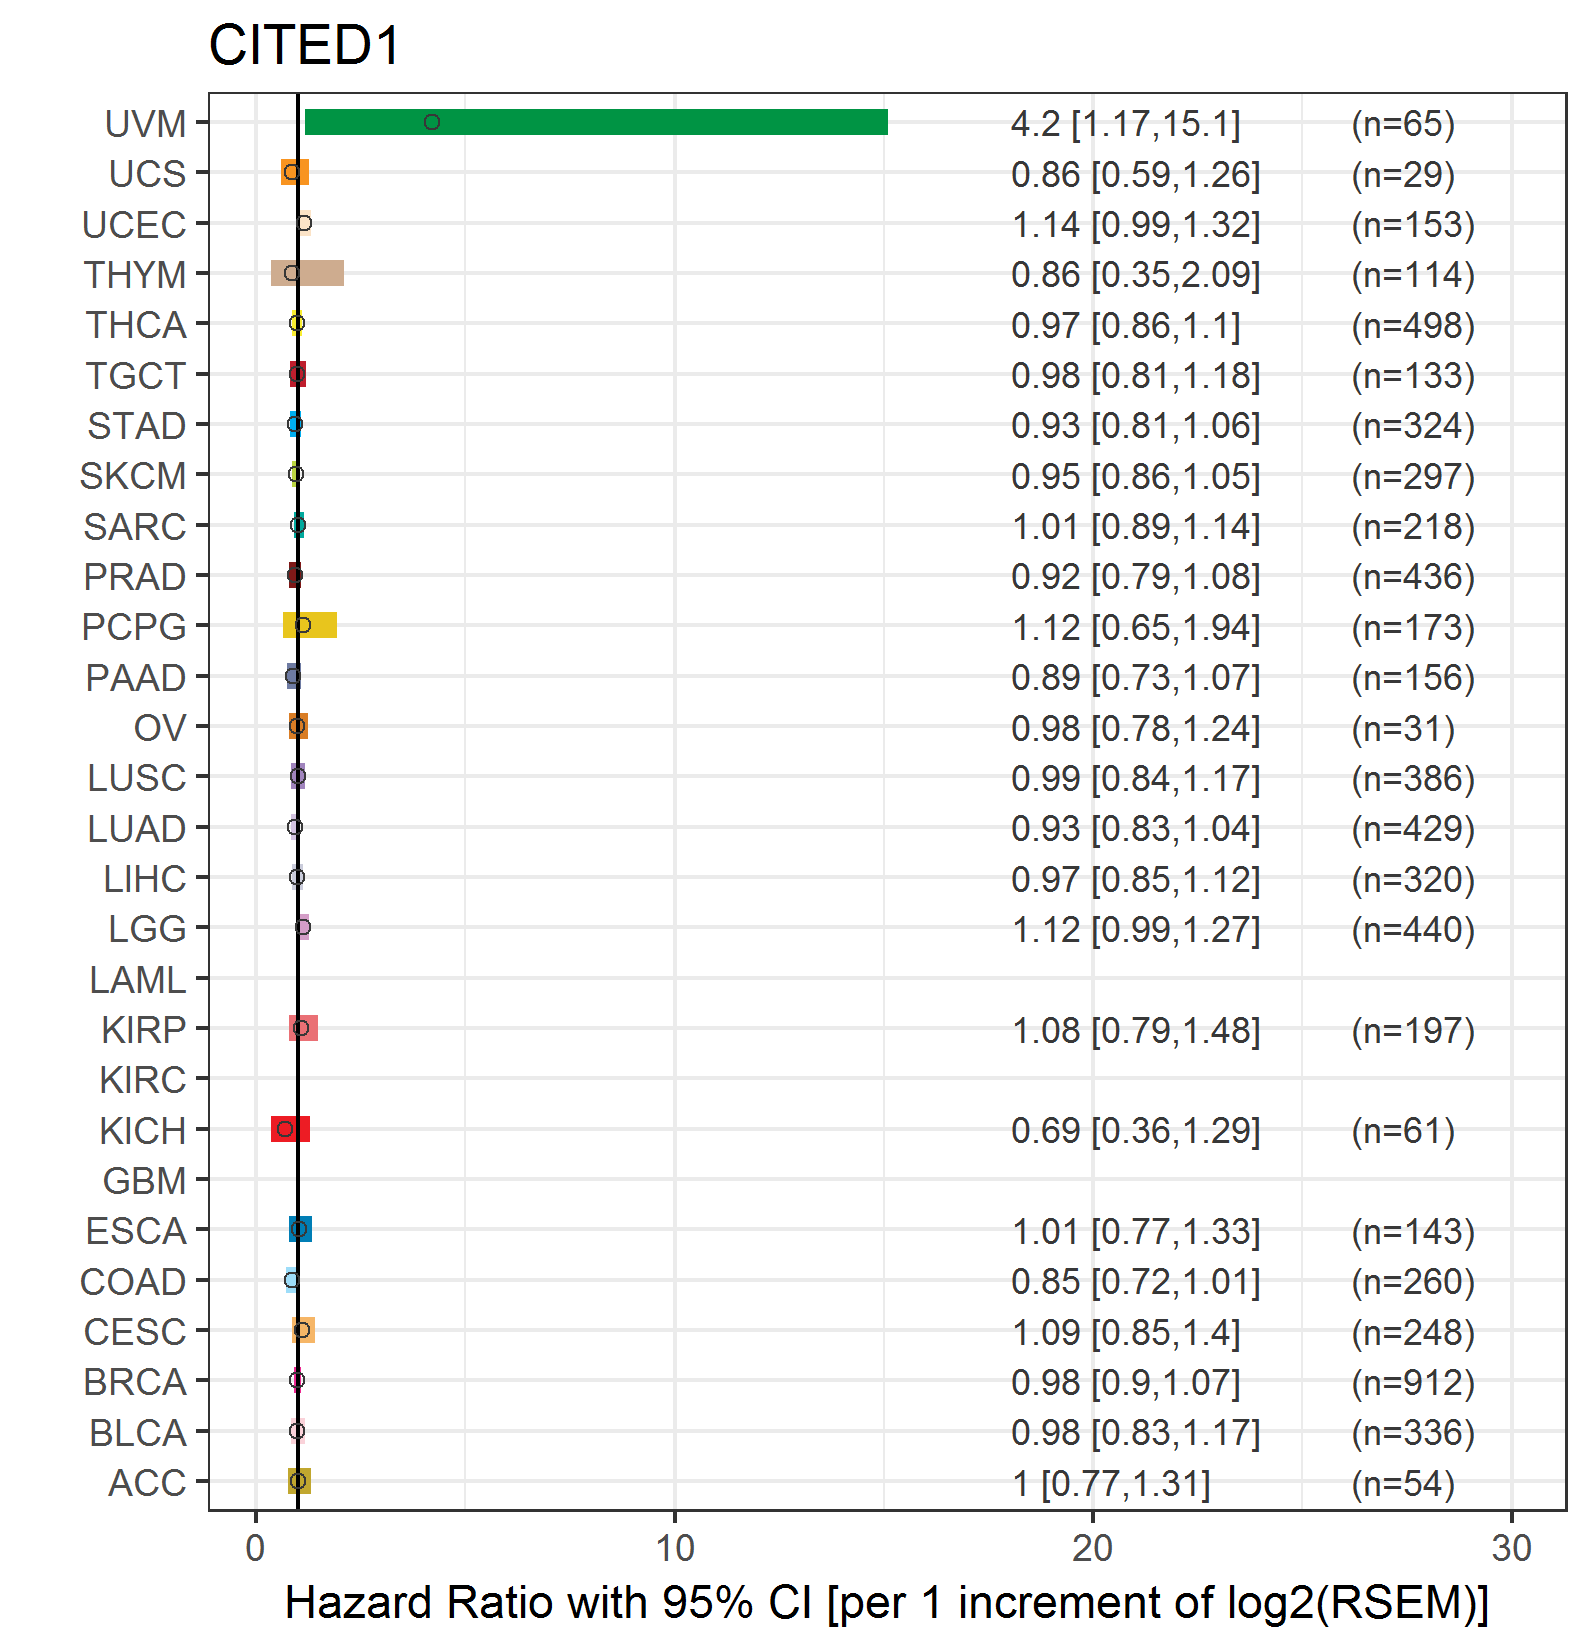
| Forest plot of Cox proportional hazard ratio (HR) and 95% CI of relapse free survival (RFS) using 28 cancer types (TCGA IlluminaHiSeq_RNASeqV2, pan-cancer normalized log2(norm_counts+1) data, version 2016-08-16) (TCGA clinicalMatrix, phenotype data, version 2016-04-27) * Click on the image enlarge it in a new window. |
 |
| Top |
| TissGeneClin for CITED1 |
| TissGeneDrug for CITED1 |
| Drug information targeting TissGene (DrugBank Version 5.0.6, 2017-04-01) |
| DrugBank ID | Drug name | Drug activity | Drug type | Drug status |
| Top |
| TissGeneDisease for CITED1 |
| Disease information associated with TissGene (DisGeNet, 2016-06-01) |
| Disease ID | Disease name | # pubmeds | Source |
| umls:C0027708 | Nephroblastoma | 5 | BeFree |
| umls:C0025202 | melanoma | 4 | BeFree |
| umls:C0596263 | Carcinogenesis | 3 | BeFree |
| umls:C0006142 | Malignant neoplasm of breast | 2 | BeFree |
| umls:C0027960 | Nevus | 2 | BeFree |
| umls:C0027962 | Melanocytic nevus | 2 | BeFree |
| umls:C0032051 | Placental Insufficiency | 2 | BeFree |
| umls:C0678222 | Breast Carcinoma | 2 | BeFree |
| umls:C1456781 | Benign melanocytic nevus | 2 | BeFree |
| umls:C3665593 | Melanocytic nevus of skin | 2 | BeFree |
| umls:C0001430 | Adenoma | 1 | BeFree |
| umls:C0023903 | Liver neoplasms | 1 | BeFree |
| umls:C0040136 | Thyroid Neoplasm | 1 | BeFree |
| umls:C0162835 | Hypopigmentation disorder | 1 | BeFree |
| umls:C0206624 | Hepatoblastoma | 1 | BeFree |
| umls:C0206682 | Follicular thyroid carcinoma | 1 | BeFree |
| umls:C0235831 | Renal Cell Dysplasia | 1 | BeFree |
| umls:C0238463 | Papillary thyroid carcinoma | 1 | BeFree |
| umls:C0334488 | Clear cell sarcoma of kidney | 1 | BeFree |
| umls:C1458155 | Mammary Neoplasms | 1 | BeFree |
| umls:C3536714 | Renal dysplasia | 1 | BeFree |
|
Copyright 2016-Present - The University of Texas Health Science Center at Houston (UTHealth) Web File Viewing | How to Report, Fraud, Waste and Abuse | State of Texas | Statewide Search | Texas Homeland Security | Site Policies |