 |
| |
| |
| |
| |
| |
| |
|

| TissGeneSummary for ACR |
 Gene summary Gene summary |
| Basic gene information | Gene symbol | ACR |
| Gene name | acrosin | |
| Synonyms | - | |
| Cytomap | UCSC genome browser: 22q13.33 | |
| Type of gene | protein-coding | |
| RefGenes | NM_001097.2, | |
| Description | acrosin light and heavy chain prepropeptidepreproacrosinproacrosin | |
| Modification date | 20141207 | |
| dbXrefs | MIM : 102480 | |
| HGNC : HGNC | ||
| Ensembl : ENSG00000100312 | ||
| HPRD : 06342 | ||
| Vega : OTTHUMG00000150155 | ||
| Protein | UniProt: go to UniProt's Cross Reference DB Table | |
| Expression | CleanEX: HS_ACR | |
| BioGPS: 49 | ||
| Pathway | NCI Pathway Interaction Database: ACR | |
| KEGG: ACR | ||
| REACTOME: ACR | ||
| Pathway Commons: ACR | ||
| Context | iHOP: ACR | |
| ligand binding site mutation search in PubMed: ACR | ||
| UCL Cancer Institute: ACR | ||
| Assigned class in TissGDB* | C | |
| Included tissue-specific gene expression resources | HPA,GTEx | |
| Specific-tissues in normal samples (assigned by TissGDB using HPA, TiGER, and GTEx) | Testis | |
| Cancer types related to the specific-tissues in cancer samples (assigned by TissGDB using TCGA) | TGCT | |
| Reference showing the relevant tissue of ACR | ||
| Description by TissGene annotations | ||
| * Class A consists of genes with literature evidence and is part of the cTissGenes. Class B consists of only cTissGenes without additional evidence. The remaining genes belong to Class C. |
| Gene ontology having evidence of Inferred from Direct Assay (IDA) from Entrez |
| GO ID | GO term | PubMed ID | GO:0007190 | activation of adenylate cyclase activity | 3880736 | GO:0007341 | penetration of zona pellucida | 10369396 | GO:0007190 | activation of adenylate cyclase activity | 3880736 | GO:0007341 | penetration of zona pellucida | 10369396 |
| Top |
| TissGeneExp for ACR |
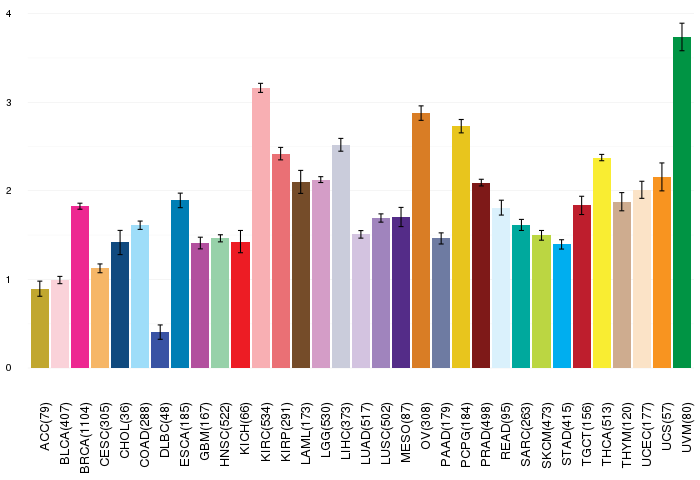
| Gene expressions across 28 cancer types (X-axis: cancer type and Y-axis: log2(norm_counts+1)) (TCGA IlluminaHiSeq_RNASeqV2, pan-cancer normalized log2(norm_counts+1) data, version 2016-08-16) |
 |
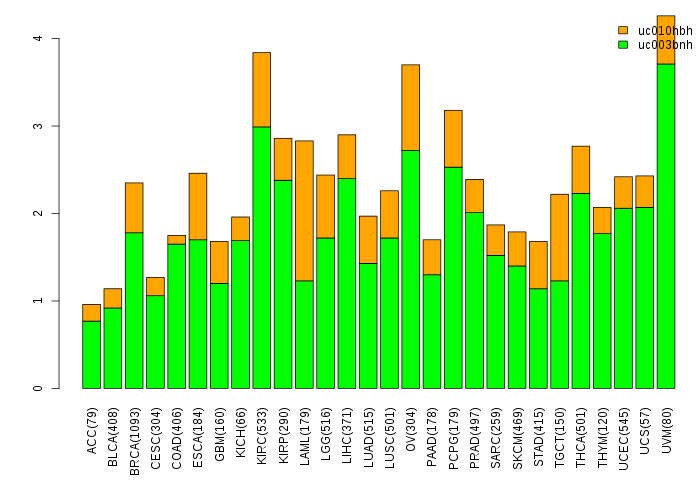
| Gene isoform expressions across 28 cancer types (X-axis: cancer type and Y-axis: log2(norm_counts+1)) (TCGA pan-cancer tcga_rsem_isoform_tpm, version 2016-09-01) |
 |
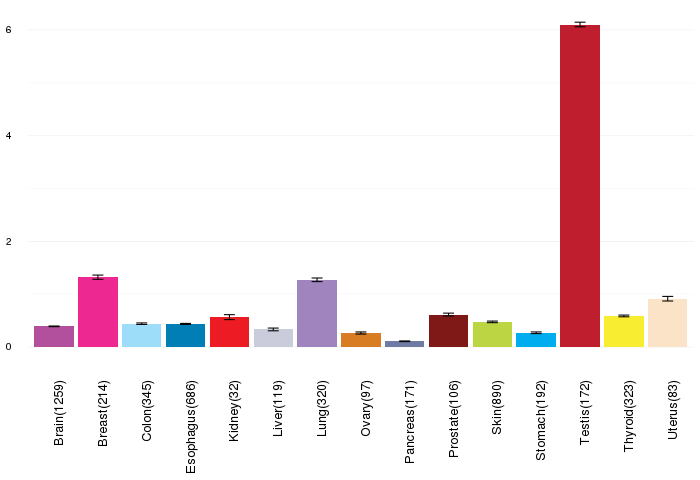
| Gene expressions across normal tissues of GTEx data (GTEx GTEx_Analysis_v6_RNA-seq_RNA-SeQCv1.1.8_gene_rpkm.gct) - Here, we shows the matched tissue types only among our 28 cancer types. |
 |
| Different expressions across 14 cancer types with more than 10 samples between matched tumors and normals (X-axis: cancer type and Y-axis: log2(norm_counts+1)) (TCGA IlluminaHiSeq_RNASeqV2, pan-cancer normalized log2(norm_counts+1) data, version 2016-08-16) |
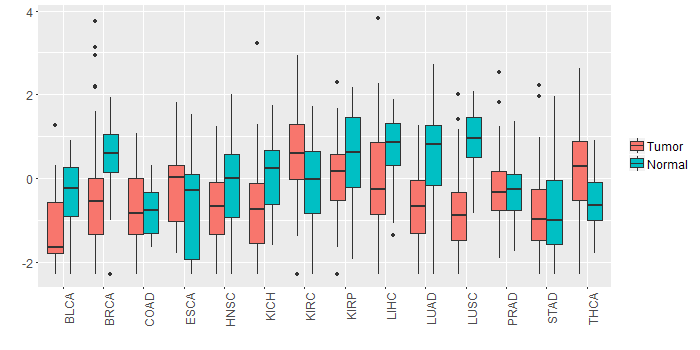 |
| - Significantly differentially expressed cancer types and information. (|Fold change|>1 and FDR<0.05) |
| Cancer type | Mean(exp) in tumor | Mean(exp) in matched normal | Log2FC | P-val. | FDR |
| LUAD | -0.688816462 | 0.64398009 | -1.332796552 | 1.30E-11 | 8.81E-11 |
| BRCA | -0.511353273 | 0.557581814 | -1.068935088 | 4.40E-15 | 2.29E-14 |
| LUSC | -0.806121127 | 0.904018089 | -1.710139216 | 2.13E-16 | 1.58E-15 |
| Top |
| TissGene-miRNA for ACR |
| Significantly anti-correlated miRNAs of TissGene across 28 cancer types (Gene-miRNA relations from TargetScanHuman Relsease 7.1, Conserved_Site_Context_Scores.txt.zip, 06.01.2016) (TCGA IlluminaHiSeq_miRNASeq, log2(RPM+1) data, version 2016-11-21) (TCGA IlluminaHiSeq_RNASeqV2, log2(normalized_count+1) data, version 2016-08-16) (Spearman’s Rank Correlation (p-value<0.05 and coefficient<-0.25)) |
| Cancer type | miRNA id | miRNA accession | P-val. | Coeff. | # samples |
| Top |
| TissGeneMut for ACR |
| TissGeneSNV for ACR |
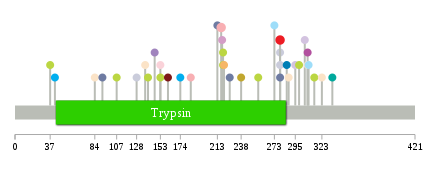
| nsSNV counts per each loci. Different colors of circles represent different cancer types. Circle size denotes number of samples. (TCGA somatic mutation (SNPs and small INDELs) data, version 2016-04-25) * Click on the image to enlarge it in a new window. |
 |
 |
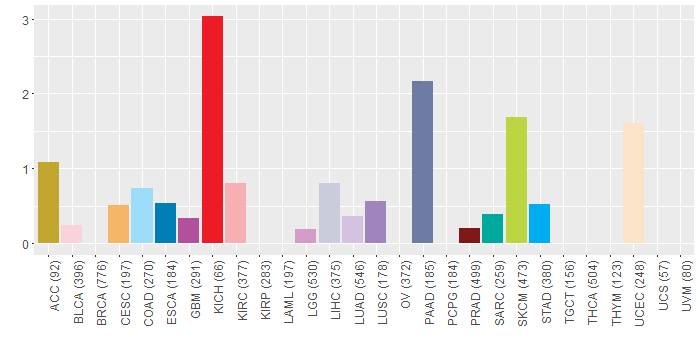
| Somatic nucleotide variants of TissGene across 28 cancer types (X-axis: cancer type and Y-axis: % of mutated samples) The numbers in parentheses are numbers of samples with mutation (nsSNVs). (TCGA somatic mutation (SNPs and small INDELs) data, version 2016-04-25) |
 |
| - nsSNVs sorted by frequency. |
| AAchange | Cancer type | # samples |
| p.W279C | KICH | 2 |
| p.G217E | KIRC | 2 |
| p.V219D | SKCM | 1 |
| p.W279R | LIHC | 1 |
| p.L84F | UCEC | 1 |
| p.P305L | LUAD | 1 |
| p.R295L | LUAD | 1 |
| p.R308Q | GBM | 1 |
| p.S153L | BLCA | 1 |
| p.E147K | LUSC | 1 |
| p.W279C | LIHC | 1 |
| p.G238E | ACC | 1 |
| p.K93E | READ | 1 |
| p.A226V | PAAD | 1 |
| p.G92D | PAAD | 1 |
| p.R42C | STAD | 1 |
| p.G161D | PRAD | 1 |
| p.W279C | PAAD | 1 |
| p.I185T | KIRC | 1 |
| p.G273R | COAD | 1 |
| p.A286T | HNSC | 1 |
| p.V219I | SKCM | 1 |
| p.A286T | ESCA | 1 |
| p.P37L | SKCM | 1 |
| p.I128T | LIHC | 1 |
| p.P309L | COAD | 1 |
| p.A137V | UCEC | 1 |
| p.R308Q | UCEC | 1 |
| p.P315L | SKCM | 1 |
| p.V256I | SKCM | 1 |
| p.G140E | SKCM | 1 |
| p.K288N | UCEC | 1 |
| p.S153L | SKCM | 1 |
| p.Q213P | PAAD | 1 |
| p.Q220* | CESC | 1 |
| p.P334S | SARC | 1 |
| p.S174F | STAD | 1 |
| p.S299L | SKCM | 1 |
| p.H323R | UCEC | 1 |
| p.R218C | LGG | 1 |
| p.W279C | HNSC | 1 |
| p.E107K | SKCM | 1 |
| Top |
| TissGeneCNV for ACR |
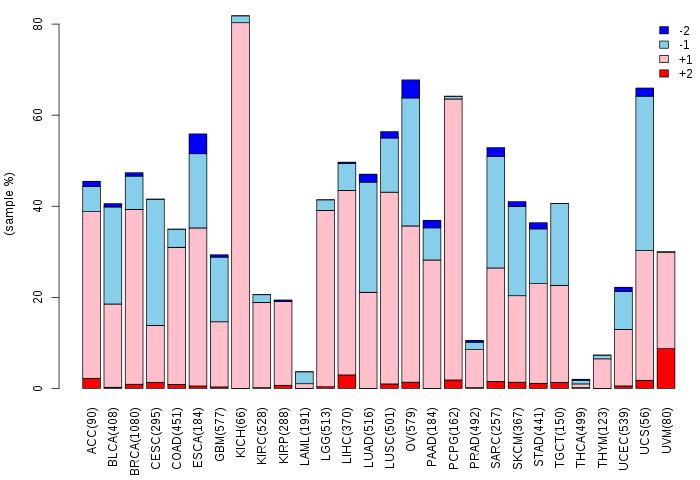
| Copy number variations of TissGene across 28 cancer types (X-axis: cancer type and Y-axis: % of CNV samples) (TCGA Gistic2_CopyNumber_Gistic2_all_data_by_genes, Gistic2 copy number data, version 2016-08-16) |
 |
| Top |
| TissGeneFusions for ACR |
| Fusion genes including TissGene (ChimerDB 3.0, 2016-12-01 and TCGA fusion Portal 2015-12-01) |
| Database | Src | Cancer type | Sample | Fusion gene | ORF | 5'-gene BP | 3'-gene BP |
| Top |
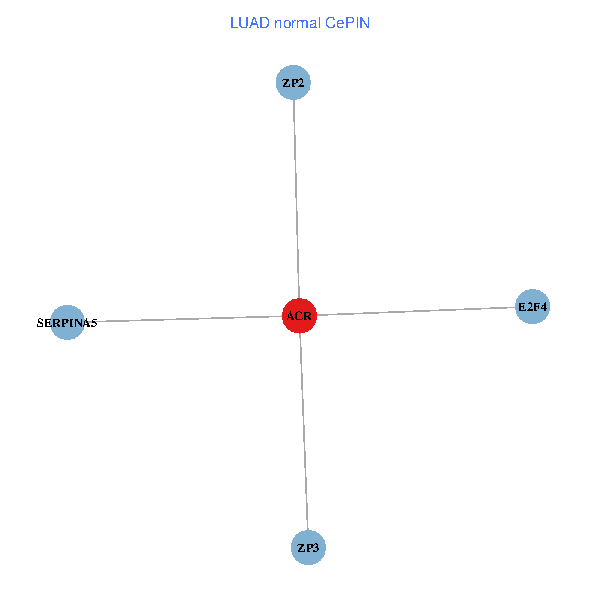
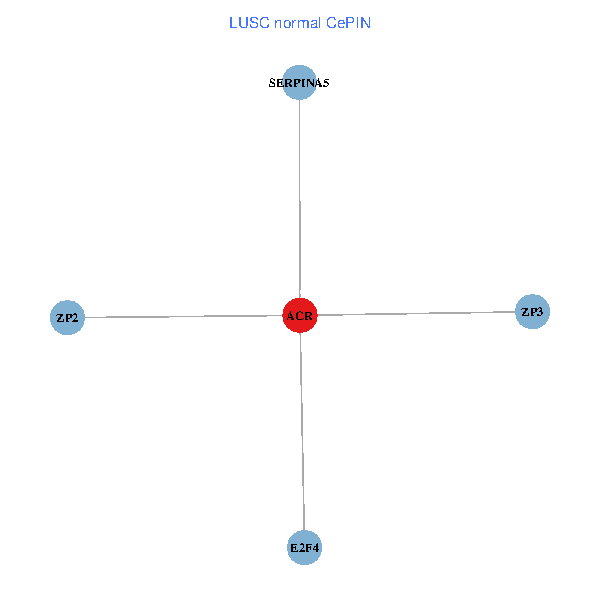
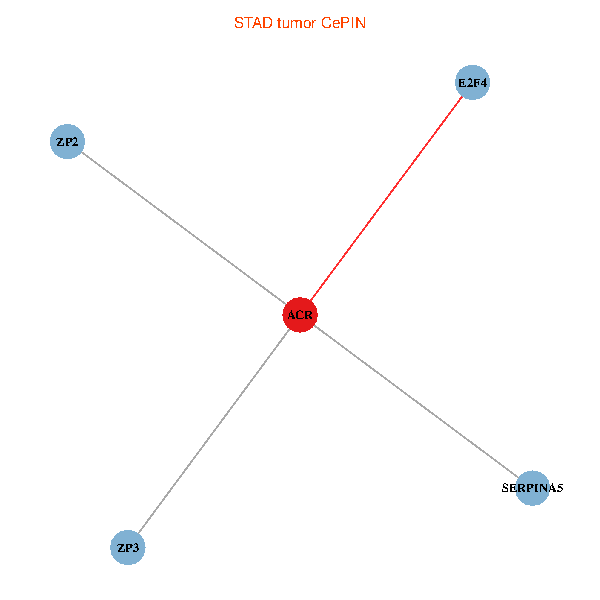
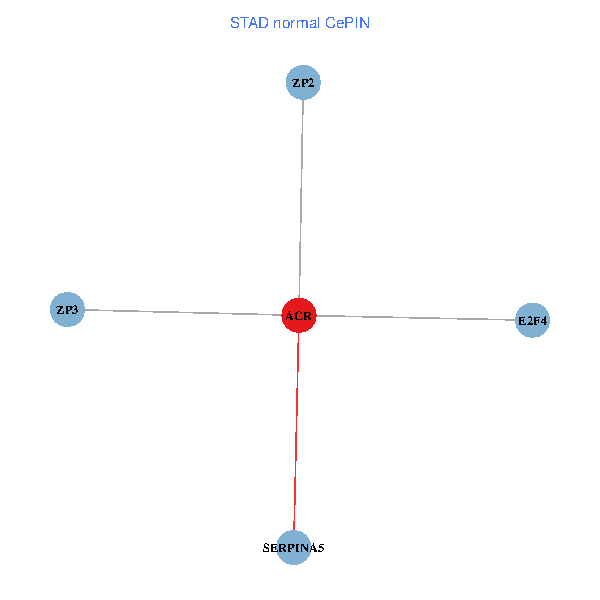
| TissGeneNet for ACR |
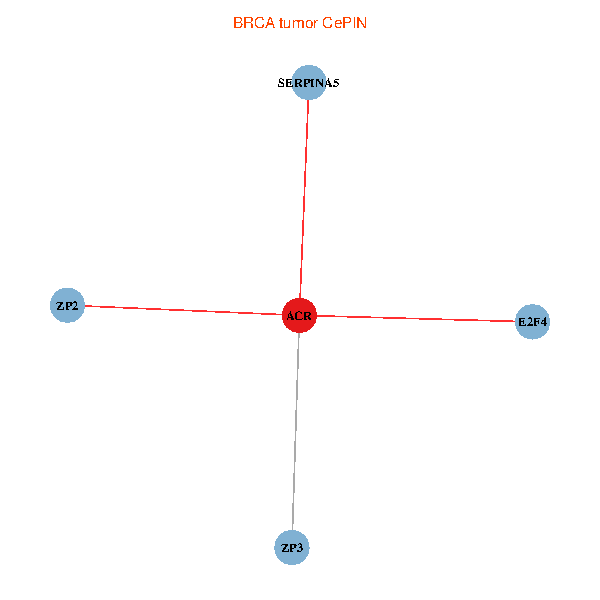
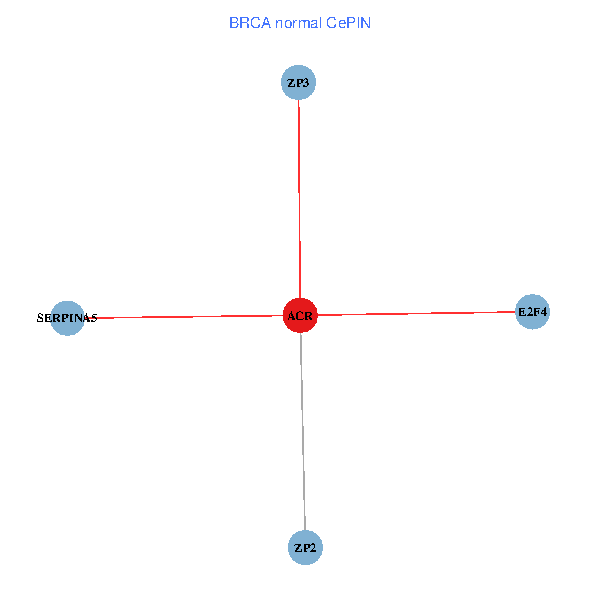
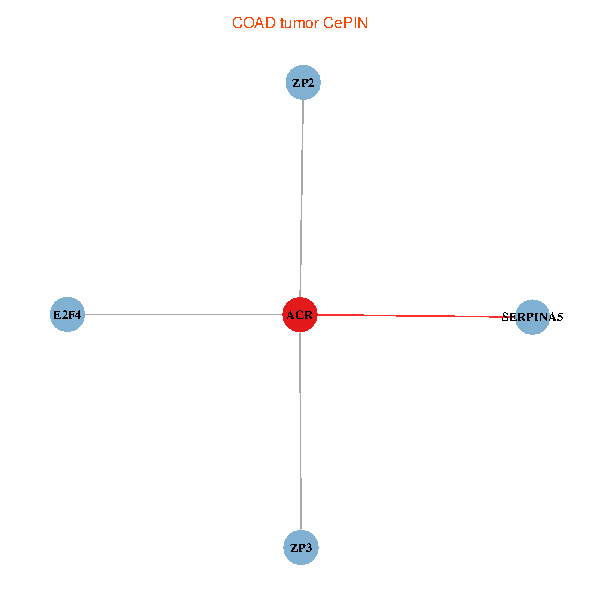
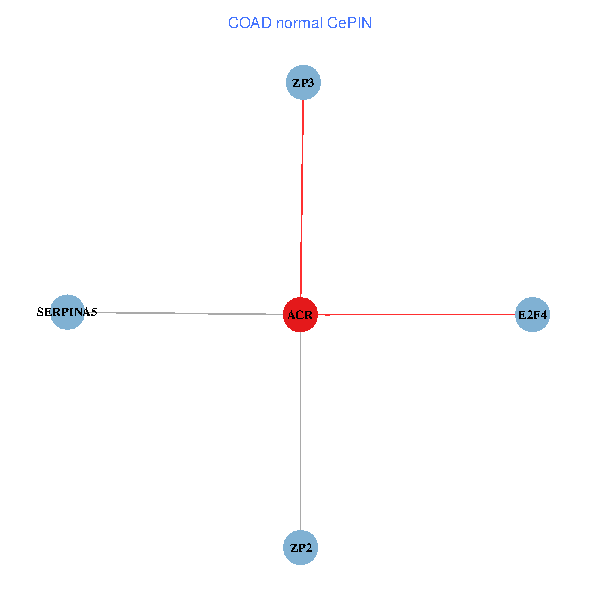
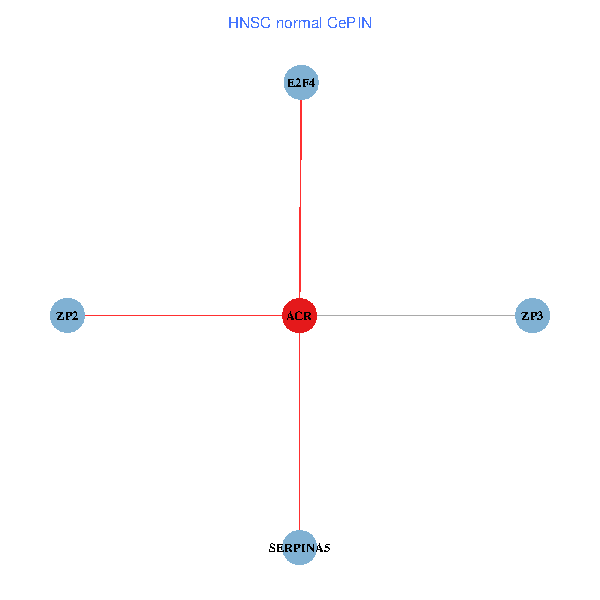
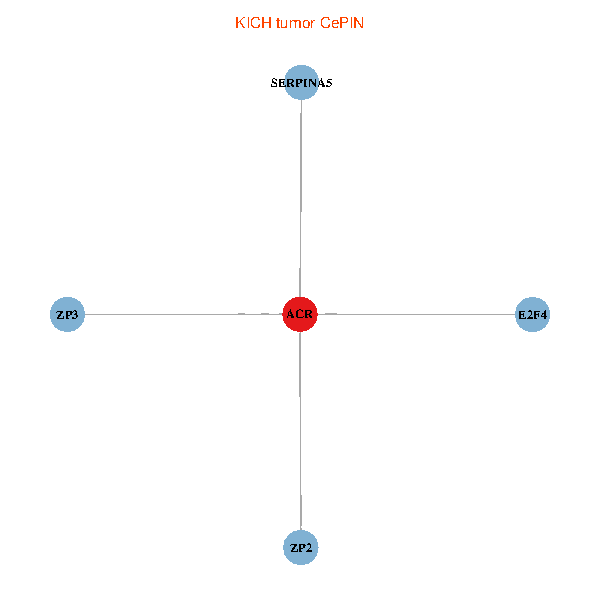
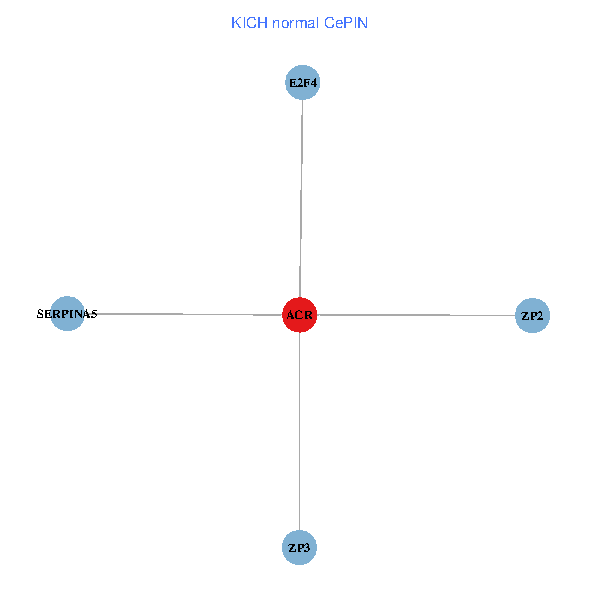
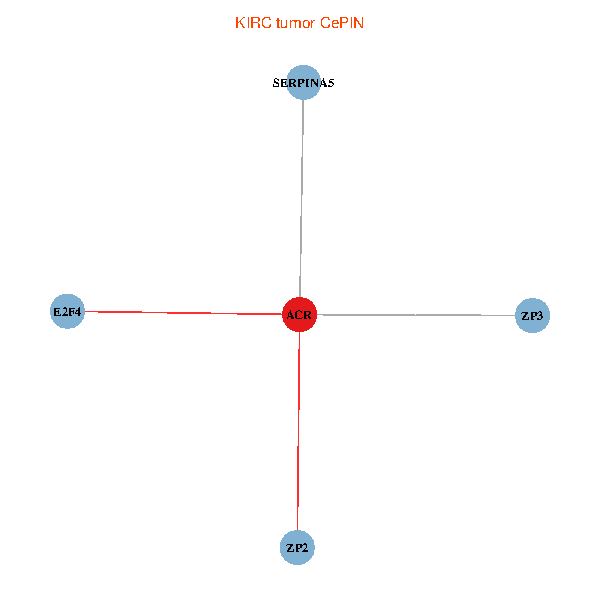
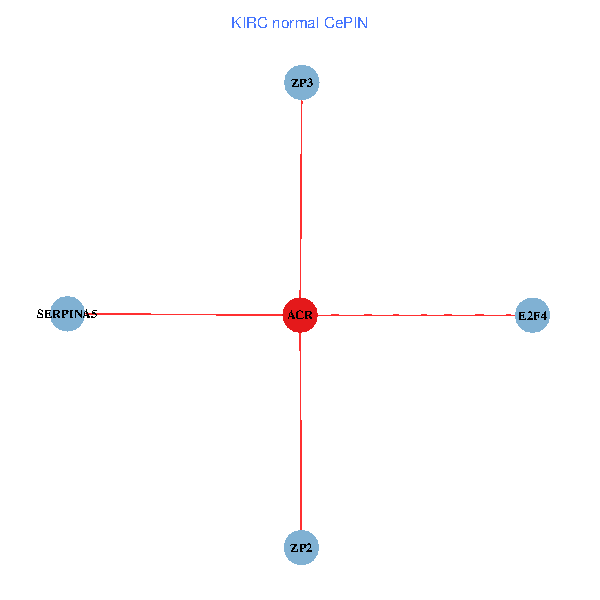
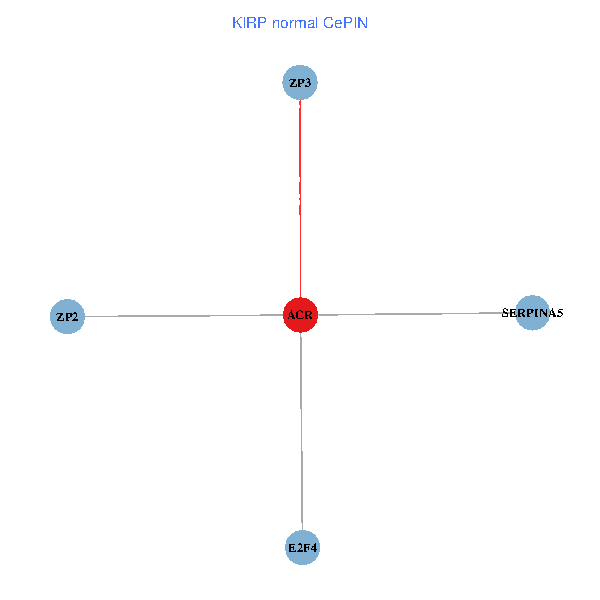
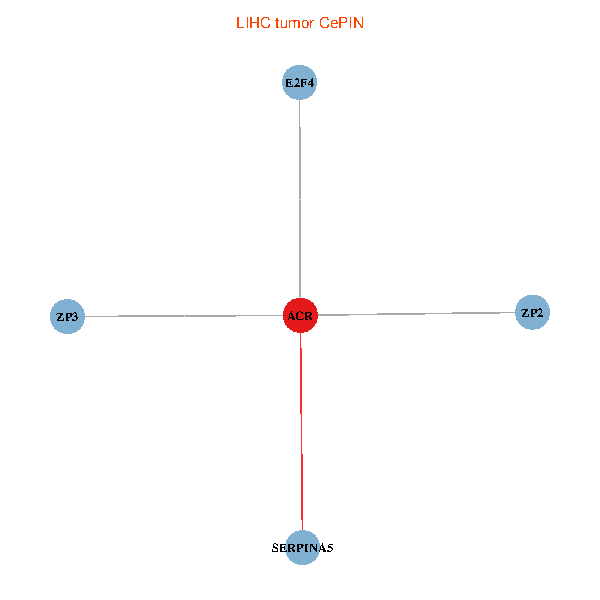
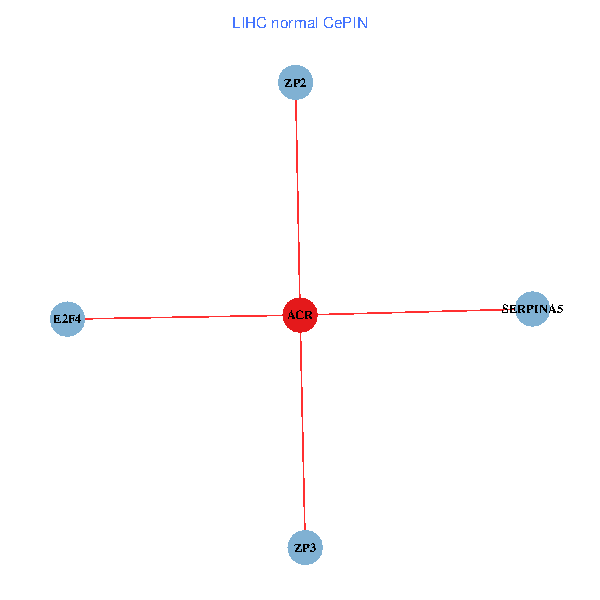
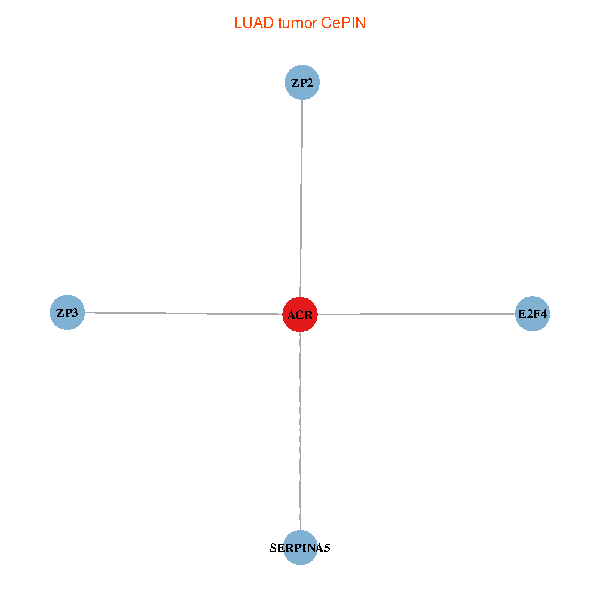
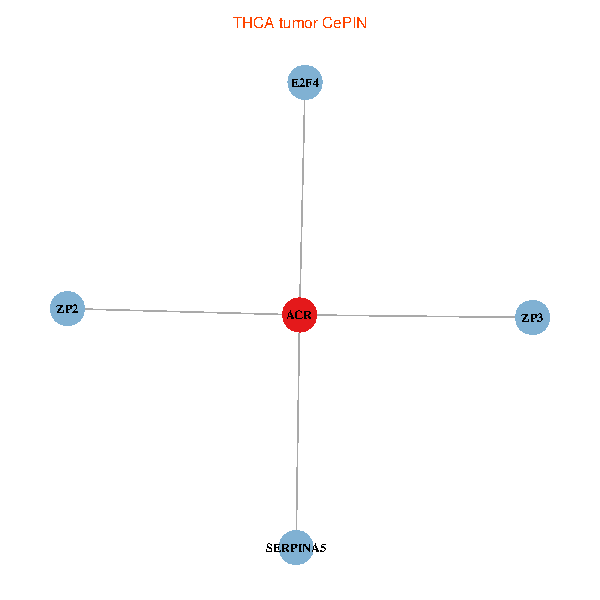
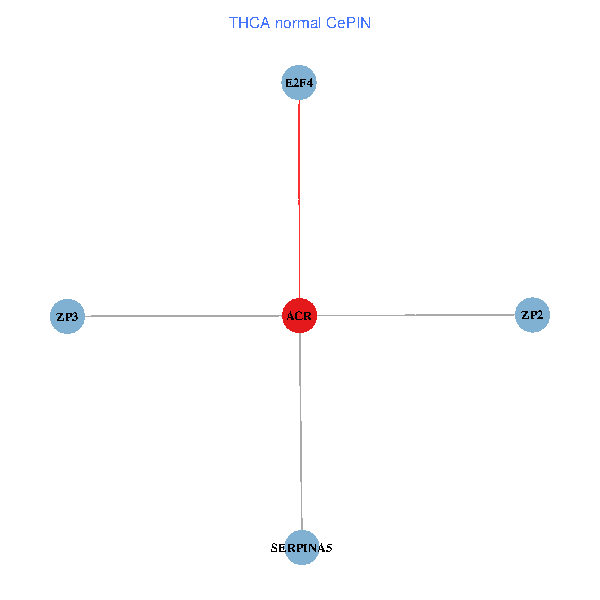
| Co-expressed gene networks based on protein-protein interaction data (CePIN) (TCGA IlluminaHiSeq_RNASeqV2, pan-cancer normalized log2(norm_counts+1) data, version 2016-08-16) (PINA2 ppi data) |
| BRCA (tumor) | BRCA (normal) |
| ACR, ZP3, E2F4, SERPINA5, ZP2 (tumor) | ACR, ZP3, E2F4, SERPINA5, ZP2 (normal) |
 |  |
| COAD (tumor) | COAD (normal) |
| ACR, ZP3, E2F4, SERPINA5, ZP2 (tumor) | ACR, ZP3, E2F4, SERPINA5, ZP2 (normal) |
 |  |
| HNSC (tumor) | HNSC (normal) |
| ACR, ZP3, E2F4, SERPINA5, ZP2 (tumor) | ACR, ZP3, E2F4, SERPINA5, ZP2 (normal) |
 |  |
| KICH (tumor) | KICH (normal) |
| ACR, ZP3, E2F4, SERPINA5, ZP2 (tumor) | ACR, ZP3, E2F4, SERPINA5, ZP2 (normal) |
 |  |
| KIRC (tumor) | KIRC (normal) |
| ACR, ZP3, E2F4, SERPINA5, ZP2 (tumor) | ACR, ZP3, E2F4, SERPINA5, ZP2 (normal) |
 |  |
| KIRP (tumor) | KIRP (normal) |
| ACR, ZP3, E2F4, SERPINA5, ZP2 (tumor) | ACR, ZP3, E2F4, SERPINA5, ZP2 (normal) |
 |  |
| LIHC (tumor) | LIHC (normal) |
| ACR, ZP3, E2F4, SERPINA5, ZP2 (tumor) | ACR, ZP3, E2F4, SERPINA5, ZP2 (normal) |
 |  |
| LUAD (tumor) | LUAD (normal) |
| ACR, ZP3, E2F4, SERPINA5, ZP2 (tumor) | ACR, ZP3, E2F4, SERPINA5, ZP2 (normal) |
 |  |
| LUSC (tumor) | LUSC (normal) |
| ACR, ZP3, E2F4, SERPINA5, ZP2 (tumor) | ACR, ZP3, E2F4, SERPINA5, ZP2 (normal) |
 |  |
| PRAD (tumor) | PRAD (normal) |
| ACR, ZP3, E2F4, SERPINA5, ZP2 (tumor) | ACR, ZP3, E2F4, SERPINA5, ZP2 (normal) |
 |  |
| STAD (tumor) | STAD (normal) |
| ACR, ZP3, E2F4, SERPINA5, ZP2 (tumor) | ACR, ZP3, E2F4, SERPINA5, ZP2 (normal) |
 |  |
| THCA (tumor) | THCA (normal) |
| ACR, ZP3, E2F4, SERPINA5, ZP2 (tumor) | ACR, ZP3, E2F4, SERPINA5, ZP2 (normal) |
 |  |
| Top |
| TissGeneProg for ACR |
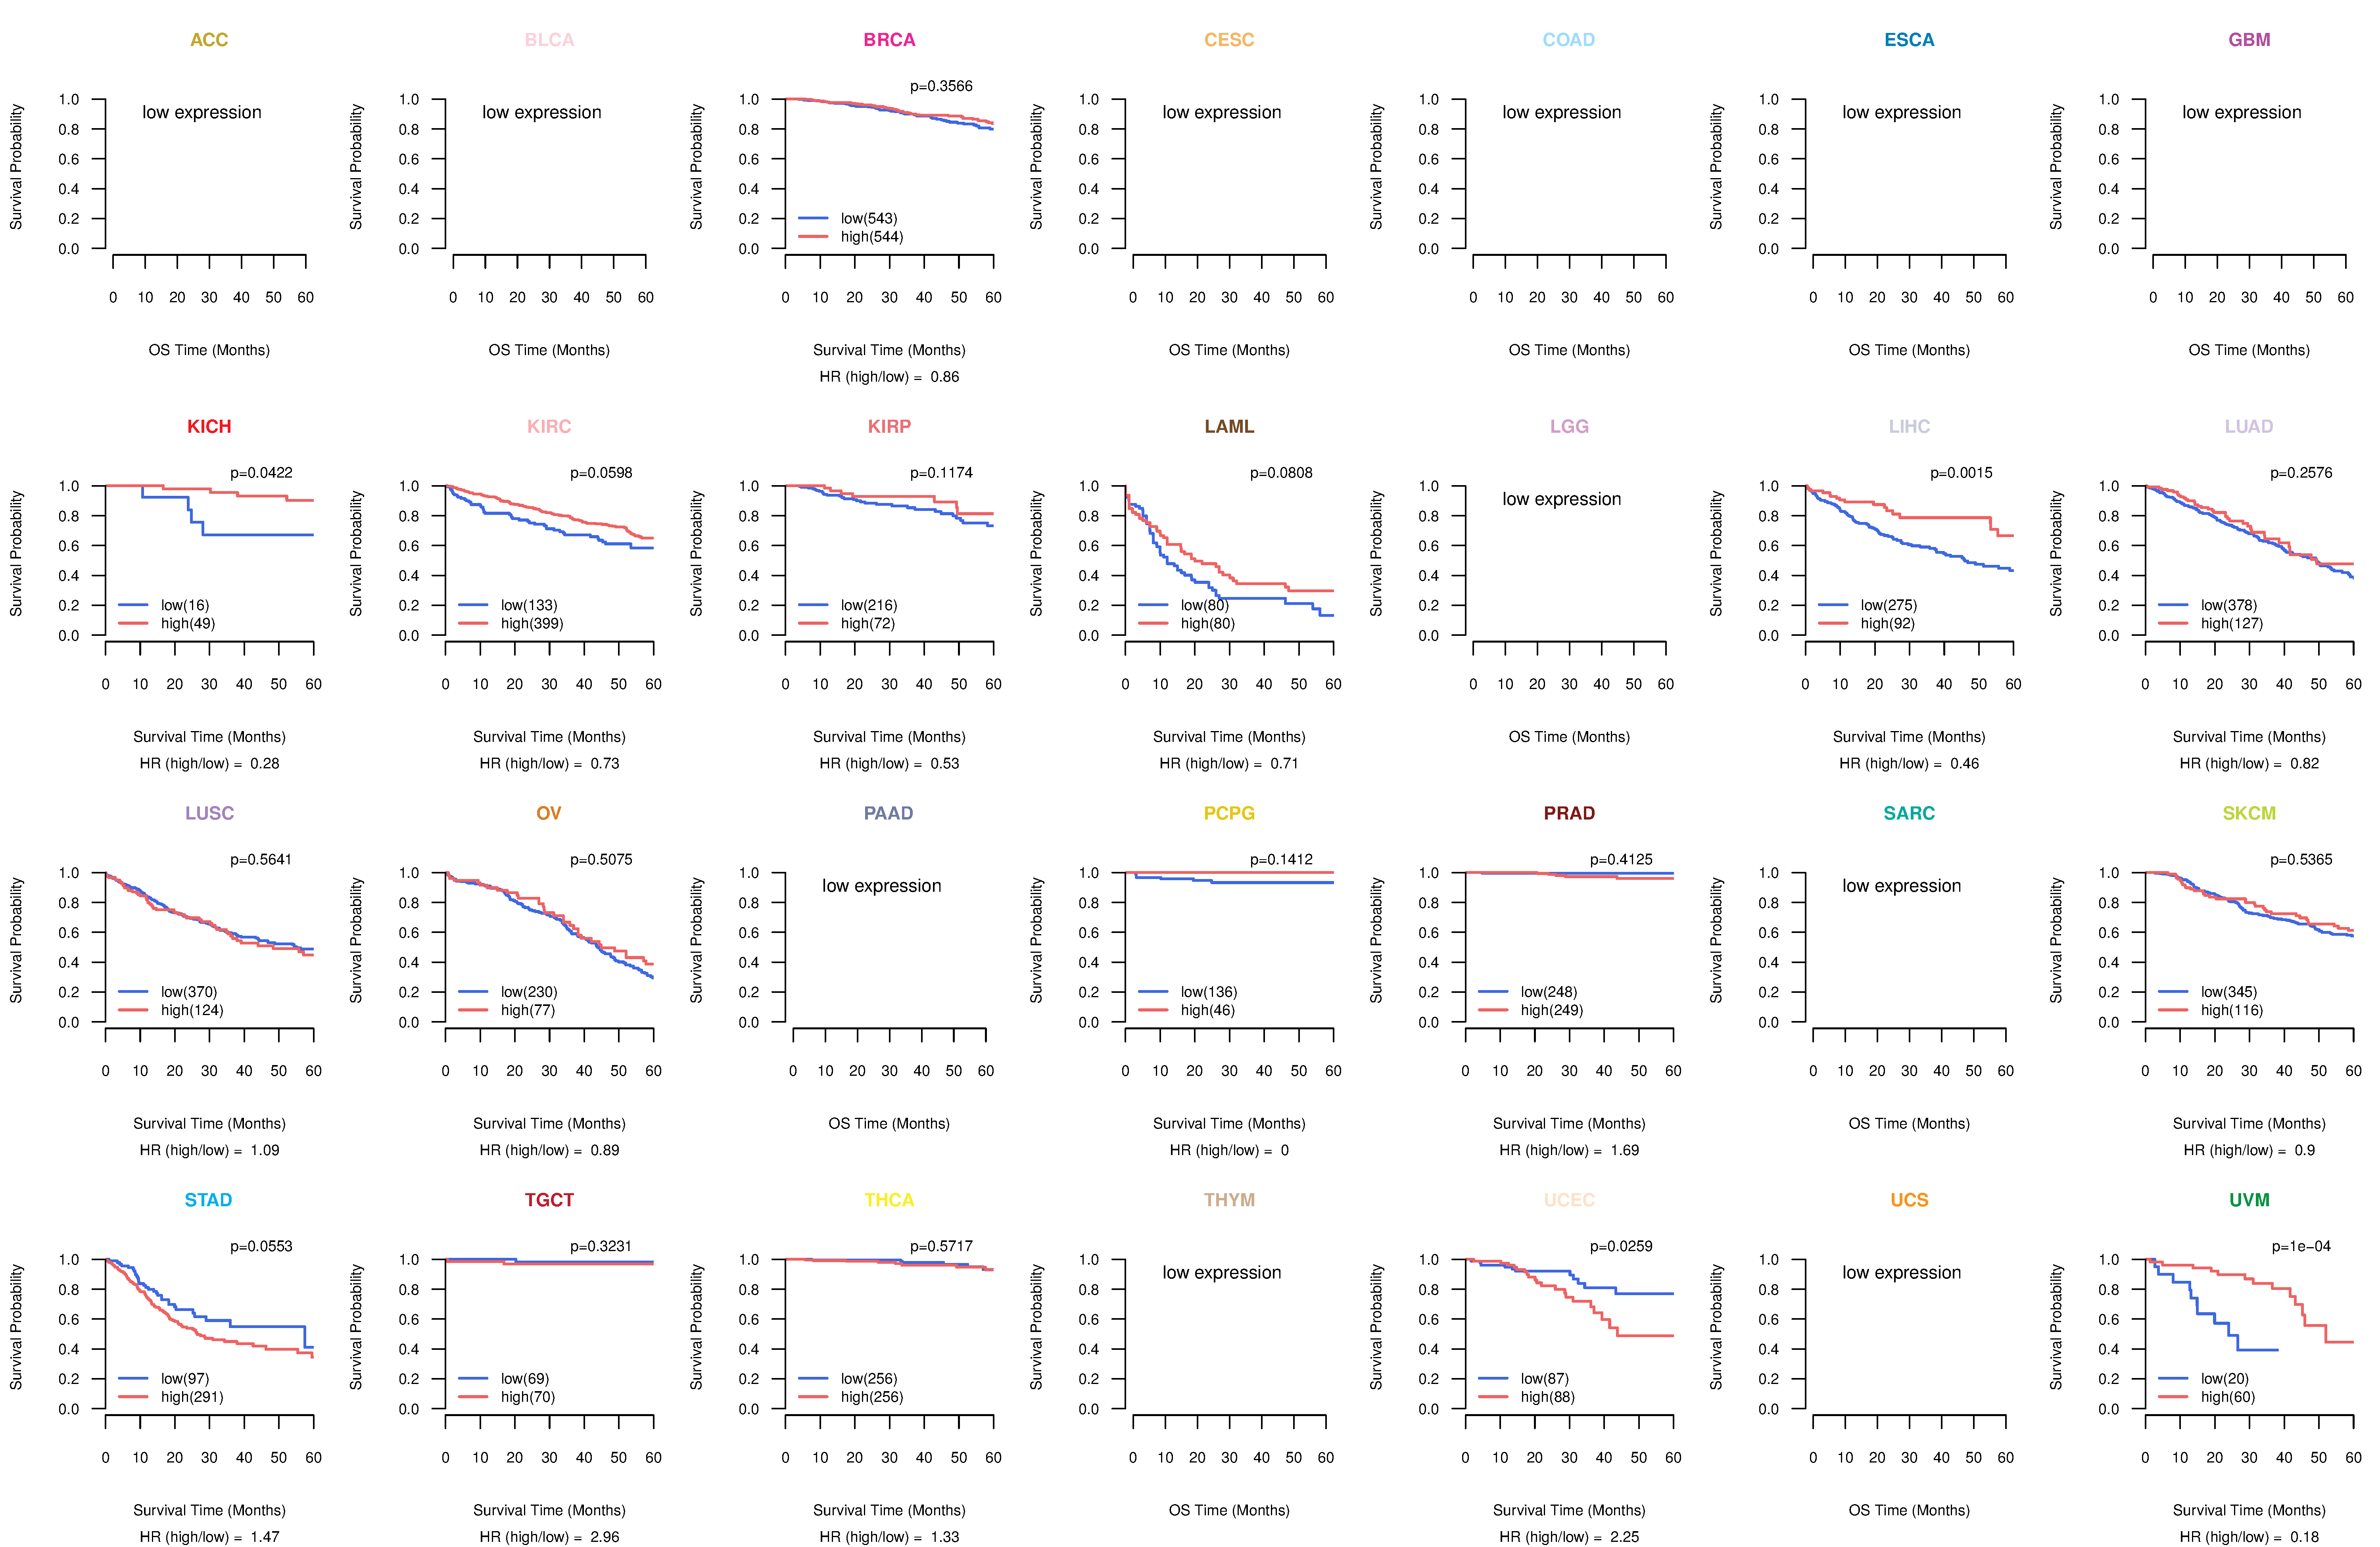
| Kaplan-Meier plots with logrank tests of overall survival (OS) using 28 cancer types (TCGA IlluminaHiSeq_RNASeqV2, pan-cancer normalized log2(norm_counts+1) data, version 2016-08-16) (TCGA clinicalMatrix, phenotype data, version 2016-04-27) * Click on the image to enlarge it in a new window. |
 |
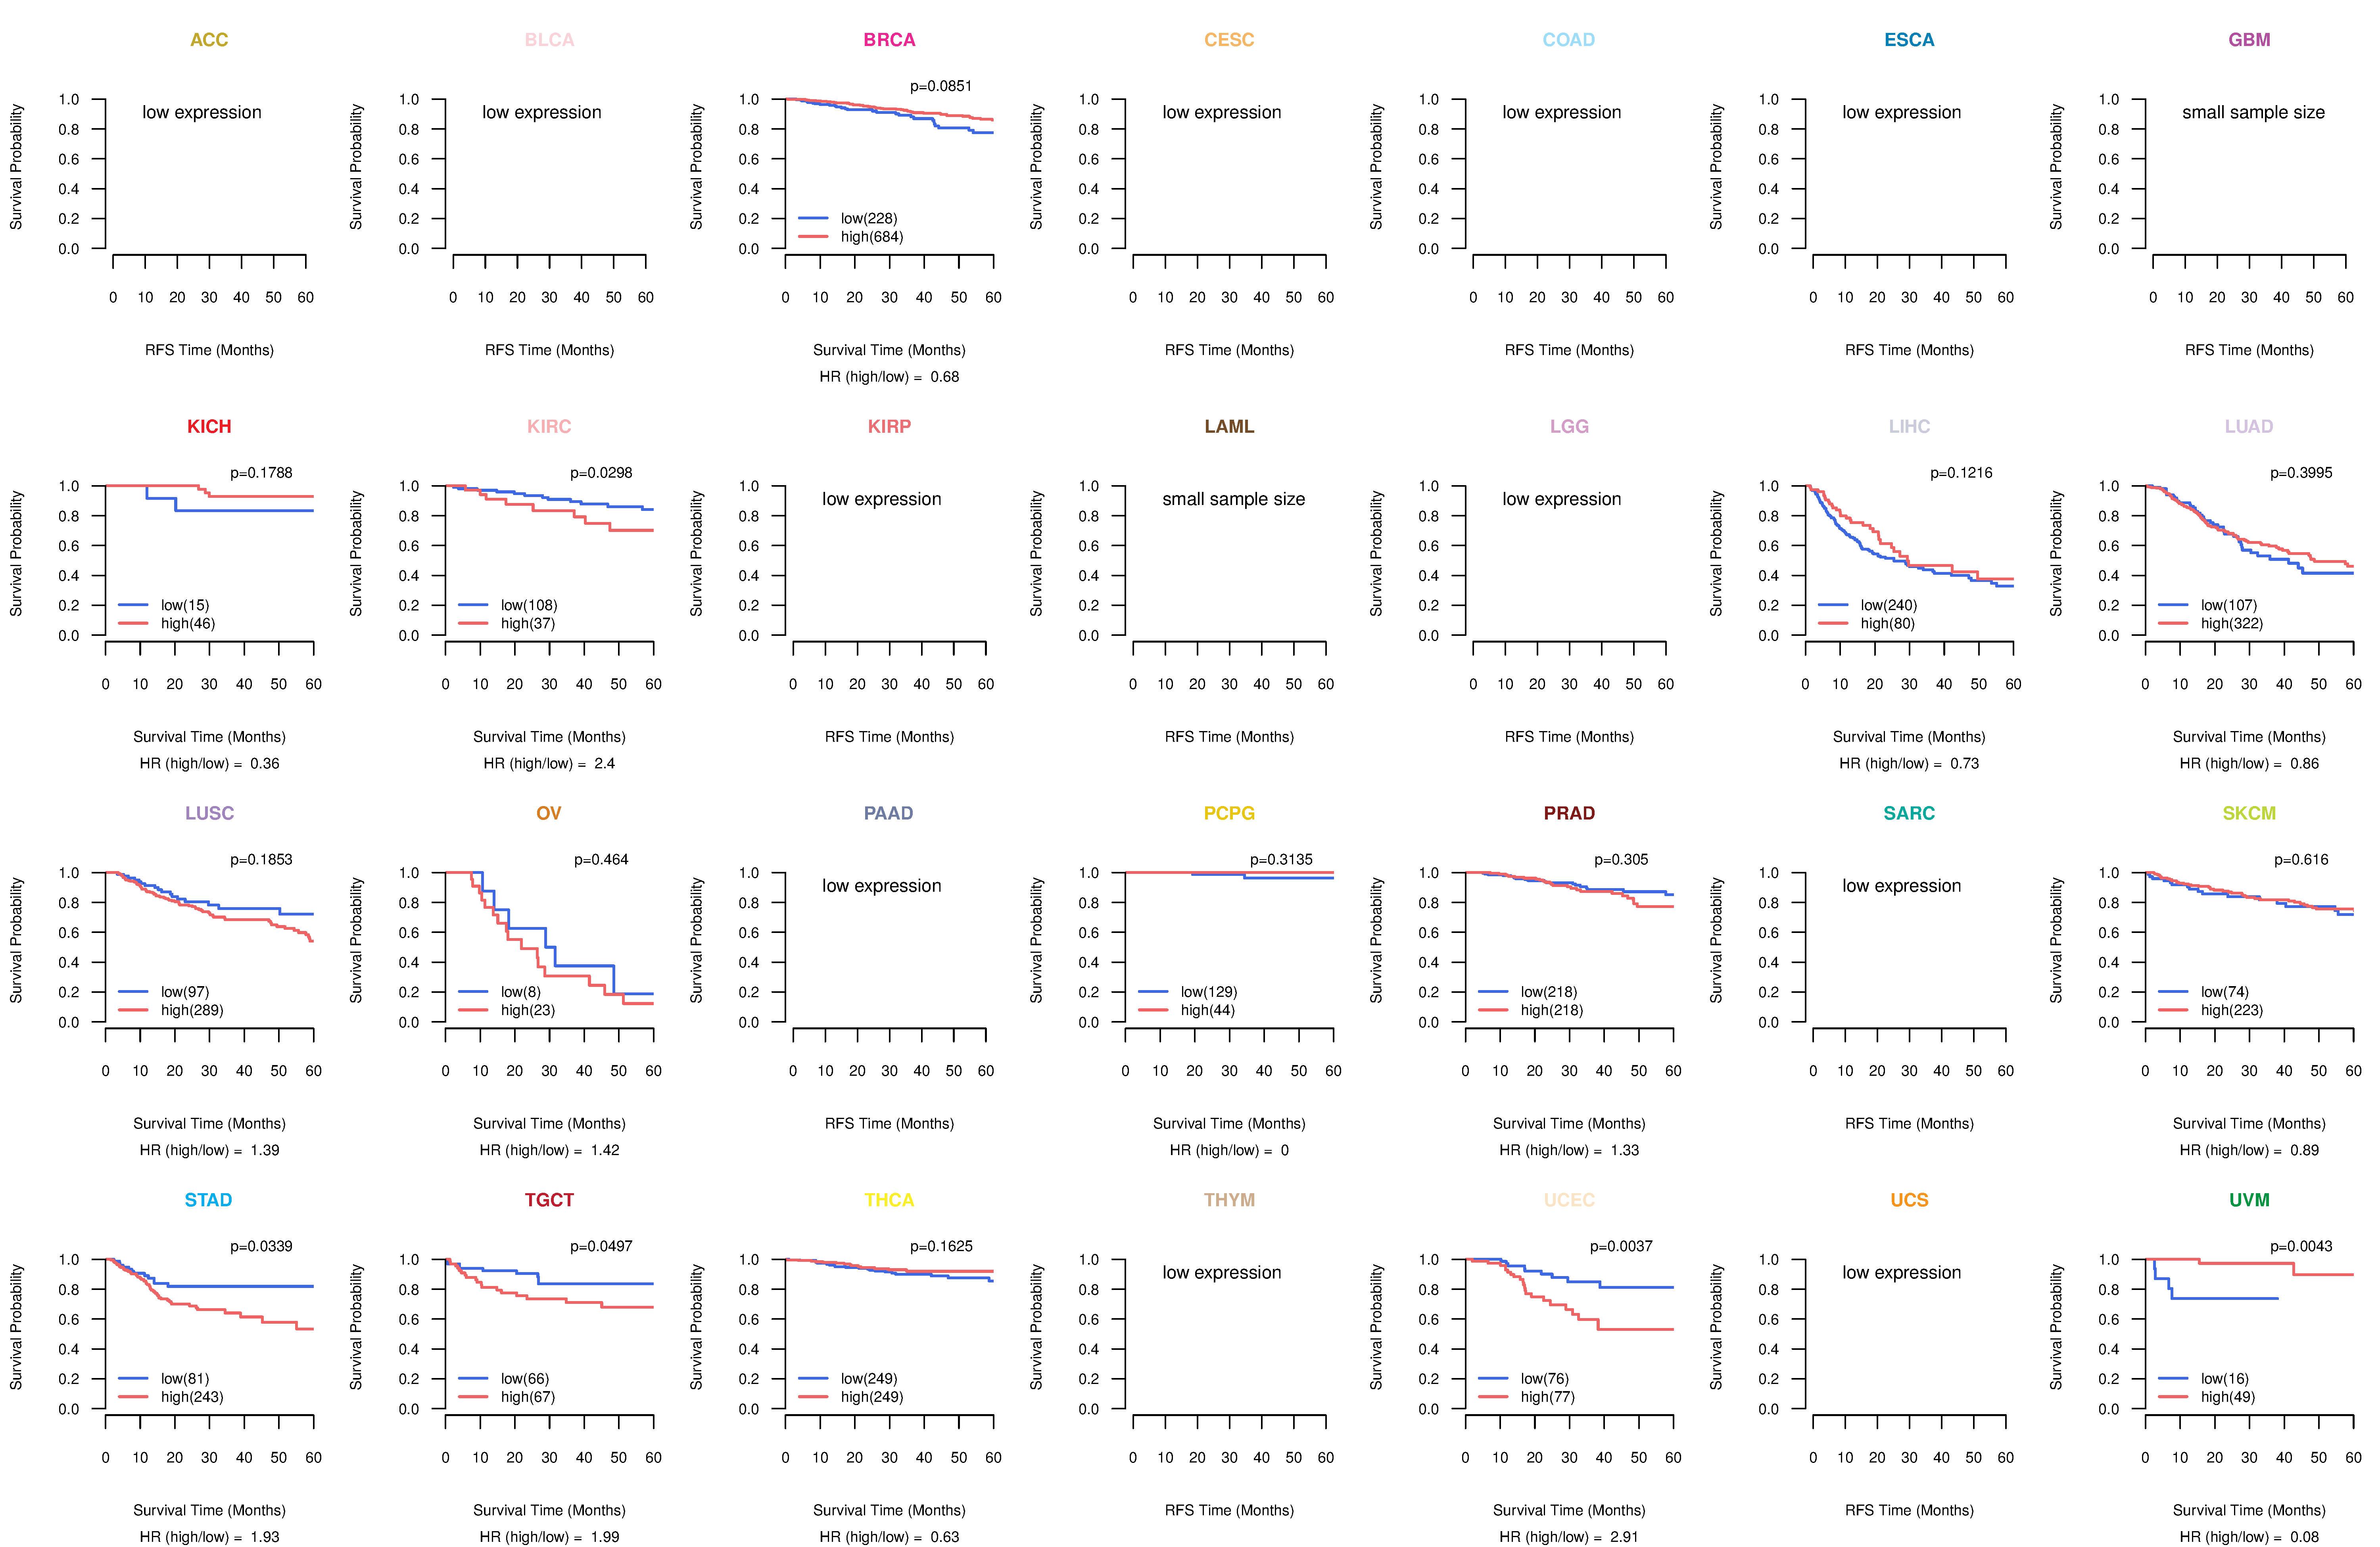
| Kaplan-Meier plots with logrank test of relapse free survival (RFS) using 28 cancer types (TCGA IlluminaHiSeq_RNASeqV2, pan-cancer normalized log2(norm_counts+1) data, version 2016-08-16) (TCGA clinicalMatrix, phenotype data, version 2016-04-27) * Click on the image enlarge it in a new window. |
 |
| Forest plot of Cox proportional hazard ratio (HR) and 95% CI of overall survival (OS) using 28 cancer types (TCGA IlluminaHiSeq_RNASeqV2, pan-cancer normalized log2(norm_counts+1) data, version 2016-08-16) (TCGA clinicalMatrix, phenotype data, version 2016-04-27) * Click on the image enlarge it in a new window. |
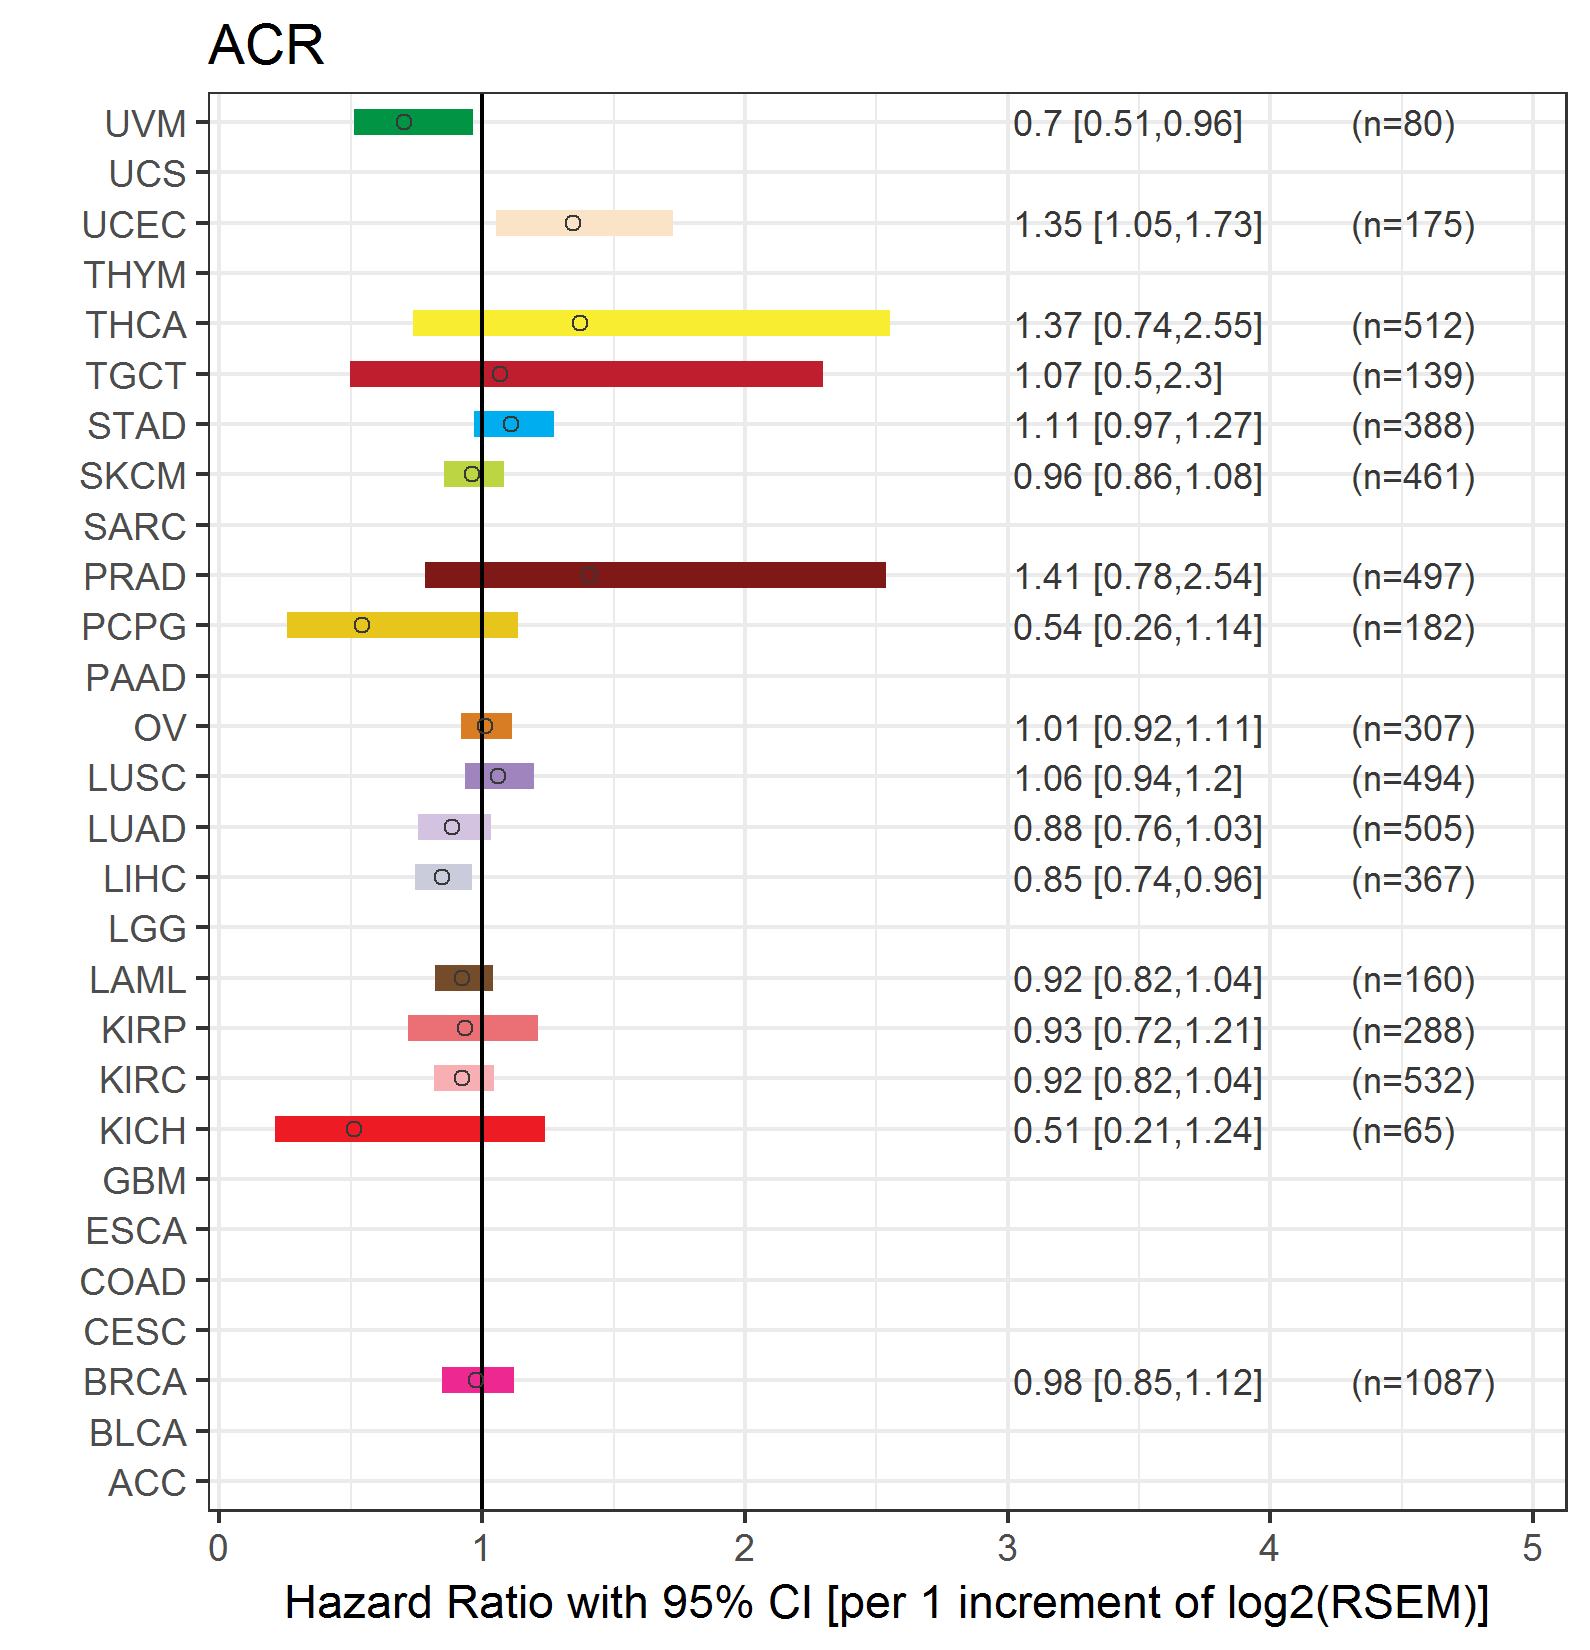 |
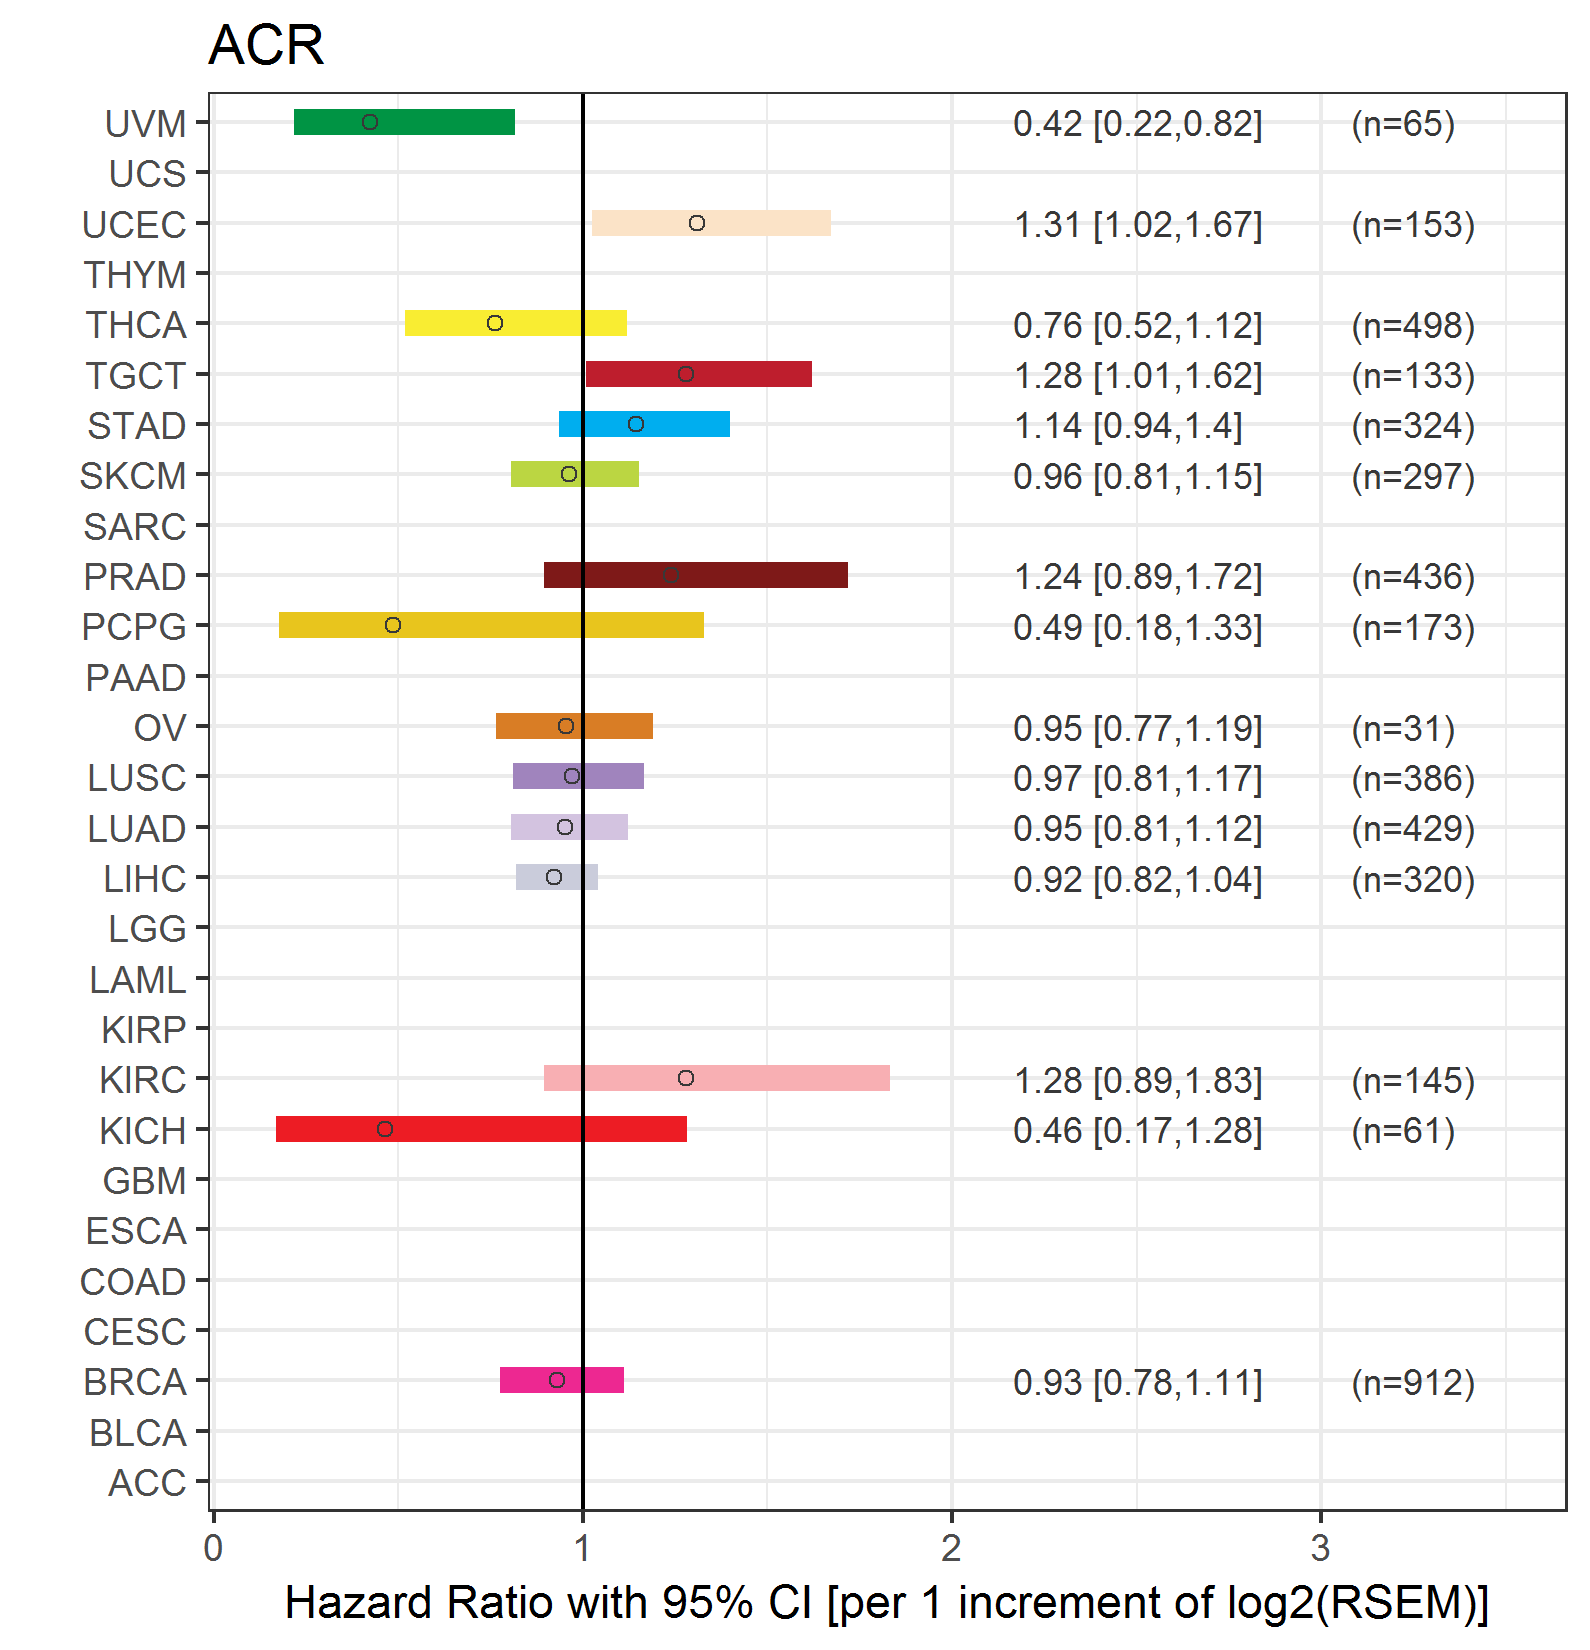
| Forest plot of Cox proportional hazard ratio (HR) and 95% CI of relapse free survival (RFS) using 28 cancer types (TCGA IlluminaHiSeq_RNASeqV2, pan-cancer normalized log2(norm_counts+1) data, version 2016-08-16) (TCGA clinicalMatrix, phenotype data, version 2016-04-27) * Click on the image enlarge it in a new window. |
 |
| Top |
| TissGeneClin for ACR |
| TissGeneDrug for ACR |
| Drug information targeting TissGene (DrugBank Version 5.0.6, 2017-04-01) |
| DrugBank ID | Drug name | Drug activity | Drug type | Drug status |
| Top |
| TissGeneDisease for ACR |
| Disease information associated with TissGene (DisGeNet, 2016-06-01) |
| Disease ID | Disease name | # pubmeds | Source |
| umls:C0003873 | Rheumatoid Arthritis | 21 | BeFree |
| umls:C0024141 | Lupus Erythematosus, Systemic | 12 | BeFree |
| umls:C0024131 | Lupus Vulgaris | 2 | BeFree |
| umls:C0024138 | Lupus Erythematosus, Discoid | 2 | BeFree |
| umls:C0036421 | Systemic Scleroderma | 2 | BeFree |
| umls:C0409974 | Lupus Erythematosus | 2 | BeFree |
| umls:C0002871 | Anemia | 1 | BeFree |
| umls:C0002878 | Anemia, Hemolytic | 1 | BeFree |
| umls:C0016053 | Fibromyalgia | 1 | BeFree |
| umls:C0018939 | Hematological Disease | 1 | BeFree |
| umls:C0023418 | leukemia | 1 | BeFree |
| umls:C0023467 | Leukemia, Myelocytic, Acute | 1 | BeFree |
| umls:C0023473 | Myeloid Leukemia, Chronic | 1 | BeFree |
| umls:C0024299 | Lymphoma | 1 | BeFree |
| umls:C0035435 | Rheumatism | 1 | BeFree |
| umls:C0596263 | Carcinogenesis | 1 | BeFree |
| umls:C0730345 | Microalbuminuria | 1 | BeFree |
|
Copyright 2016-Present - The University of Texas Health Science Center at Houston (UTHealth) Web File Viewing | How to Report, Fraud, Waste and Abuse | State of Texas | Statewide Search | Texas Homeland Security | Site Policies |