 |
| |
| |
| |
| |
| |
| |
|

| TissGeneSummary for GPR143 |
 Gene summary Gene summary |
| Basic gene information | Gene symbol | GPR143 |
| Gene name | G protein-coupled receptor 143 | |
| Synonyms | NYS6|OA1 | |
| Cytomap | UCSC genome browser: Xp22.3 | |
| Type of gene | protein-coding | |
| RefGenes | NM_000273.2, | |
| Description | G-protein coupled receptor 143ocular albinism 1ocular albinism type 1 protein | |
| Modification date | 20141219 | |
| dbXrefs | MIM : 300808 | |
| HGNC : HGNC | ||
| Ensembl : ENSG00000101850 | ||
| HPRD : 02355 | ||
| Vega : OTTHUMG00000021118 | ||
| Protein | UniProt: go to UniProt's Cross Reference DB Table | |
| Expression | CleanEX: HS_GPR143 | |
| BioGPS: 4935 | ||
| Pathway | NCI Pathway Interaction Database: GPR143 | |
| KEGG: GPR143 | ||
| REACTOME: GPR143 | ||
| Pathway Commons: GPR143 | ||
| Context | iHOP: GPR143 | |
| ligand binding site mutation search in PubMed: GPR143 | ||
| UCL Cancer Institute: GPR143 | ||
| Assigned class in TissGDB* | C | |
| Included tissue-specific gene expression resources | TiGER,GTEx | |
| Specific-tissues in normal samples (assigned by TissGDB using HPA, TiGER, and GTEx) | KidneySkin | |
| Cancer types related to the specific-tissues in cancer samples (assigned by TissGDB using TCGA) | KIRC,KIRP,KICHSKCM | |
| Reference showing the relevant tissue of GPR143 | ||
| Description by TissGene annotations | ||
| * Class A consists of genes with literature evidence and is part of the cTissGenes. Class B consists of only cTissGenes without additional evidence. The remaining genes belong to Class C. |
| Gene ontology having evidence of Inferred from Direct Assay (IDA) from Entrez |
| GO ID | GO term | PubMed ID | GO:0007186 | G-protein coupled receptor signaling pathway | 16524428 | GO:0007218 | neuropeptide signaling pathway | 18828673 | GO:0032400 | melanosome localization | 19717472 | GO:0032402 | melanosome transport | 19717472 | GO:0035584 | calcium-mediated signaling using intracellular calcium source | 18828673 | GO:0048015 | phosphatidylinositol-mediated signaling | 16524428 | GO:0050848 | regulation of calcium-mediated signaling | 18828673 | GO:0007186 | G-protein coupled receptor signaling pathway | 16524428 | GO:0007218 | neuropeptide signaling pathway | 18828673 | GO:0032400 | melanosome localization | 19717472 | GO:0032402 | melanosome transport | 19717472 | GO:0035584 | calcium-mediated signaling using intracellular calcium source | 18828673 | GO:0048015 | phosphatidylinositol-mediated signaling | 16524428 | GO:0050848 | regulation of calcium-mediated signaling | 18828673 |
| Top |
| TissGeneExp for GPR143 |
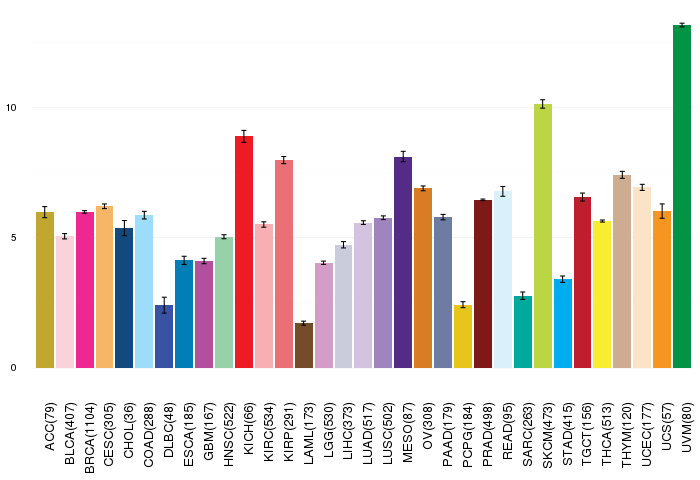
| Gene expressions across 28 cancer types (X-axis: cancer type and Y-axis: log2(norm_counts+1)) (TCGA IlluminaHiSeq_RNASeqV2, pan-cancer normalized log2(norm_counts+1) data, version 2016-08-16) |
 |
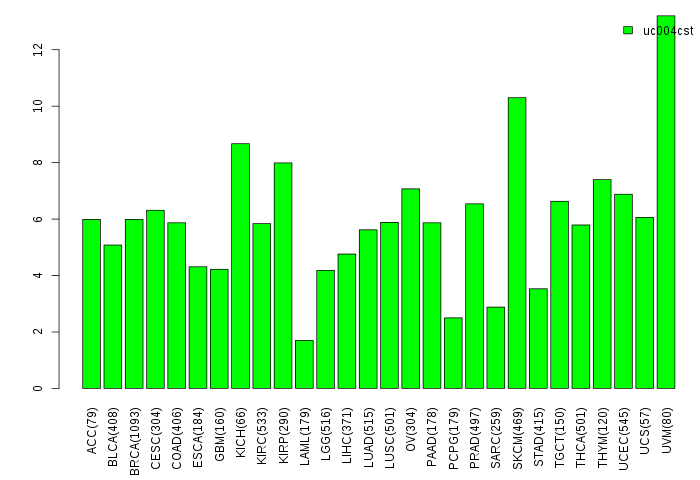
| Gene isoform expressions across 28 cancer types (X-axis: cancer type and Y-axis: log2(norm_counts+1)) (TCGA pan-cancer tcga_rsem_isoform_tpm, version 2016-09-01) |
 |
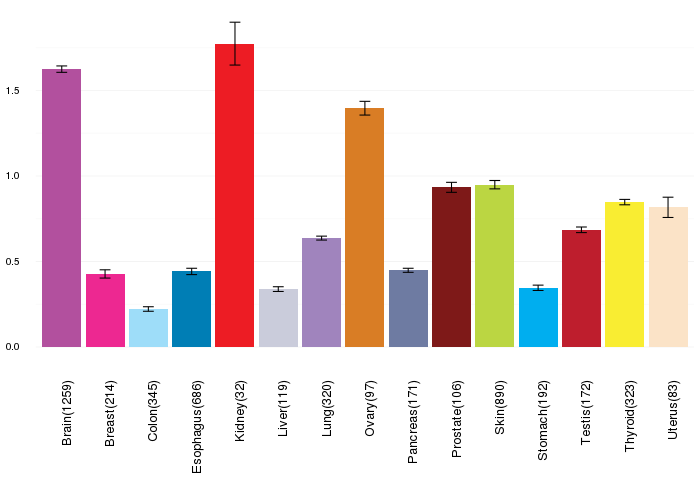
| Gene expressions across normal tissues of GTEx data (GTEx GTEx_Analysis_v6_RNA-seq_RNA-SeQCv1.1.8_gene_rpkm.gct) - Here, we shows the matched tissue types only among our 28 cancer types. |
 |
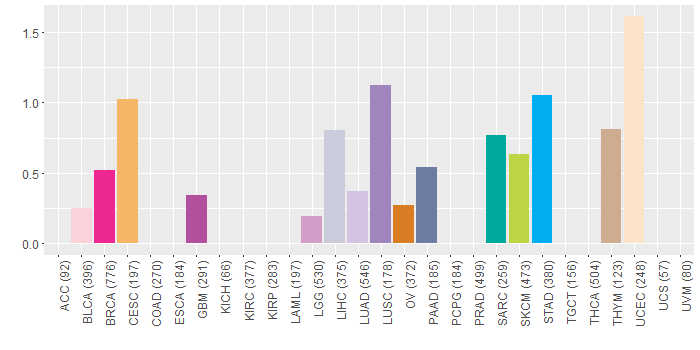
| Different expressions across 14 cancer types with more than 10 samples between matched tumors and normals (X-axis: cancer type and Y-axis: log2(norm_counts+1)) (TCGA IlluminaHiSeq_RNASeqV2, pan-cancer normalized log2(norm_counts+1) data, version 2016-08-16) |
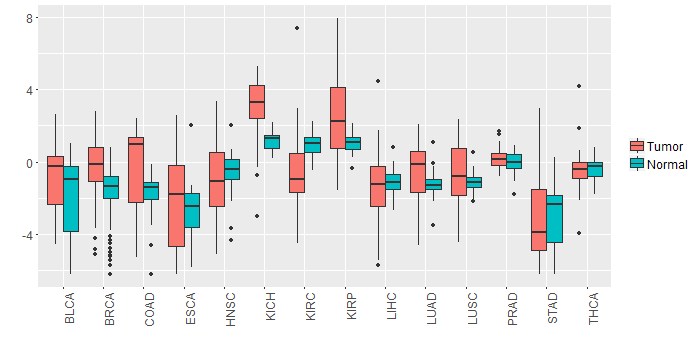 |
| - Significantly differentially expressed cancer types and information. (|Fold change|>1 and FDR<0.05) |
| Cancer type | Mean(exp) in tumor | Mean(exp) in matched normal | Log2FC | P-val. | FDR |
| BRCA | -0.269295886 | -1.767710798 | 1.498414912 | 9.18E-12 | 3.88E-11 |
| KIRC | -0.63553017 | 0.974612886 | -1.610143056 | 3.29E-09 | 1.05E-08 |
| COAD | -0.258611473 | -1.717773011 | 1.459161538 | 0.017 | 0.03481028 |
| KIRP | 2.481846219 | 1.002755594 | 1.479090625 | 0.00198 | 0.005050239 |
| KICH | 2.886454219 | 1.205738219 | 1.680716 | 0.000325 | 0.000774378 |
| Top |
| TissGene-miRNA for GPR143 |
| Significantly anti-correlated miRNAs of TissGene across 28 cancer types (Gene-miRNA relations from TargetScanHuman Relsease 7.1, Conserved_Site_Context_Scores.txt.zip, 06.01.2016) (TCGA IlluminaHiSeq_miRNASeq, log2(RPM+1) data, version 2016-11-21) (TCGA IlluminaHiSeq_RNASeqV2, log2(normalized_count+1) data, version 2016-08-16) (Spearman’s Rank Correlation (p-value<0.05 and coefficient<-0.25)) |
| Cancer type | miRNA id | miRNA accession | P-val. | Coeff. | # samples |
| Top |
| TissGeneMut for GPR143 |
| TissGeneSNV for GPR143 |
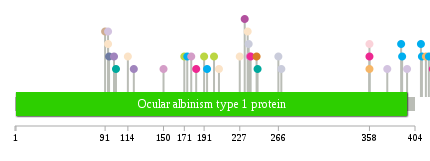
| nsSNV counts per each loci. Different colors of circles represent different cancer types. Circle size denotes number of samples. (TCGA somatic mutation (SNPs and small INDELs) data, version 2016-04-25) * Click on the image to enlarge it in a new window. |
 |
 |
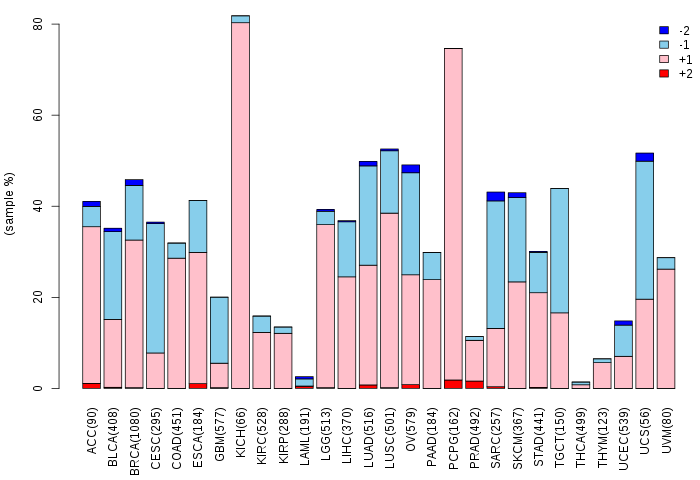
| Somatic nucleotide variants of TissGene across 28 cancer types (X-axis: cancer type and Y-axis: % of mutated samples) The numbers in parentheses are numbers of samples with mutation (nsSNVs). (TCGA somatic mutation (SNPs and small INDELs) data, version 2016-04-25) |
 |
| - nsSNVs sorted by frequency. |
| AAchange | Cancer type | # samples |
| p.G183D | BRCA | 1 |
| p.G422V | BRCA | 1 |
| p.F95L | PAAD | 1 |
| p.Q358E | BLCA | 1 |
| p.L418F | STAD | 1 |
| p.V91M | THYM | 1 |
| p.K235N | UCEC | 1 |
| p.D415H | CESC | 1 |
| p.D100Y | LUSC | 1 |
| p.R206W | UCEC | 1 |
| p.K411T | STAD | 1 |
| p.A174T | STAD | 1 |
| p.Y269X | LIHC | 1 |
| p.Y178S | LGG | 1 |
| p.R245Q | SARC | 1 |
| p.G150R | LGG | 1 |
| p.V102I | SARC | 1 |
| p.P347H | HNSC | 1 |
| p.L244F | OV | 1 |
| p.T232M | GBM | 1 |
| p.A194T | STAD | 1 |
| p.V227M | UCEC | 1 |
| p.S259L | READ | 1 |
| p.G94* | LUAD | 1 |
| p.K391T | STAD | 1 |
| p.P367H | HNSC | 1 |
| p.N410S | STAD | 1 |
| p.D396G | LUAD | 1 |
| p.Q358E | CESC | 1 |
| p.N390S | STAD | 1 |
| p.D376G | LUAD | 1 |
| p.R236G | LIHC | 1 |
| p.E171K | SKCM | 1 |
| p.G94E | UCEC | 1 |
| p.E358K | BRCA | 1 |
| p.A120P | LUSC | 1 |
| p.A191V | SKCM | 1 |
| p.R237M | LGG | 1 |
| p.G114E | UCEC | 1 |
| p.T238S | BRCA | 1 |
| p.P201L | SKCM | 1 |
| p.L266P | LIHC | 1 |
| Top |
| TissGeneCNV for GPR143 |
| Copy number variations of TissGene across 28 cancer types (X-axis: cancer type and Y-axis: % of CNV samples) (TCGA Gistic2_CopyNumber_Gistic2_all_data_by_genes, Gistic2 copy number data, version 2016-08-16) |
 |
| Top |
| TissGeneFusions for GPR143 |
| Fusion genes including TissGene (ChimerDB 3.0, 2016-12-01 and TCGA fusion Portal 2015-12-01) |
| Database | Src | Cancer type | Sample | Fusion gene | ORF | 5'-gene BP | 3'-gene BP |
| Chimerdb3.0 | ChiTaRs | NA | BI003462 | IFT27-GPR143 | chr22:37154391 | chrX:9715041 | |
| TCGAfusionPortal | PRADA | BLCA | TCGA-CU-A3KJ-01A | TBL1X-GPR143 | In-frame | ChrX:9665469 | ChrX:9693880 |
| Top |
| TissGeneNet for GPR143 |
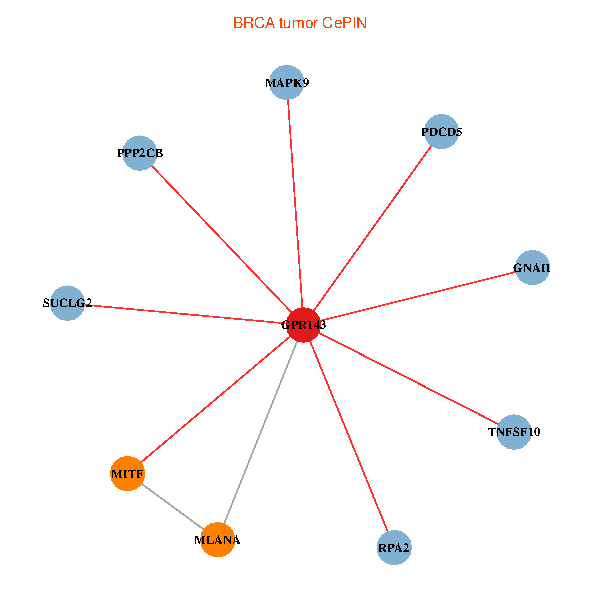
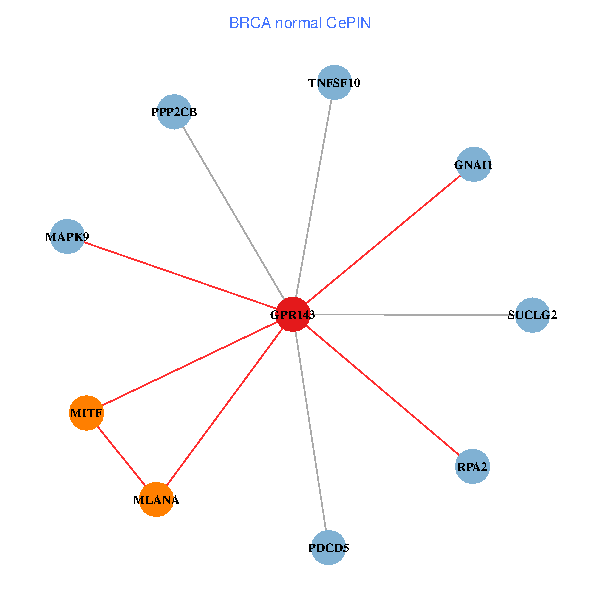
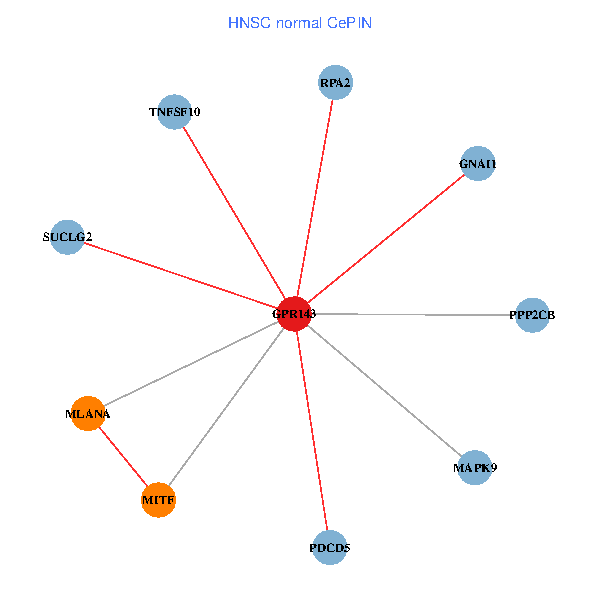
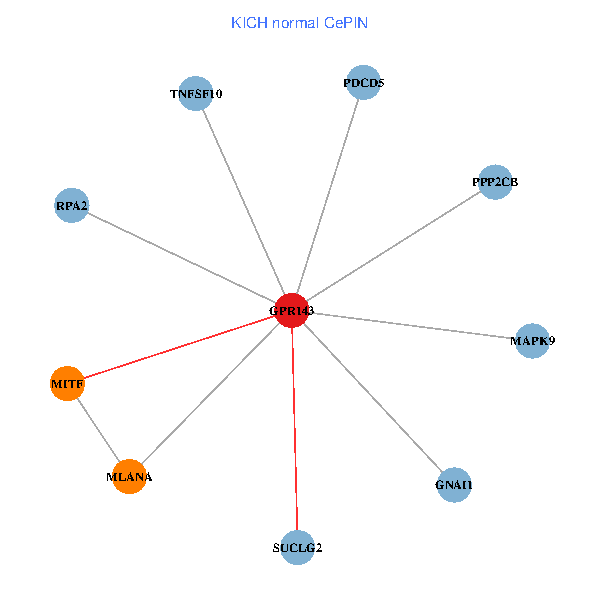
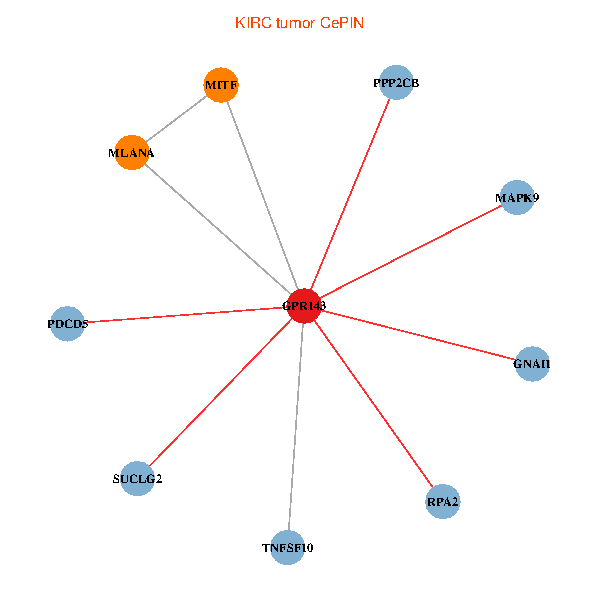
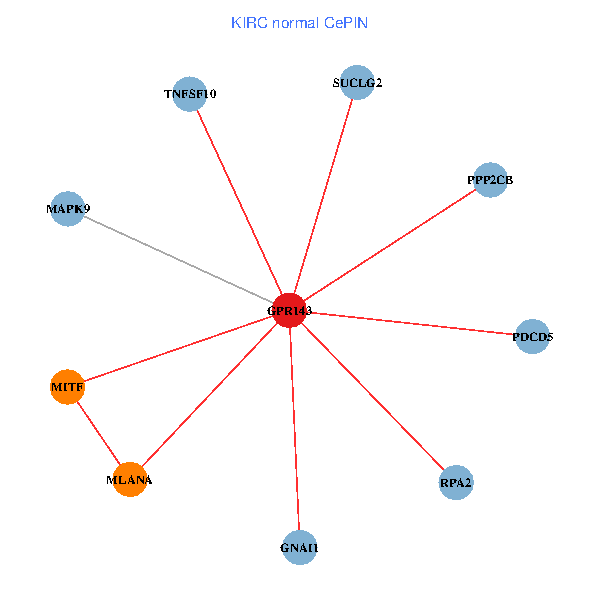
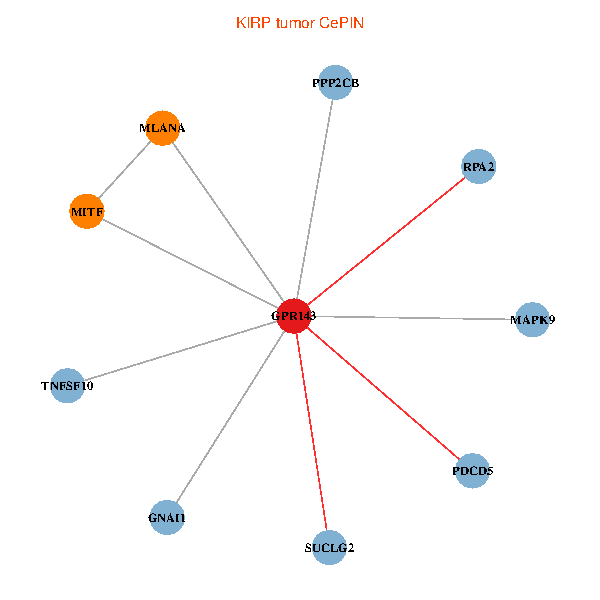
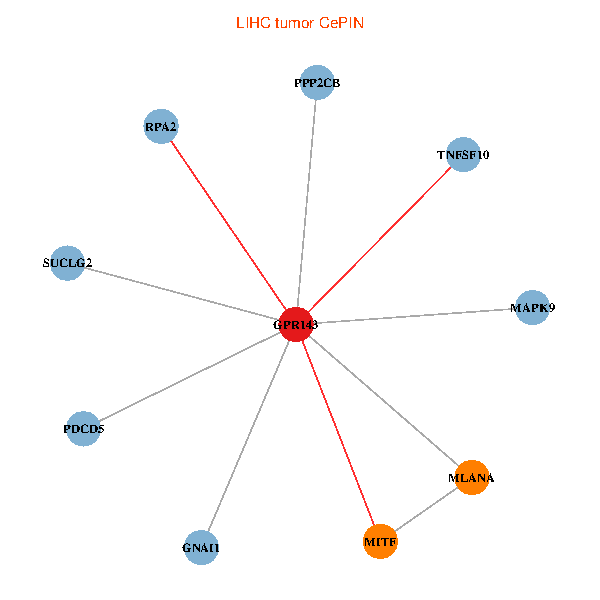
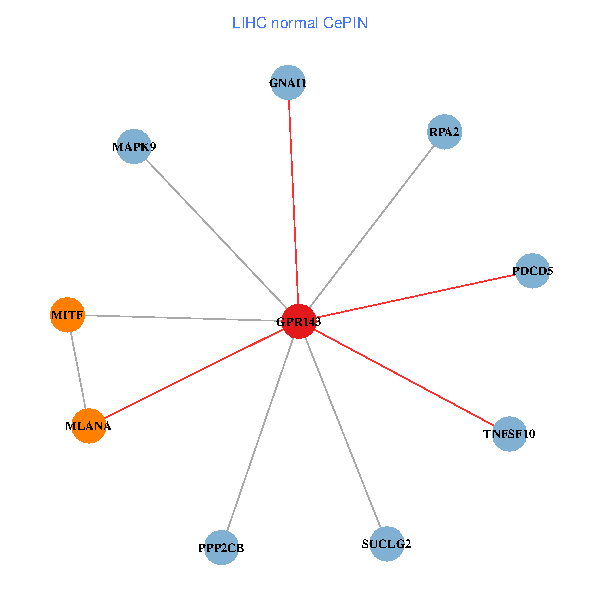
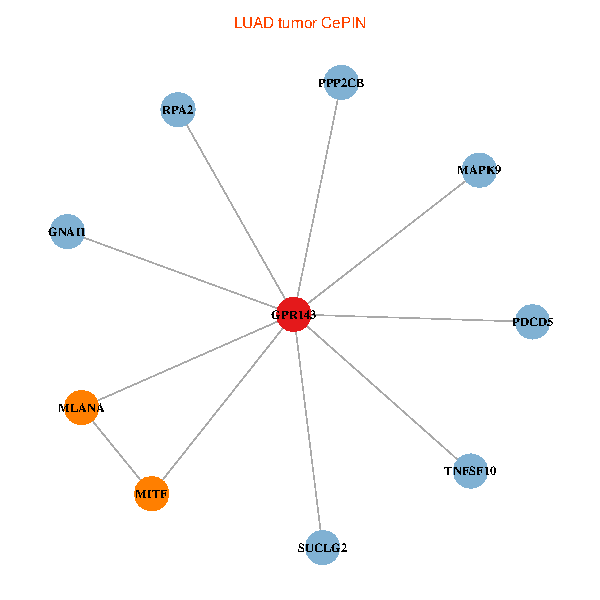
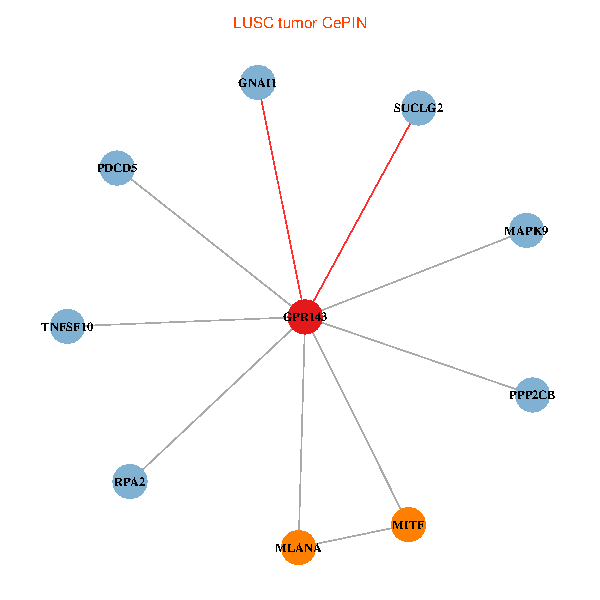
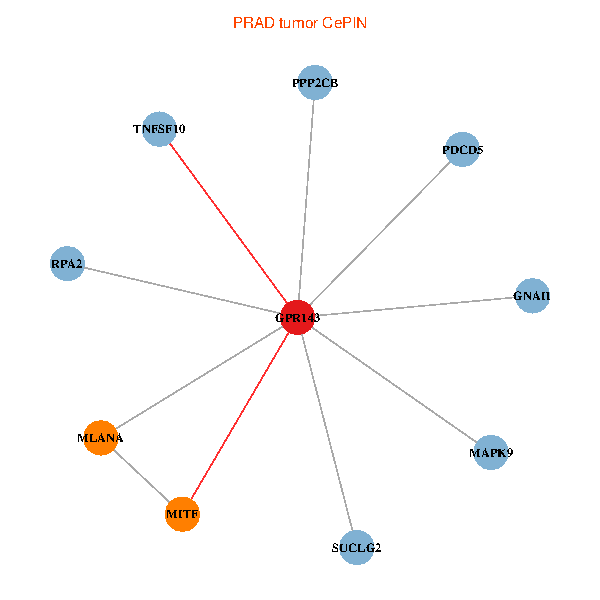
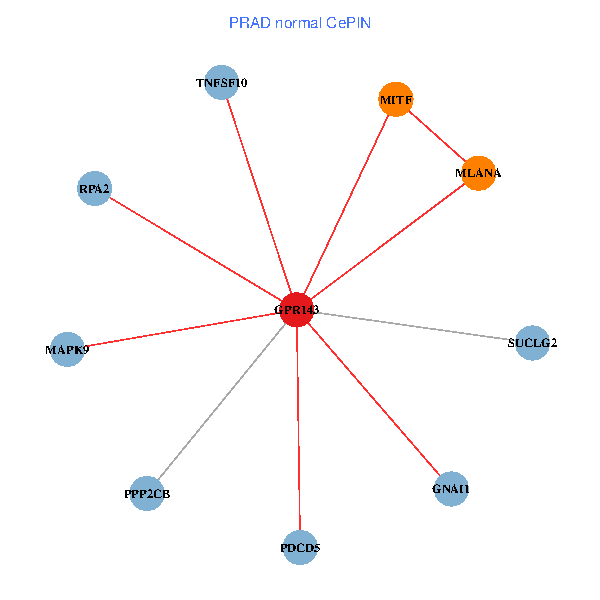
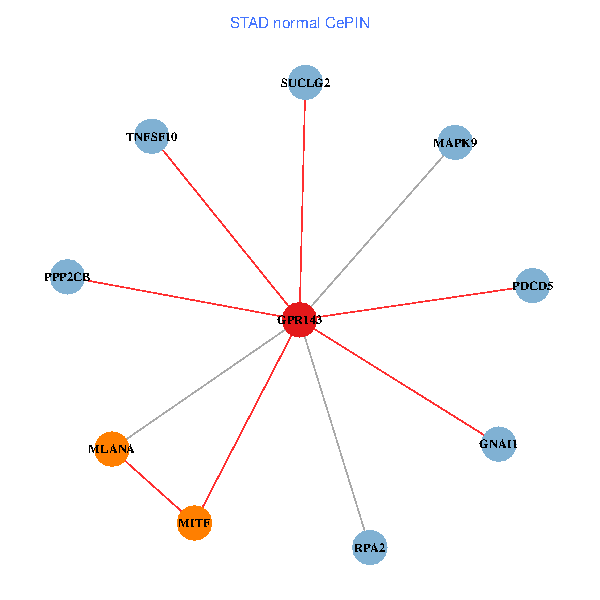
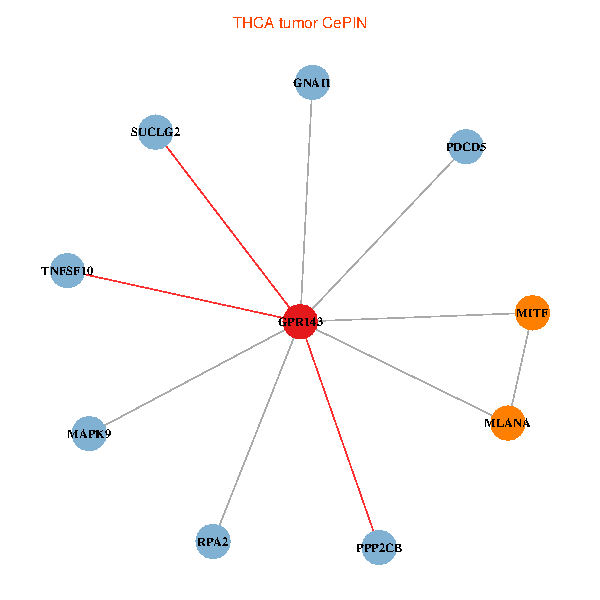
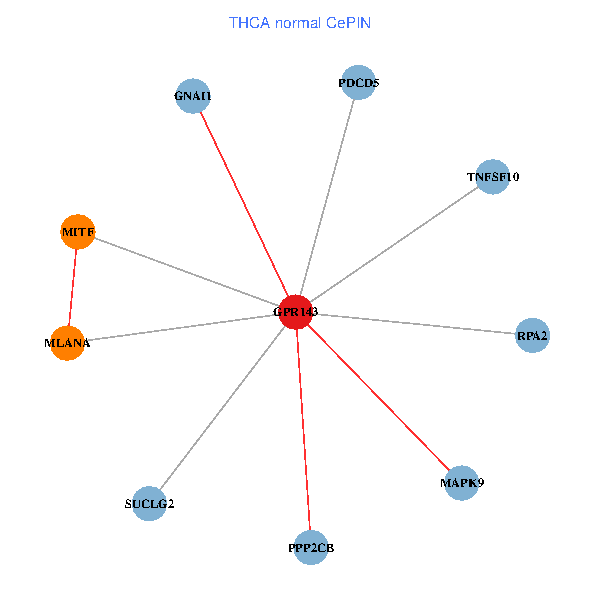
| Co-expressed gene networks based on protein-protein interaction data (CePIN) (TCGA IlluminaHiSeq_RNASeqV2, pan-cancer normalized log2(norm_counts+1) data, version 2016-08-16) (PINA2 ppi data) |
| BRCA (tumor) | BRCA (normal) |
| GPR143, MAPK9, PPP2CB, TNFSF10, RPA2, MITF, SUCLG2, GNAI1, MLANA, PDCD5 (tumor) | GPR143, MAPK9, PPP2CB, TNFSF10, RPA2, MITF, SUCLG2, GNAI1, MLANA, PDCD5 (normal) |
 |  |
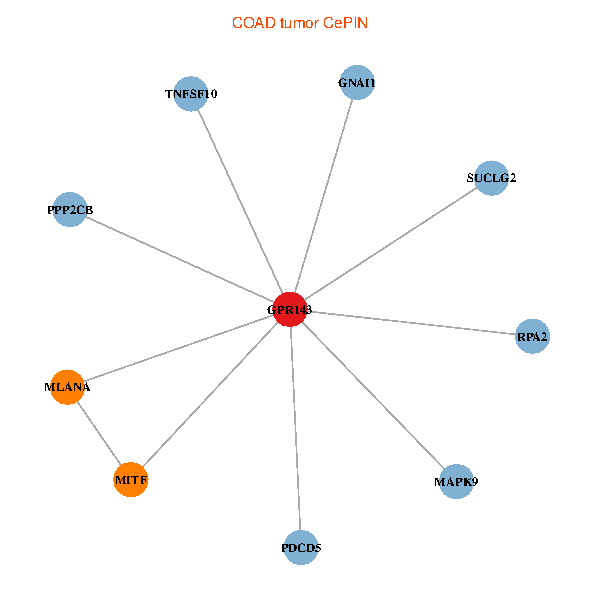
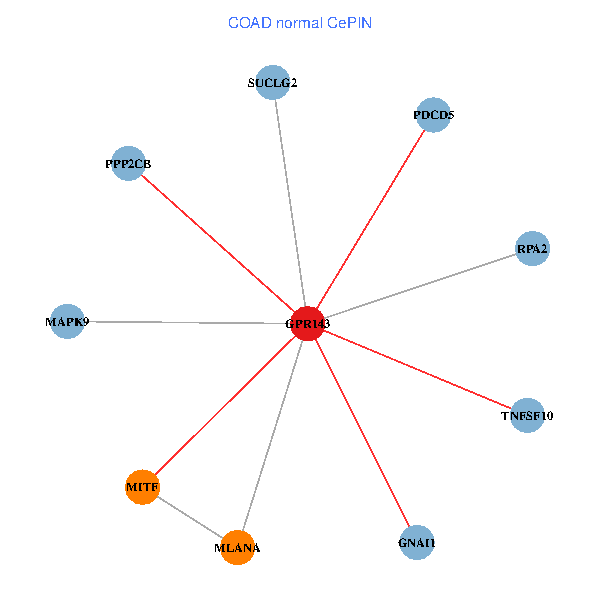
| COAD (tumor) | COAD (normal) |
| GPR143, MAPK9, PPP2CB, TNFSF10, RPA2, MITF, SUCLG2, GNAI1, MLANA, PDCD5 (tumor) | GPR143, MAPK9, PPP2CB, TNFSF10, RPA2, MITF, SUCLG2, GNAI1, MLANA, PDCD5 (normal) |
 |  |
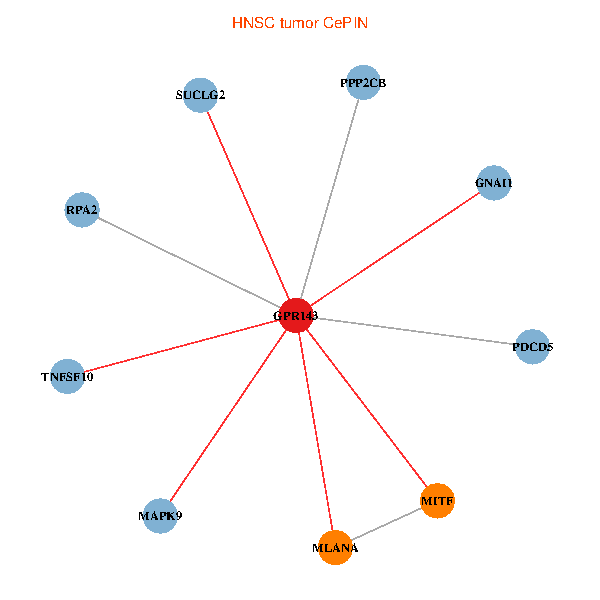
| HNSC (tumor) | HNSC (normal) |
| GPR143, MAPK9, PPP2CB, TNFSF10, RPA2, MITF, SUCLG2, GNAI1, MLANA, PDCD5 (tumor) | GPR143, MAPK9, PPP2CB, TNFSF10, RPA2, MITF, SUCLG2, GNAI1, MLANA, PDCD5 (normal) |
 |  |
| KICH (tumor) | KICH (normal) |
| GPR143, MAPK9, PPP2CB, TNFSF10, RPA2, MITF, SUCLG2, GNAI1, MLANA, PDCD5 (tumor) | GPR143, MAPK9, PPP2CB, TNFSF10, RPA2, MITF, SUCLG2, GNAI1, MLANA, PDCD5 (normal) |
 |  |
| KIRC (tumor) | KIRC (normal) |
| GPR143, MAPK9, PPP2CB, TNFSF10, RPA2, MITF, SUCLG2, GNAI1, MLANA, PDCD5 (tumor) | GPR143, MAPK9, PPP2CB, TNFSF10, RPA2, MITF, SUCLG2, GNAI1, MLANA, PDCD5 (normal) |
 |  |
| KIRP (tumor) | KIRP (normal) |
| GPR143, MAPK9, PPP2CB, TNFSF10, RPA2, MITF, SUCLG2, GNAI1, MLANA, PDCD5 (tumor) | GPR143, MAPK9, PPP2CB, TNFSF10, RPA2, MITF, SUCLG2, GNAI1, MLANA, PDCD5 (normal) |
 |  |
| LIHC (tumor) | LIHC (normal) |
| GPR143, MAPK9, PPP2CB, TNFSF10, RPA2, MITF, SUCLG2, GNAI1, MLANA, PDCD5 (tumor) | GPR143, MAPK9, PPP2CB, TNFSF10, RPA2, MITF, SUCLG2, GNAI1, MLANA, PDCD5 (normal) |
 |  |
| LUAD (tumor) | LUAD (normal) |
| GPR143, MAPK9, PPP2CB, TNFSF10, RPA2, MITF, SUCLG2, GNAI1, MLANA, PDCD5 (tumor) | GPR143, MAPK9, PPP2CB, TNFSF10, RPA2, MITF, SUCLG2, GNAI1, MLANA, PDCD5 (normal) |
 |  |
| LUSC (tumor) | LUSC (normal) |
| GPR143, MAPK9, PPP2CB, TNFSF10, RPA2, MITF, SUCLG2, GNAI1, MLANA, PDCD5 (tumor) | GPR143, MAPK9, PPP2CB, TNFSF10, RPA2, MITF, SUCLG2, GNAI1, MLANA, PDCD5 (normal) |
 |  |
| PRAD (tumor) | PRAD (normal) |
| GPR143, MAPK9, PPP2CB, TNFSF10, RPA2, MITF, SUCLG2, GNAI1, MLANA, PDCD5 (tumor) | GPR143, MAPK9, PPP2CB, TNFSF10, RPA2, MITF, SUCLG2, GNAI1, MLANA, PDCD5 (normal) |
 |  |
| STAD (tumor) | STAD (normal) |
| GPR143, MAPK9, PPP2CB, TNFSF10, RPA2, MITF, SUCLG2, GNAI1, MLANA, PDCD5 (tumor) | GPR143, MAPK9, PPP2CB, TNFSF10, RPA2, MITF, SUCLG2, GNAI1, MLANA, PDCD5 (normal) |
 |  |
| THCA (tumor) | THCA (normal) |
| GPR143, MAPK9, PPP2CB, TNFSF10, RPA2, MITF, SUCLG2, GNAI1, MLANA, PDCD5 (tumor) | GPR143, MAPK9, PPP2CB, TNFSF10, RPA2, MITF, SUCLG2, GNAI1, MLANA, PDCD5 (normal) |
 |  |
| Top |
| TissGeneProg for GPR143 |
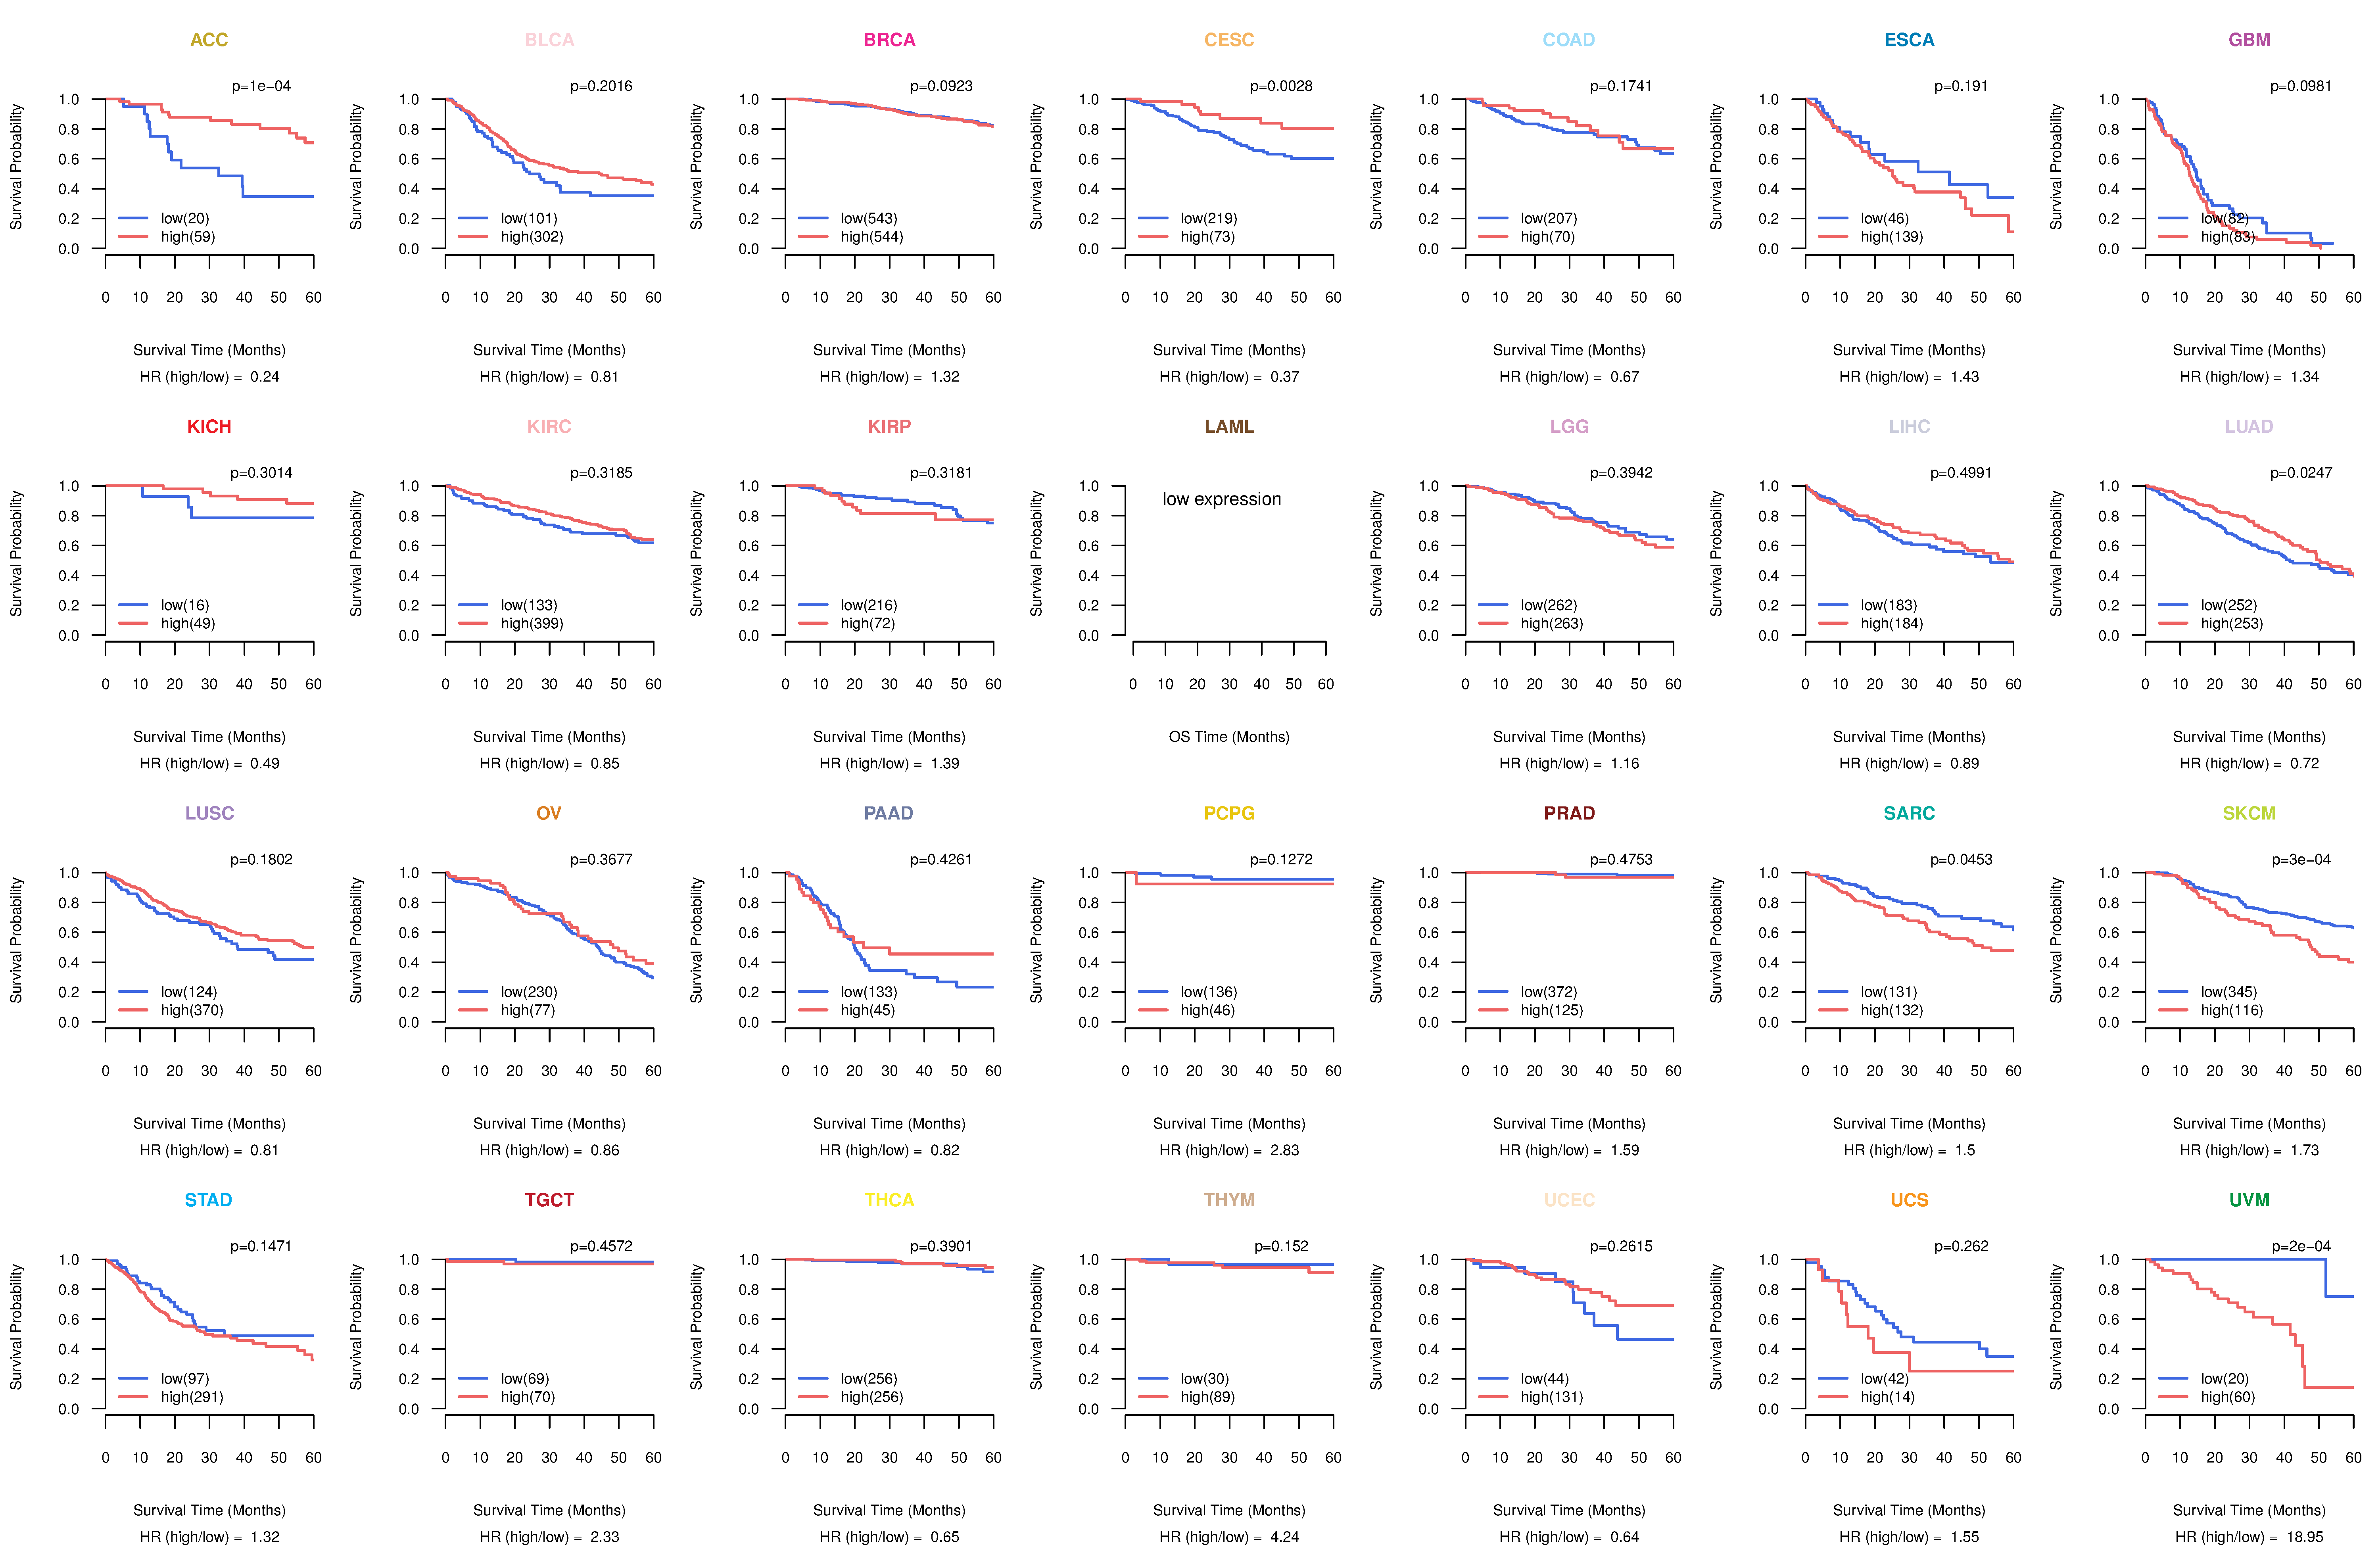
| Kaplan-Meier plots with logrank tests of overall survival (OS) using 28 cancer types (TCGA IlluminaHiSeq_RNASeqV2, pan-cancer normalized log2(norm_counts+1) data, version 2016-08-16) (TCGA clinicalMatrix, phenotype data, version 2016-04-27) * Click on the image to enlarge it in a new window. |
 |
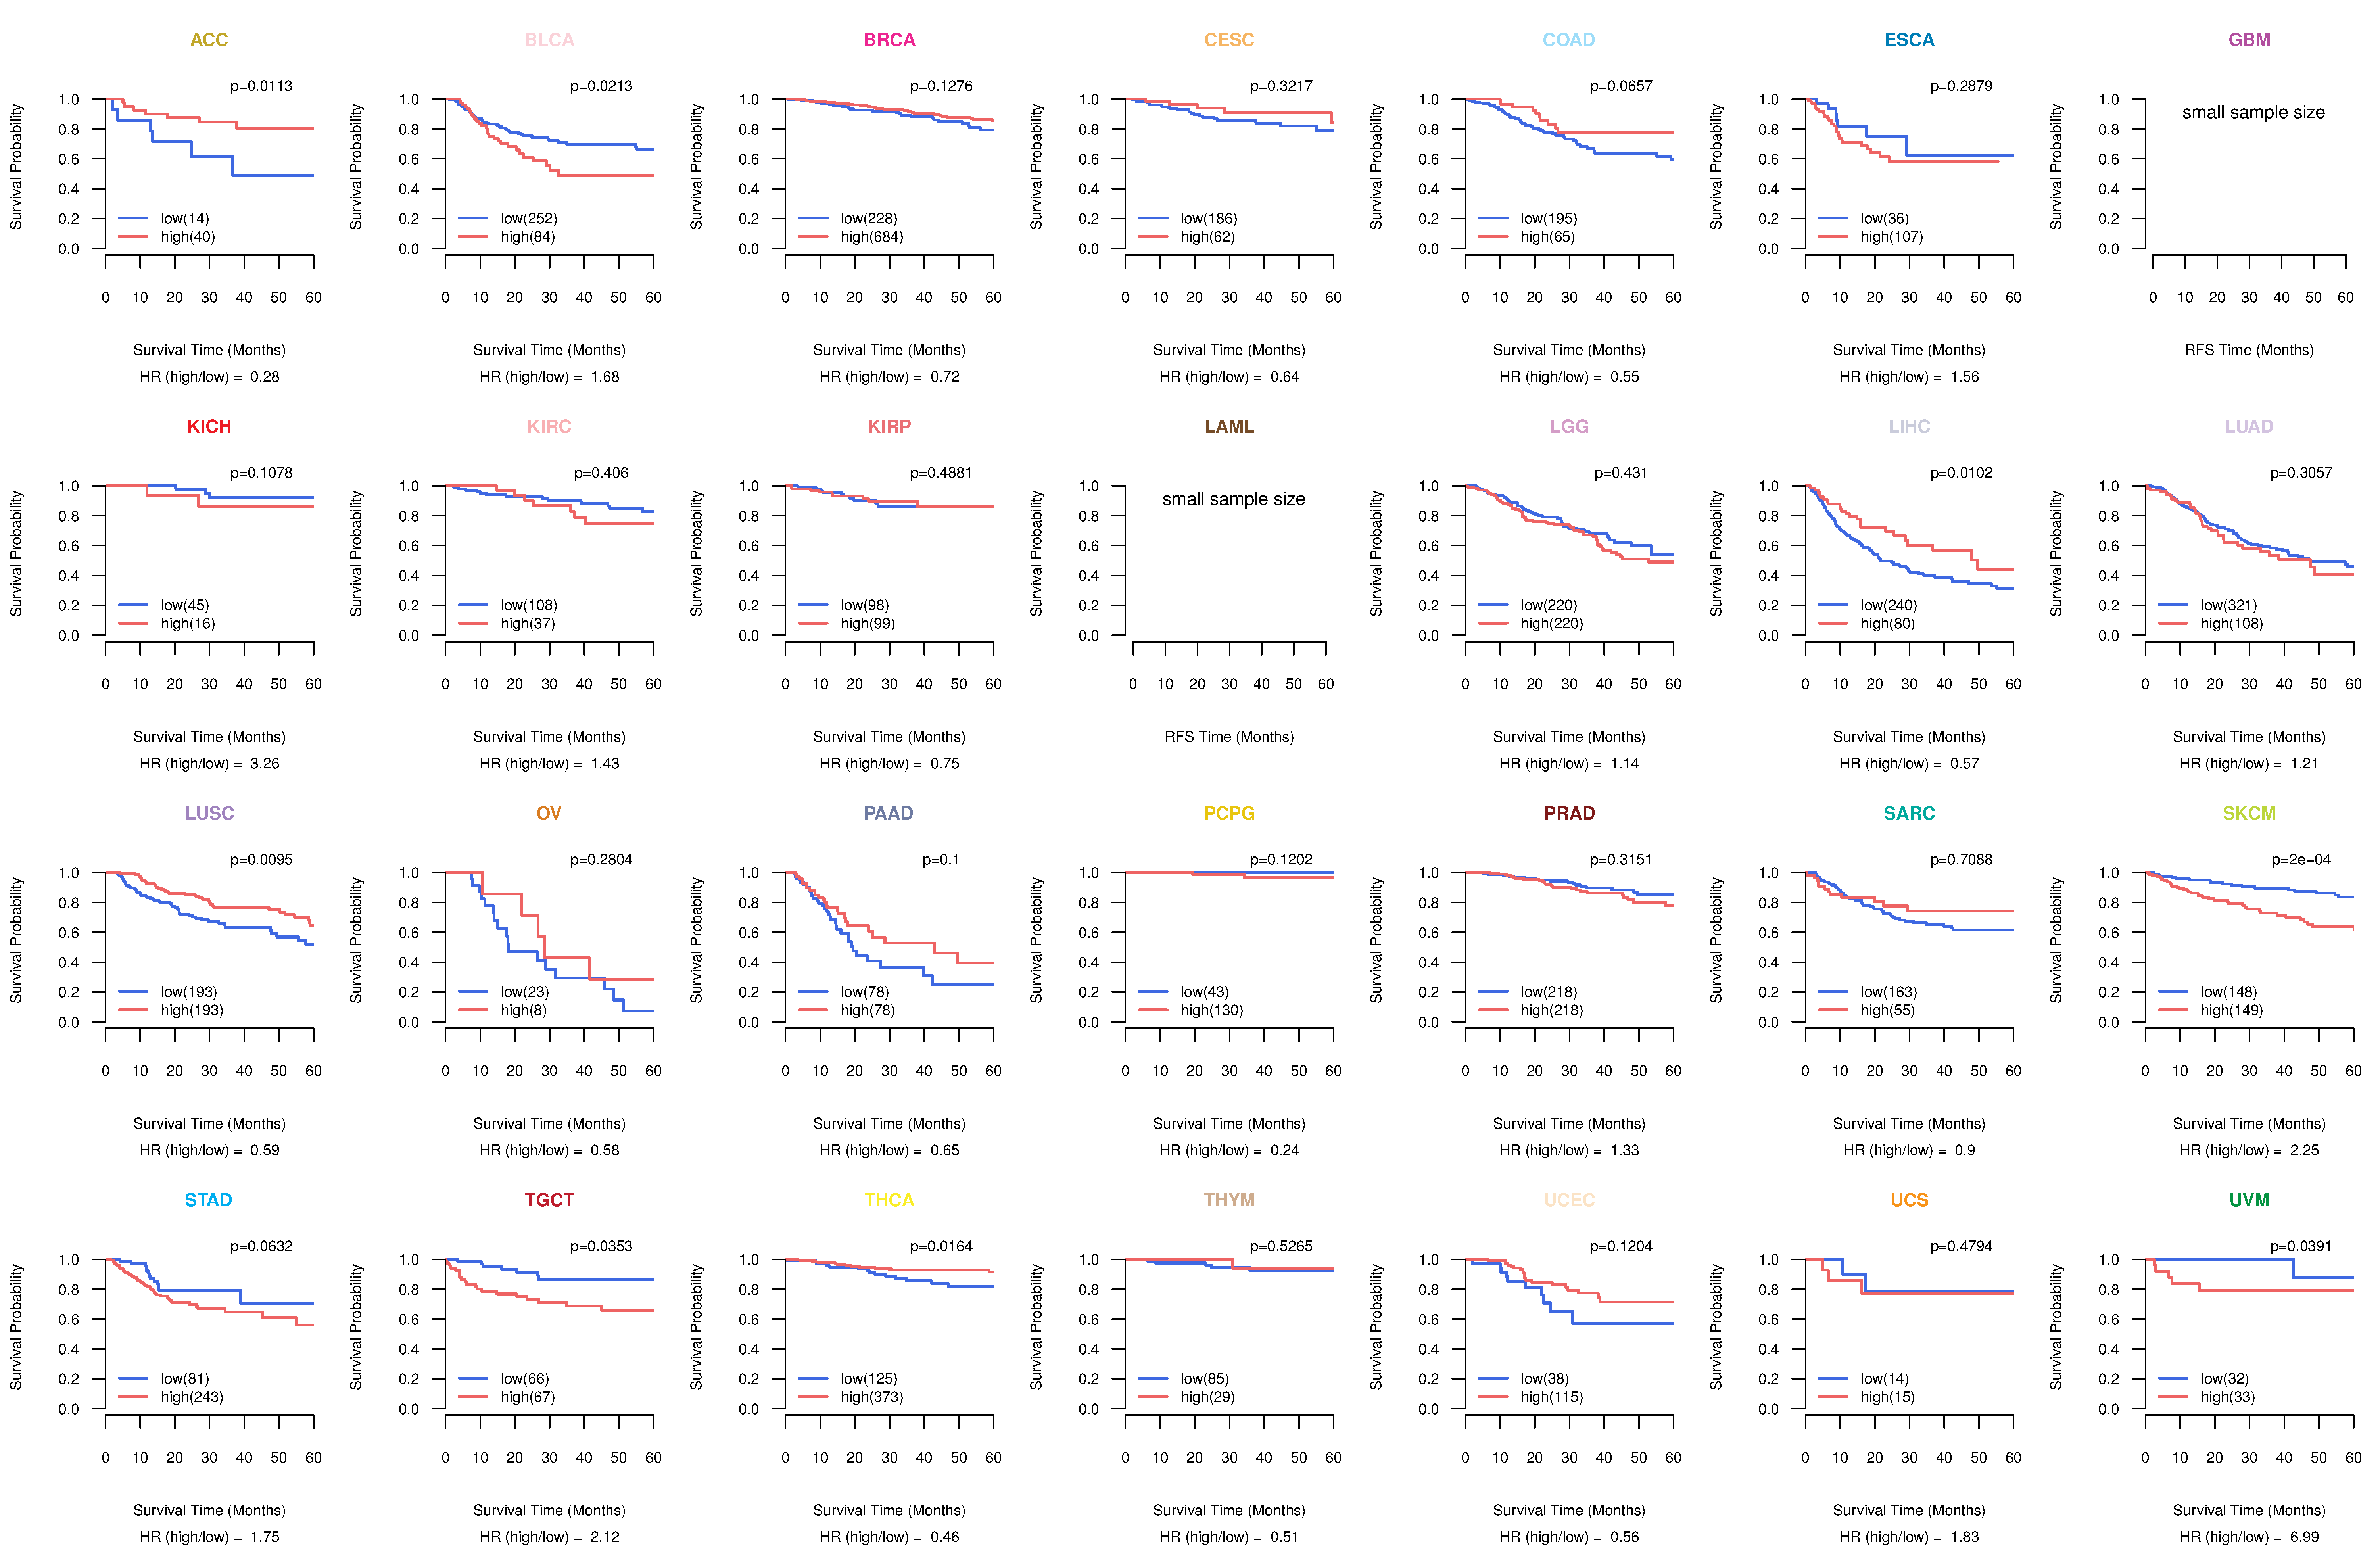
| Kaplan-Meier plots with logrank test of relapse free survival (RFS) using 28 cancer types (TCGA IlluminaHiSeq_RNASeqV2, pan-cancer normalized log2(norm_counts+1) data, version 2016-08-16) (TCGA clinicalMatrix, phenotype data, version 2016-04-27) * Click on the image enlarge it in a new window. |
 |
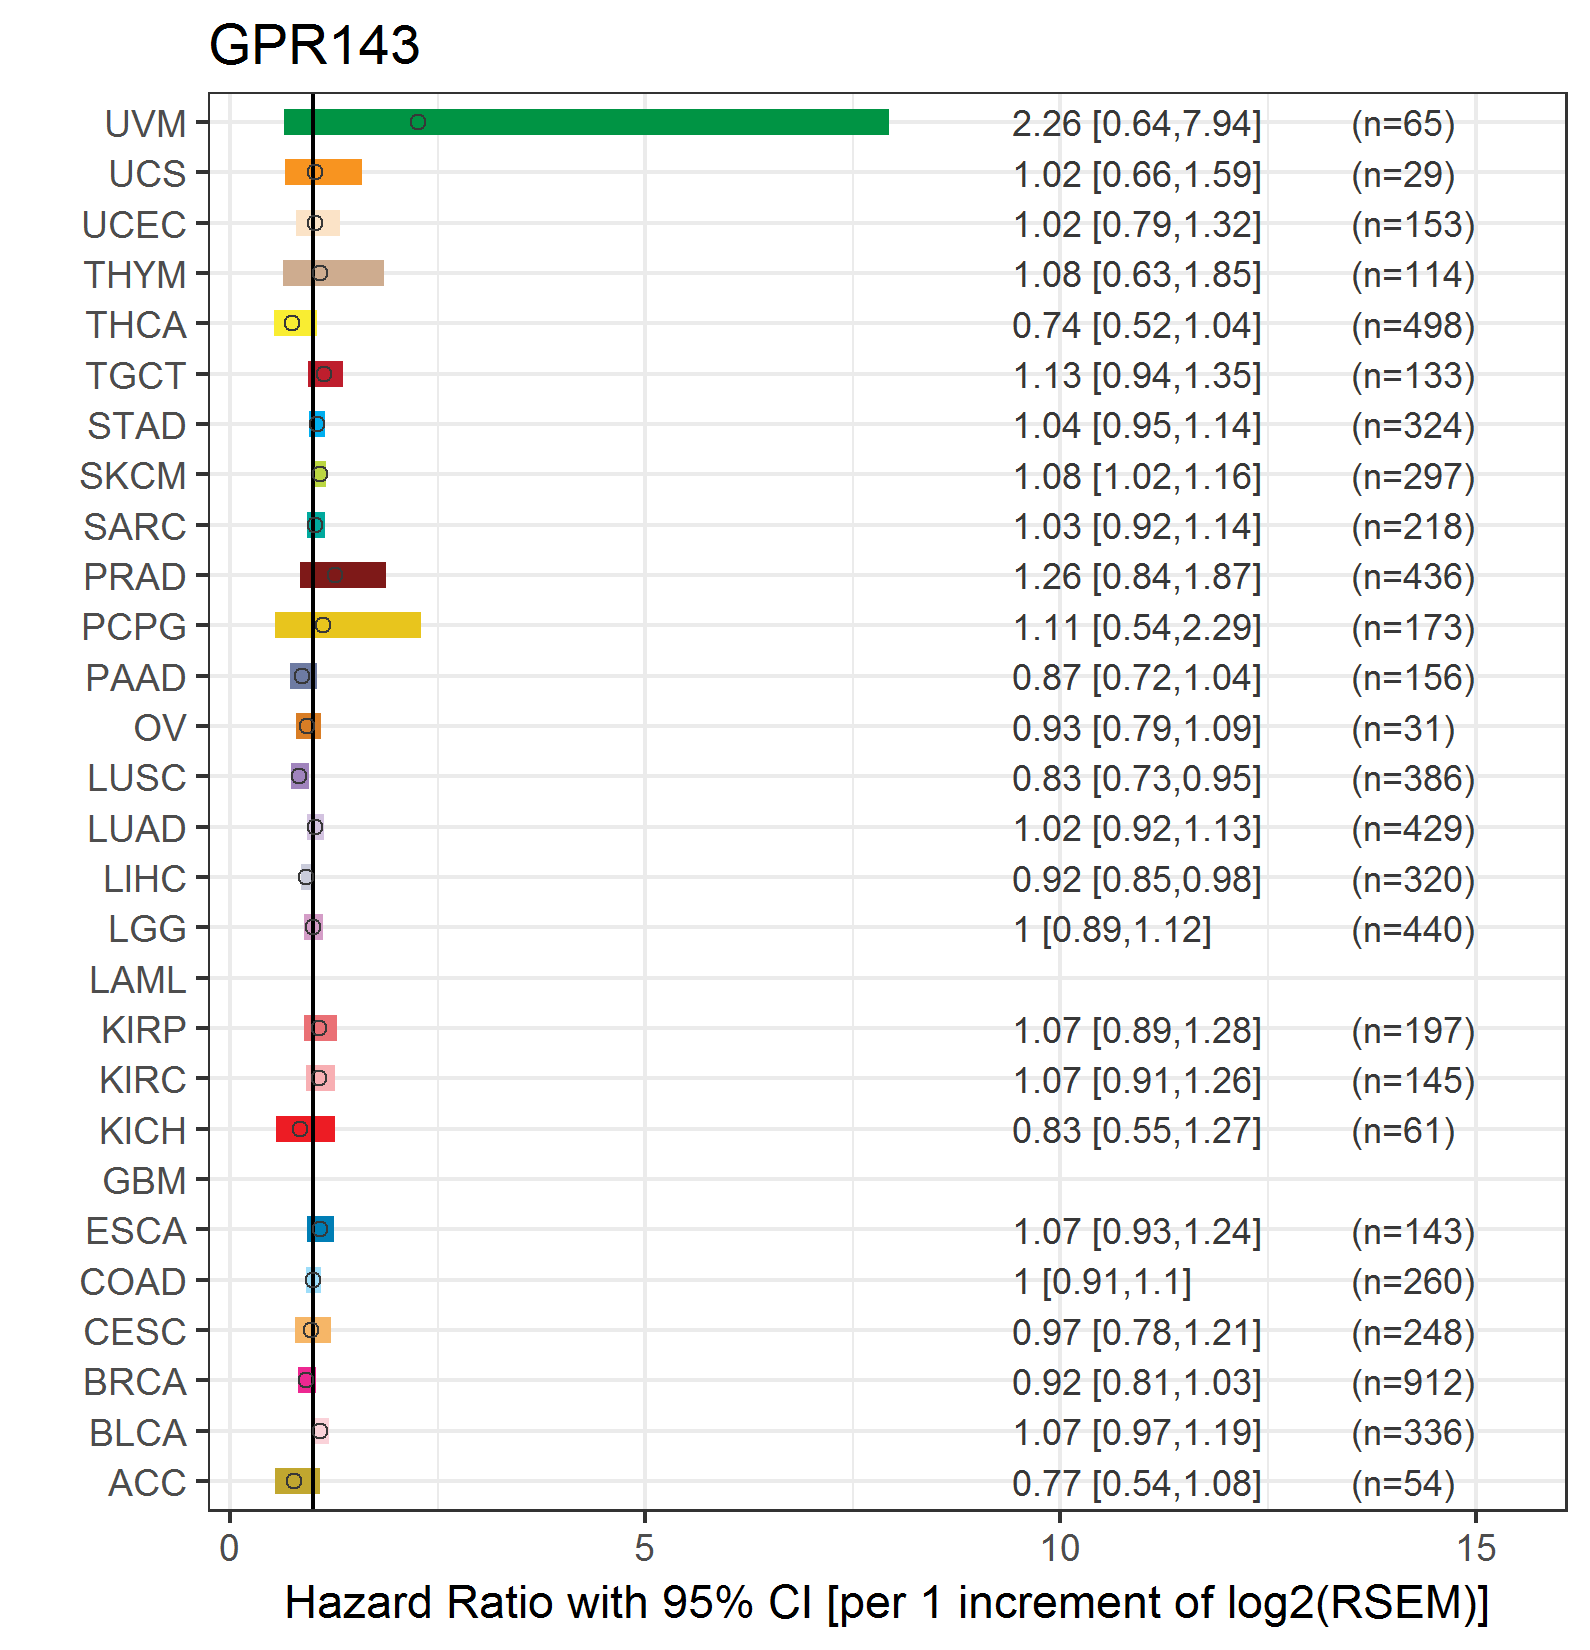
| Forest plot of Cox proportional hazard ratio (HR) and 95% CI of overall survival (OS) using 28 cancer types (TCGA IlluminaHiSeq_RNASeqV2, pan-cancer normalized log2(norm_counts+1) data, version 2016-08-16) (TCGA clinicalMatrix, phenotype data, version 2016-04-27) * Click on the image enlarge it in a new window. |
 |
| Forest plot of Cox proportional hazard ratio (HR) and 95% CI of relapse free survival (RFS) using 28 cancer types (TCGA IlluminaHiSeq_RNASeqV2, pan-cancer normalized log2(norm_counts+1) data, version 2016-08-16) (TCGA clinicalMatrix, phenotype data, version 2016-04-27) * Click on the image enlarge it in a new window. |
 |
| Top |
| TissGeneClin for GPR143 |
| TissGeneDrug for GPR143 |
| Drug information targeting TissGene (DrugBank Version 5.0.6, 2017-04-01) |
| DrugBank ID | Drug name | Drug activity | Drug type | Drug status |
| Top |
| TissGeneDisease for GPR143 |
| Disease information associated with TissGene (DisGeNet, 2016-06-01) |
| Disease ID | Disease name | # pubmeds | Source |
| umls:C0342684 | Ocular albinism, type I | 24 | BeFree,CLINVAR,CTD_human,MGD,ORPHANET,UNIPROT |
| umls:C0078917 | Albinism, Ocular | 20 | BeFree,LHGDN |
| umls:C0700501 | Congenital nystagmus | 5 | BeFree,LHGDN |
| umls:C0001916 | Albinism | 3 | BeFree |
| umls:C0028738 | Nystagmus | 3 | BeFree |
| umls:C0078918 | Albinism, Oculocutaneous | 3 | BeFree |
| umls:C0585539 | X-Linked Infantile Nystagmus | 3 | BeFree |
| umls:C0025202 | melanoma | 2 | BeFree,LHGDN |
| umls:C0162835 | Hypopigmentation disorder | 2 | BeFree |
| umls:C1876214 | ALBINOIDISM, OCULOCUTANEOUS, AUTOSOMAL DOMINANT | 2 | BeFree |
| umls:C0015397 | Disorder of eye | 1 | BeFree |
| umls:C3151752 | NYSTAGMUS 6, CONGENITAL, X-LINKED | 1 | CLINVAR,CTD_human,UNIPROT |
|
Copyright 2016-Present - The University of Texas Health Science Center at Houston (UTHealth) Web File Viewing | How to Report, Fraud, Waste and Abuse | State of Texas | Statewide Search | Texas Homeland Security | Site Policies |