 |
| |
| |
| |
| |
| |
| |
|

| TissGeneSummary for ODF1 |
 Gene summary Gene summary |
| Basic gene information | Gene symbol | ODF1 |
| Gene name | outer dense fiber of sperm tails 1 | |
| Synonyms | CT133|HSPB10|ODF|ODF2|ODF27|ODFP|ODFPG|ODFPGA|ODFPGB|RT7|SODF | |
| Cytomap | UCSC genome browser: 8q22.3 | |
| Type of gene | protein-coding | |
| RefGenes | NM_024410.3, | |
| Description | cancer/testis antigen 133outer dense fiber of sperm tails, 27-kDouter dense fiber protein 1 | |
| Modification date | 20141207 | |
| dbXrefs | MIM : 182878 | |
| HGNC : HGNC | ||
| Ensembl : ENSG00000155087 | ||
| HPRD : 01687 | ||
| Vega : OTTHUMG00000164719 | ||
| Protein | UniProt: go to UniProt's Cross Reference DB Table | |
| Expression | CleanEX: HS_ODF1 | |
| BioGPS: 4956 | ||
| Pathway | NCI Pathway Interaction Database: ODF1 | |
| KEGG: ODF1 | ||
| REACTOME: ODF1 | ||
| Pathway Commons: ODF1 | ||
| Context | iHOP: ODF1 | |
| ligand binding site mutation search in PubMed: ODF1 | ||
| UCL Cancer Institute: ODF1 | ||
| Assigned class in TissGDB* | C | |
| Included tissue-specific gene expression resources | HPA,GTEx | |
| Specific-tissues in normal samples (assigned by TissGDB using HPA, TiGER, and GTEx) | Testis | |
| Cancer types related to the specific-tissues in cancer samples (assigned by TissGDB using TCGA) | TGCT | |
| Reference showing the relevant tissue of ODF1 | ||
| Description by TissGene annotations | ||
| * Class A consists of genes with literature evidence and is part of the cTissGenes. Class B consists of only cTissGenes without additional evidence. The remaining genes belong to Class C. |
| Gene ontology having evidence of Inferred from Direct Assay (IDA) from Entrez |
| GO ID | GO term | PubMed ID |
| Top |
| TissGeneExp for ODF1 |
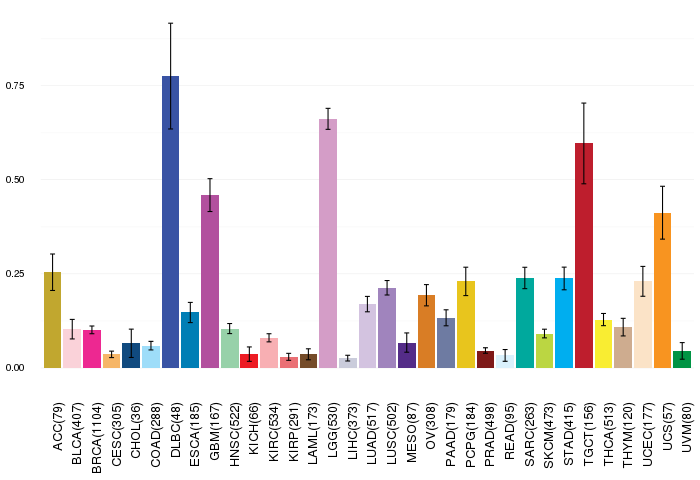
| Gene expressions across 28 cancer types (X-axis: cancer type and Y-axis: log2(norm_counts+1)) (TCGA IlluminaHiSeq_RNASeqV2, pan-cancer normalized log2(norm_counts+1) data, version 2016-08-16) |
 |
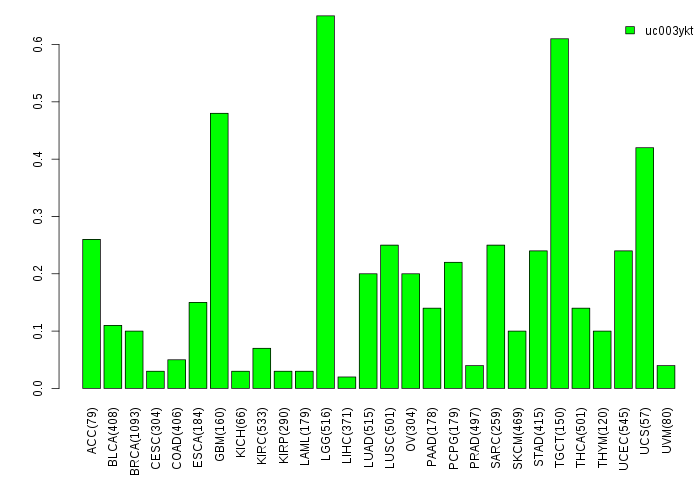
| Gene isoform expressions across 28 cancer types (X-axis: cancer type and Y-axis: log2(norm_counts+1)) (TCGA pan-cancer tcga_rsem_isoform_tpm, version 2016-09-01) |
 |
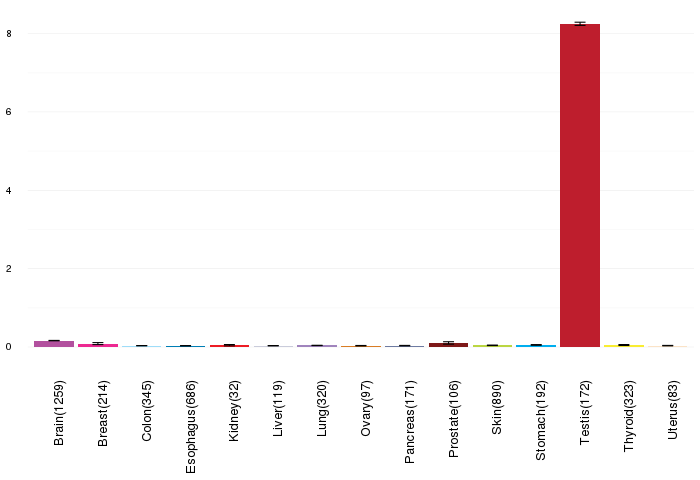
| Gene expressions across normal tissues of GTEx data (GTEx GTEx_Analysis_v6_RNA-seq_RNA-SeQCv1.1.8_gene_rpkm.gct) - Here, we shows the matched tissue types only among our 28 cancer types. |
 |
| Different expressions across 14 cancer types with more than 10 samples between matched tumors and normals (X-axis: cancer type and Y-axis: log2(norm_counts+1)) (TCGA IlluminaHiSeq_RNASeqV2, pan-cancer normalized log2(norm_counts+1) data, version 2016-08-16) |
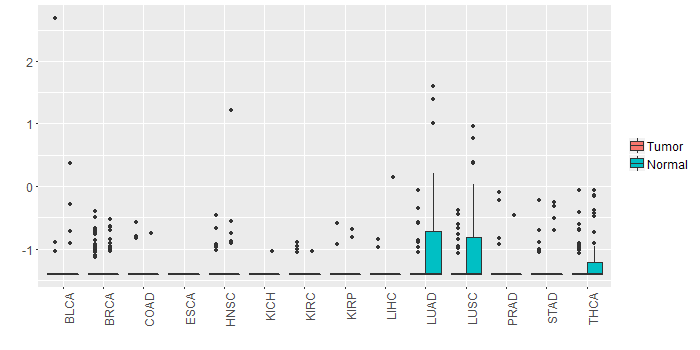 |
| - Significantly differentially expressed cancer types and information. (|Fold change|>1 and FDR<0.05) |
| Cancer type | Mean(exp) in tumor | Mean(exp) in matched normal | Log2FC | P-val. | FDR |
| Top |
| TissGene-miRNA for ODF1 |
| Significantly anti-correlated miRNAs of TissGene across 28 cancer types (Gene-miRNA relations from TargetScanHuman Relsease 7.1, Conserved_Site_Context_Scores.txt.zip, 06.01.2016) (TCGA IlluminaHiSeq_miRNASeq, log2(RPM+1) data, version 2016-11-21) (TCGA IlluminaHiSeq_RNASeqV2, log2(normalized_count+1) data, version 2016-08-16) (Spearman’s Rank Correlation (p-value<0.05 and coefficient<-0.25)) |
| Cancer type | miRNA id | miRNA accession | P-val. | Coeff. | # samples |
| Top |
| TissGeneMut for ODF1 |
| TissGeneSNV for ODF1 |
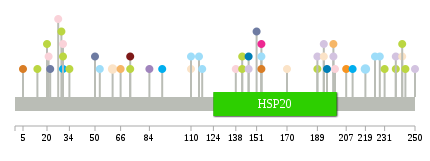
| nsSNV counts per each loci. Different colors of circles represent different cancer types. Circle size denotes number of samples. (TCGA somatic mutation (SNPs and small INDELs) data, version 2016-04-25) * Click on the image to enlarge it in a new window. |
 |
 |
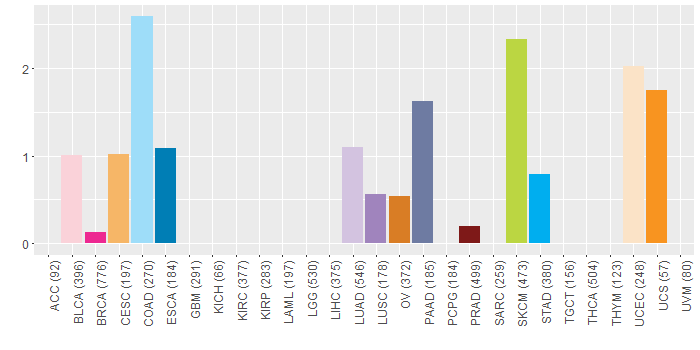
| Somatic nucleotide variants of TissGene across 28 cancer types (X-axis: cancer type and Y-axis: % of mutated samples) The numbers in parentheses are numbers of samples with mutation (nsSNVs). (TCGA somatic mutation (SNPs and small INDELs) data, version 2016-04-25) |
 |
| - nsSNVs sorted by frequency. |
| AAchange | Cancer type | # samples |
| p.N219S | COAD | 2 |
| p.R61Q | UCEC | 2 |
| p.E30K | BLCA | 1 |
| p.R34L | SKCM | 1 |
| p.R142X | SKCM | 1 |
| p.C27F | BLCA | 1 |
| p.Q138E | BLCA | 1 |
| p.N170T | UCEC | 1 |
| p.P72S | SKCM | 1 |
| p.S189F | SKCM | 1 |
| p.D14N | SKCM | 1 |
| p.S244F | SKCM | 1 |
| p.R242* | SKCM | 1 |
| p.E21Q | BLCA | 1 |
| p.G66S | CESC | 1 |
| p.R103X | READ | 1 |
| p.P53L | COAD | 1 |
| p.R84* | LUSC | 1 |
| p.E199K | CESC | 1 |
| p.D231N | SKCM | 1 |
| p.E30K | SKCM | 1 |
| p.R92M | STAD | 1 |
| p.S228N | COAD | 1 |
| p.F243L | DLBC | 1 |
| p.A117D | COAD | 1 |
| p.P238R | LUAD | 1 |
| p.G146* | LUAD | 1 |
| p.I115M | COAD | 1 |
| p.R154G | OV | 1 |
| p.S5T | OV | 1 |
| p.E199* | LUAD | 1 |
| p.P220S | HNSC | 1 |
| p.G193C | LUAD | 1 |
| p.H50N | PAAD | 1 |
| p.R110G | COAD | 1 |
| p.G193D | UCEC | 1 |
| p.C195W | ESCA | 1 |
| p.S200C | BLCA | 1 |
| p.S207F | UCS | 1 |
| p.R154W | BRCA | 1 |
| p.D29N | SKCM | 1 |
| p.P238L | SKCM | 1 |
| p.S151X | PAAD | 1 |
| p.S189Y | LUAD | 1 |
| p.G146X | ESCA | 1 |
| p.R154W | COAD | 1 |
| p.R242Q | UCEC | 1 |
| p.R103Q | HNSC | 1 |
| p.N225S | COAD | 1 |
| p.L250S | LUAD | 1 |
| p.R20K | SKCM | 1 |
| p.S222N | DLBC | 1 |
| p.R110K | UCEC | 1 |
| p.R142* | SKCM | 1 |
| p.P211L | STAD | 1 |
| p.E30K | STAD | 1 |
| p.P72Q | PRAD | 1 |
| p.L22I | PAAD | 1 |
| Top |
| TissGeneCNV for ODF1 |
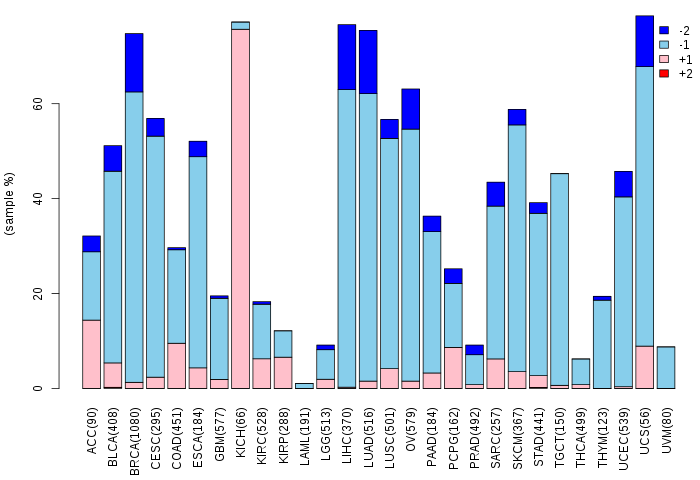
| Copy number variations of TissGene across 28 cancer types (X-axis: cancer type and Y-axis: % of CNV samples) (TCGA Gistic2_CopyNumber_Gistic2_all_data_by_genes, Gistic2 copy number data, version 2016-08-16) |
 |
| Top |
| TissGeneFusions for ODF1 |
| Fusion genes including TissGene (ChimerDB 3.0, 2016-12-01 and TCGA fusion Portal 2015-12-01) |
| Database | Src | Cancer type | Sample | Fusion gene | ORF | 5'-gene BP | 3'-gene BP |
| Chimerdb3.0 | FusionScan | BRCA | TCGA-E9-A22B-01A | RIMS2-ODF1 | In-Frame | chr8:104513290 | chr8:103572679 |
| Chimerdb3.0 | FusionScan | LUAD | TCGA-44-5644-01A | TTC28-ODF1 | Out-of-Frame | chr22:29025539 | chr8:103572679 |
| TCGAfusionPortal | PRADA | BLCA | TCGA-BT-A20W-01A | ANKRD46-ODF1 | Out-of-frame | Chr8:101534834 | Chr8:103572680 |
| TCGAfusionPortal | PRADA | BRCA | TCGA-E9-A22B-01A | RIMS2-ODF1 | In-frame | Chr8:104513290 | Chr8:103572680 |
| TCGAfusionPortal | PRADA | LUAD | TCGA-44-5644-01A | TTC28-ODF1 | Out-of-frame | Chr22:29025540 | Chr8:103572680 |
| Top |
| TissGeneNet for ODF1 |
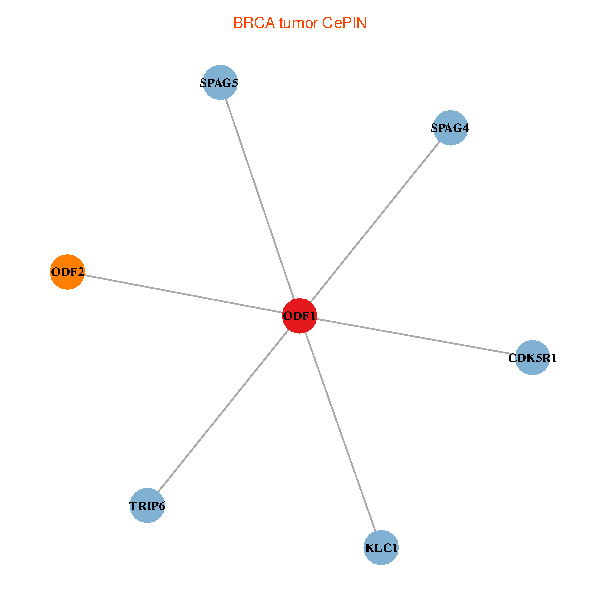
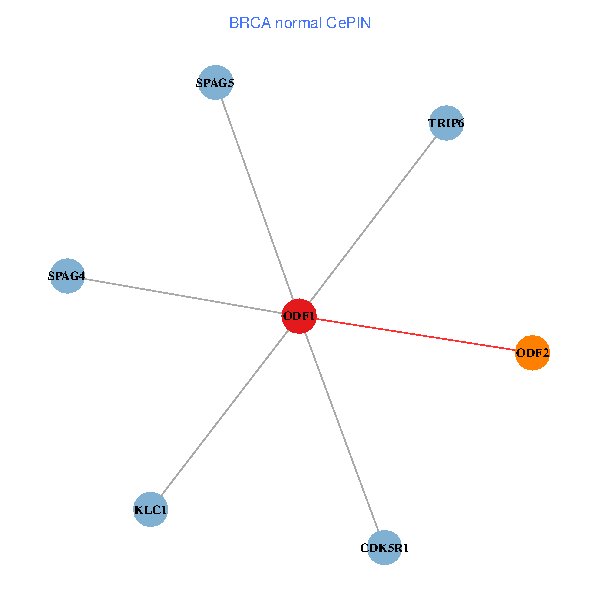
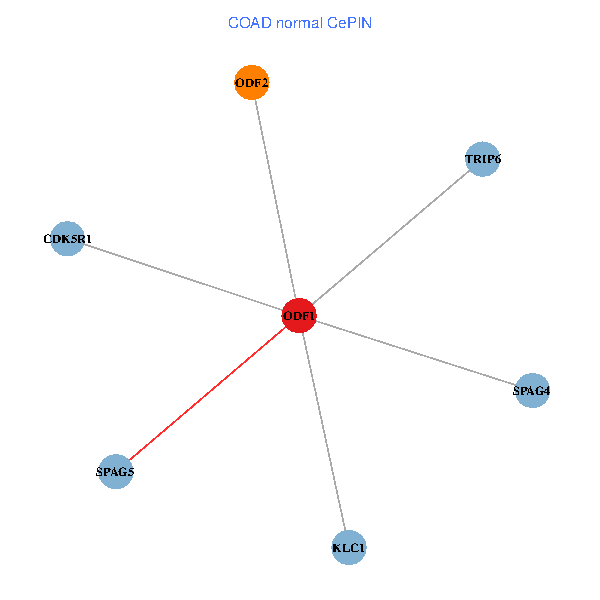
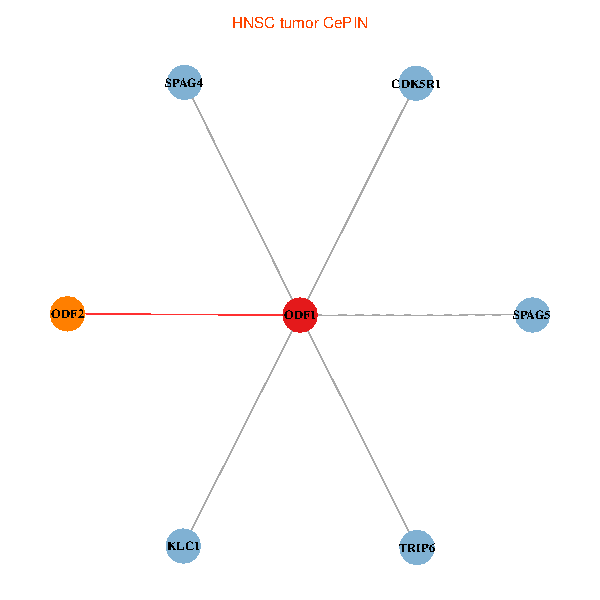
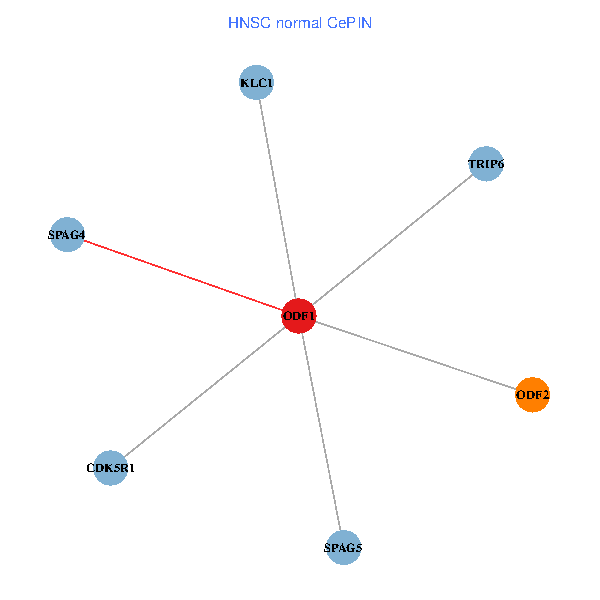
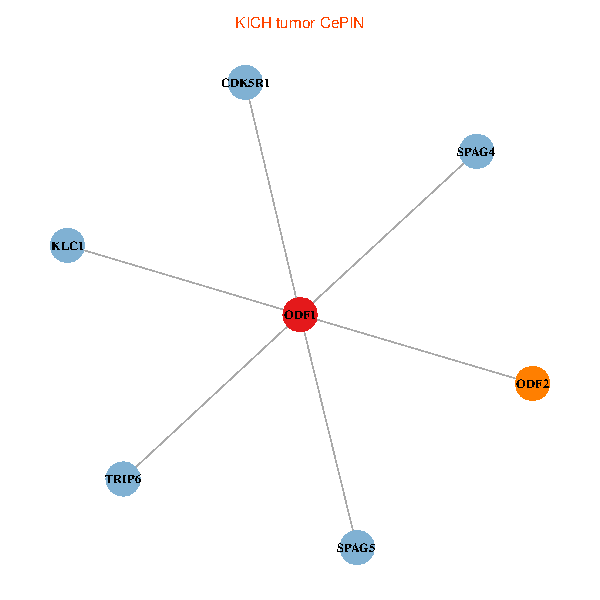
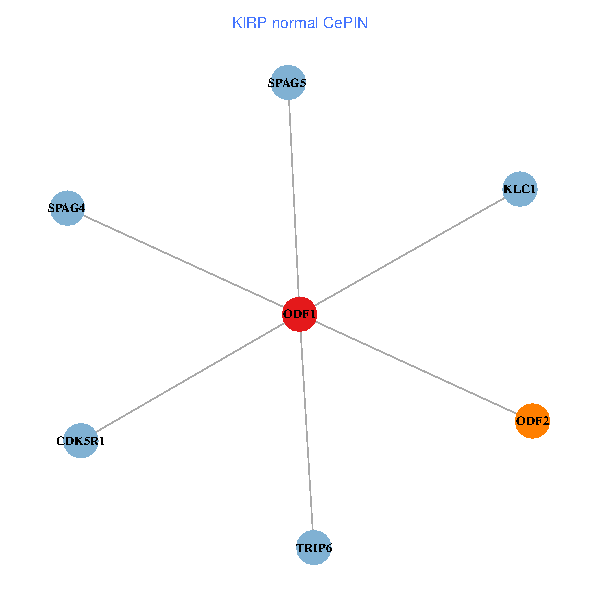
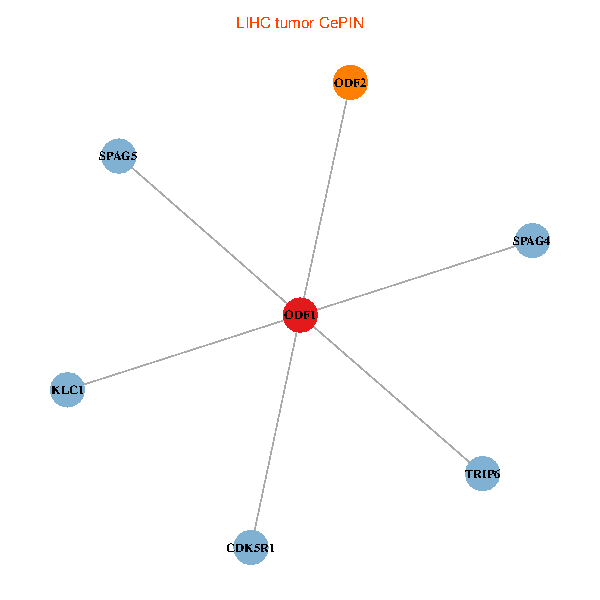
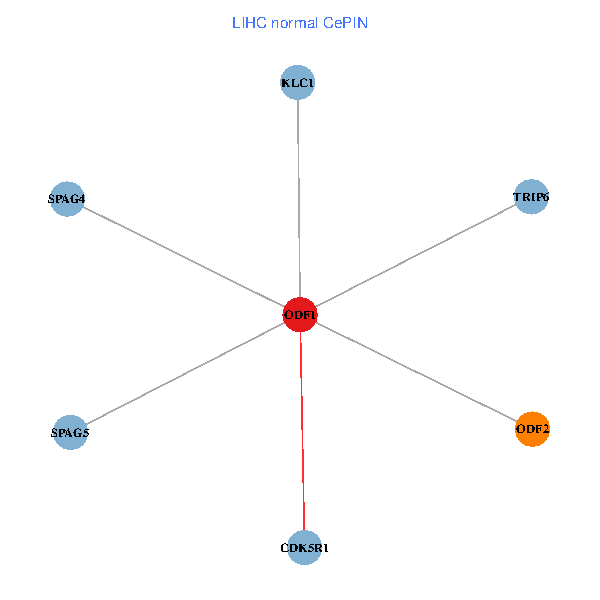
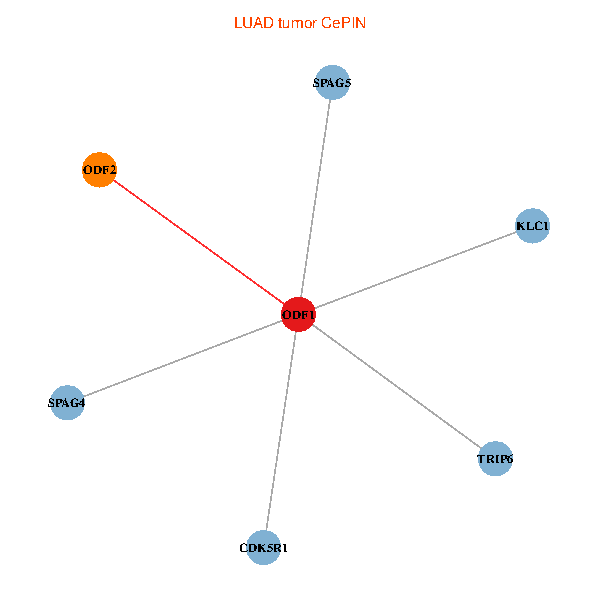
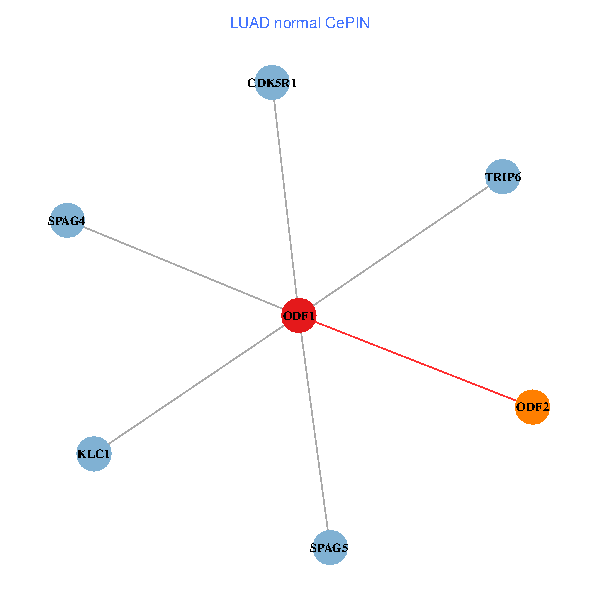
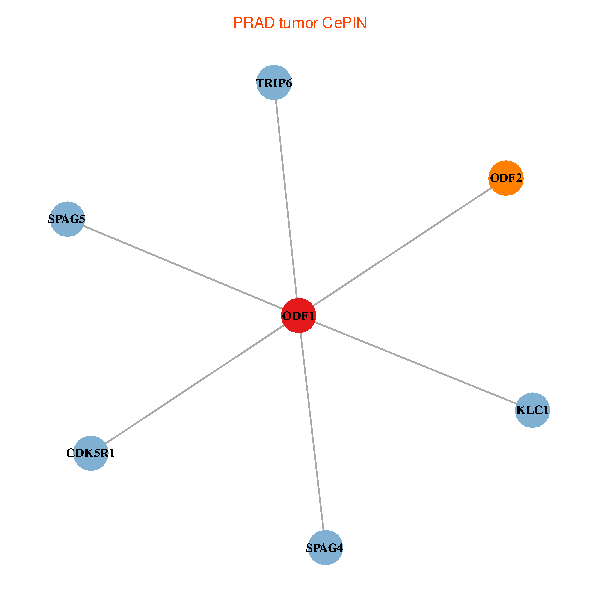
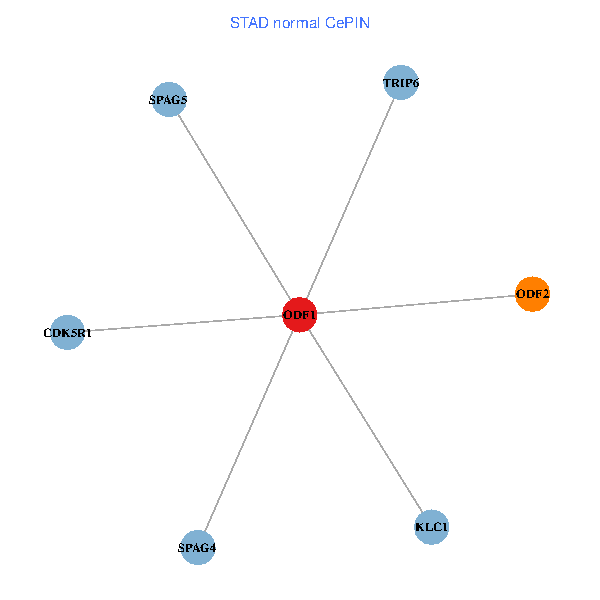
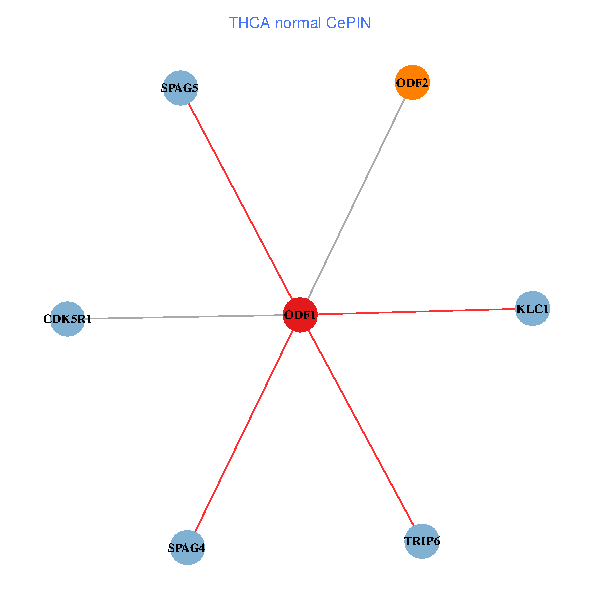
| Co-expressed gene networks based on protein-protein interaction data (CePIN) (TCGA IlluminaHiSeq_RNASeqV2, pan-cancer normalized log2(norm_counts+1) data, version 2016-08-16) (PINA2 ppi data) |
| BRCA (tumor) | BRCA (normal) |
| ODF1, TRIP6, CDK5R1, KLC1, ODF2, SPAG5, SPAG4 (tumor) | ODF1, TRIP6, CDK5R1, KLC1, ODF2, SPAG5, SPAG4 (normal) |
 |  |
| COAD (tumor) | COAD (normal) |
| ODF1, TRIP6, CDK5R1, KLC1, ODF2, SPAG5, SPAG4 (tumor) | ODF1, TRIP6, CDK5R1, KLC1, ODF2, SPAG5, SPAG4 (normal) |
 |  |
| HNSC (tumor) | HNSC (normal) |
| ODF1, TRIP6, CDK5R1, KLC1, ODF2, SPAG5, SPAG4 (tumor) | ODF1, TRIP6, CDK5R1, KLC1, ODF2, SPAG5, SPAG4 (normal) |
 |  |
| KICH (tumor) | KICH (normal) |
| ODF1, TRIP6, CDK5R1, KLC1, ODF2, SPAG5, SPAG4 (tumor) | ODF1, TRIP6, CDK5R1, KLC1, ODF2, SPAG5, SPAG4 (normal) |
 |  |
| KIRC (tumor) | KIRC (normal) |
| ODF1, TRIP6, CDK5R1, KLC1, ODF2, SPAG5, SPAG4 (tumor) | ODF1, TRIP6, CDK5R1, KLC1, ODF2, SPAG5, SPAG4 (normal) |
 |  |
| KIRP (tumor) | KIRP (normal) |
| ODF1, TRIP6, CDK5R1, KLC1, ODF2, SPAG5, SPAG4 (tumor) | ODF1, TRIP6, CDK5R1, KLC1, ODF2, SPAG5, SPAG4 (normal) |
 |  |
| LIHC (tumor) | LIHC (normal) |
| ODF1, TRIP6, CDK5R1, KLC1, ODF2, SPAG5, SPAG4 (tumor) | ODF1, TRIP6, CDK5R1, KLC1, ODF2, SPAG5, SPAG4 (normal) |
 |  |
| LUAD (tumor) | LUAD (normal) |
| ODF1, TRIP6, CDK5R1, KLC1, ODF2, SPAG5, SPAG4 (tumor) | ODF1, TRIP6, CDK5R1, KLC1, ODF2, SPAG5, SPAG4 (normal) |
 |  |
| LUSC (tumor) | LUSC (normal) |
| ODF1, TRIP6, CDK5R1, KLC1, ODF2, SPAG5, SPAG4 (tumor) | ODF1, TRIP6, CDK5R1, KLC1, ODF2, SPAG5, SPAG4 (normal) |
 |  |
| PRAD (tumor) | PRAD (normal) |
| ODF1, TRIP6, CDK5R1, KLC1, ODF2, SPAG5, SPAG4 (tumor) | ODF1, TRIP6, CDK5R1, KLC1, ODF2, SPAG5, SPAG4 (normal) |
 |  |
| STAD (tumor) | STAD (normal) |
| ODF1, TRIP6, CDK5R1, KLC1, ODF2, SPAG5, SPAG4 (tumor) | ODF1, TRIP6, CDK5R1, KLC1, ODF2, SPAG5, SPAG4 (normal) |
 |  |
| THCA (tumor) | THCA (normal) |
| ODF1, TRIP6, CDK5R1, KLC1, ODF2, SPAG5, SPAG4 (tumor) | ODF1, TRIP6, CDK5R1, KLC1, ODF2, SPAG5, SPAG4 (normal) |
 |  |
| Top |
| TissGeneProg for ODF1 |
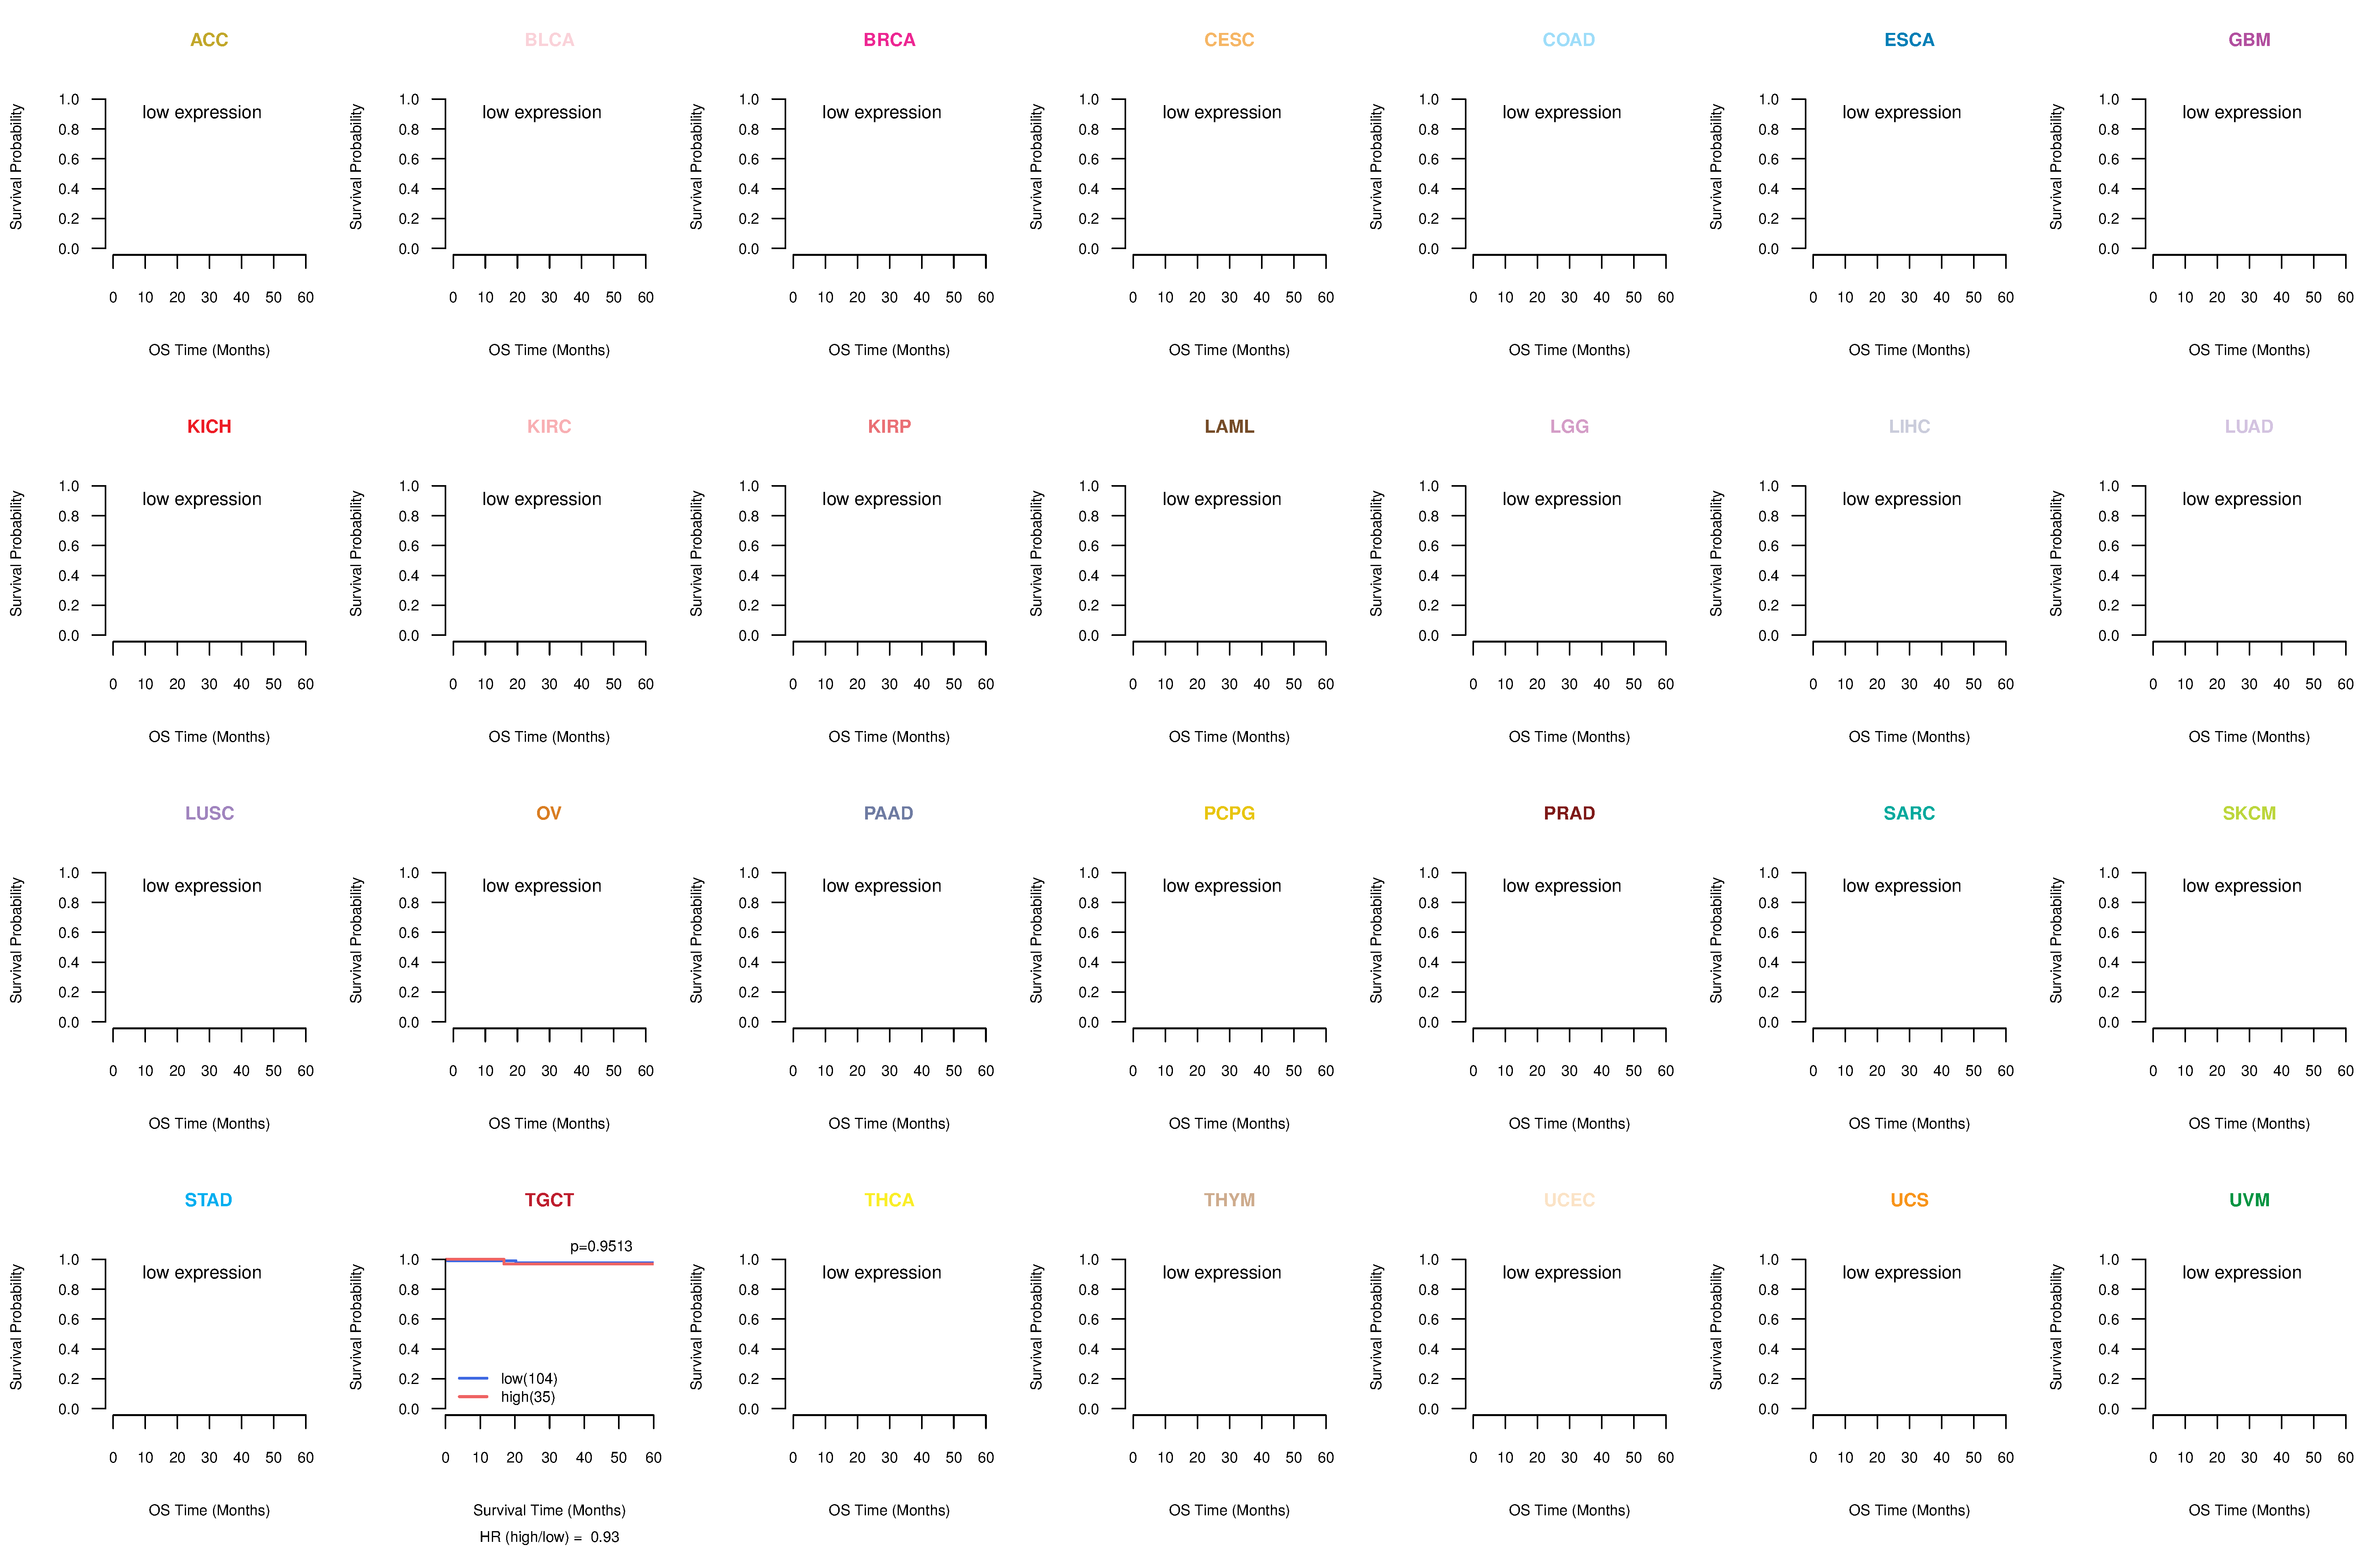
| Kaplan-Meier plots with logrank tests of overall survival (OS) using 28 cancer types (TCGA IlluminaHiSeq_RNASeqV2, pan-cancer normalized log2(norm_counts+1) data, version 2016-08-16) (TCGA clinicalMatrix, phenotype data, version 2016-04-27) * Click on the image to enlarge it in a new window. |
 |
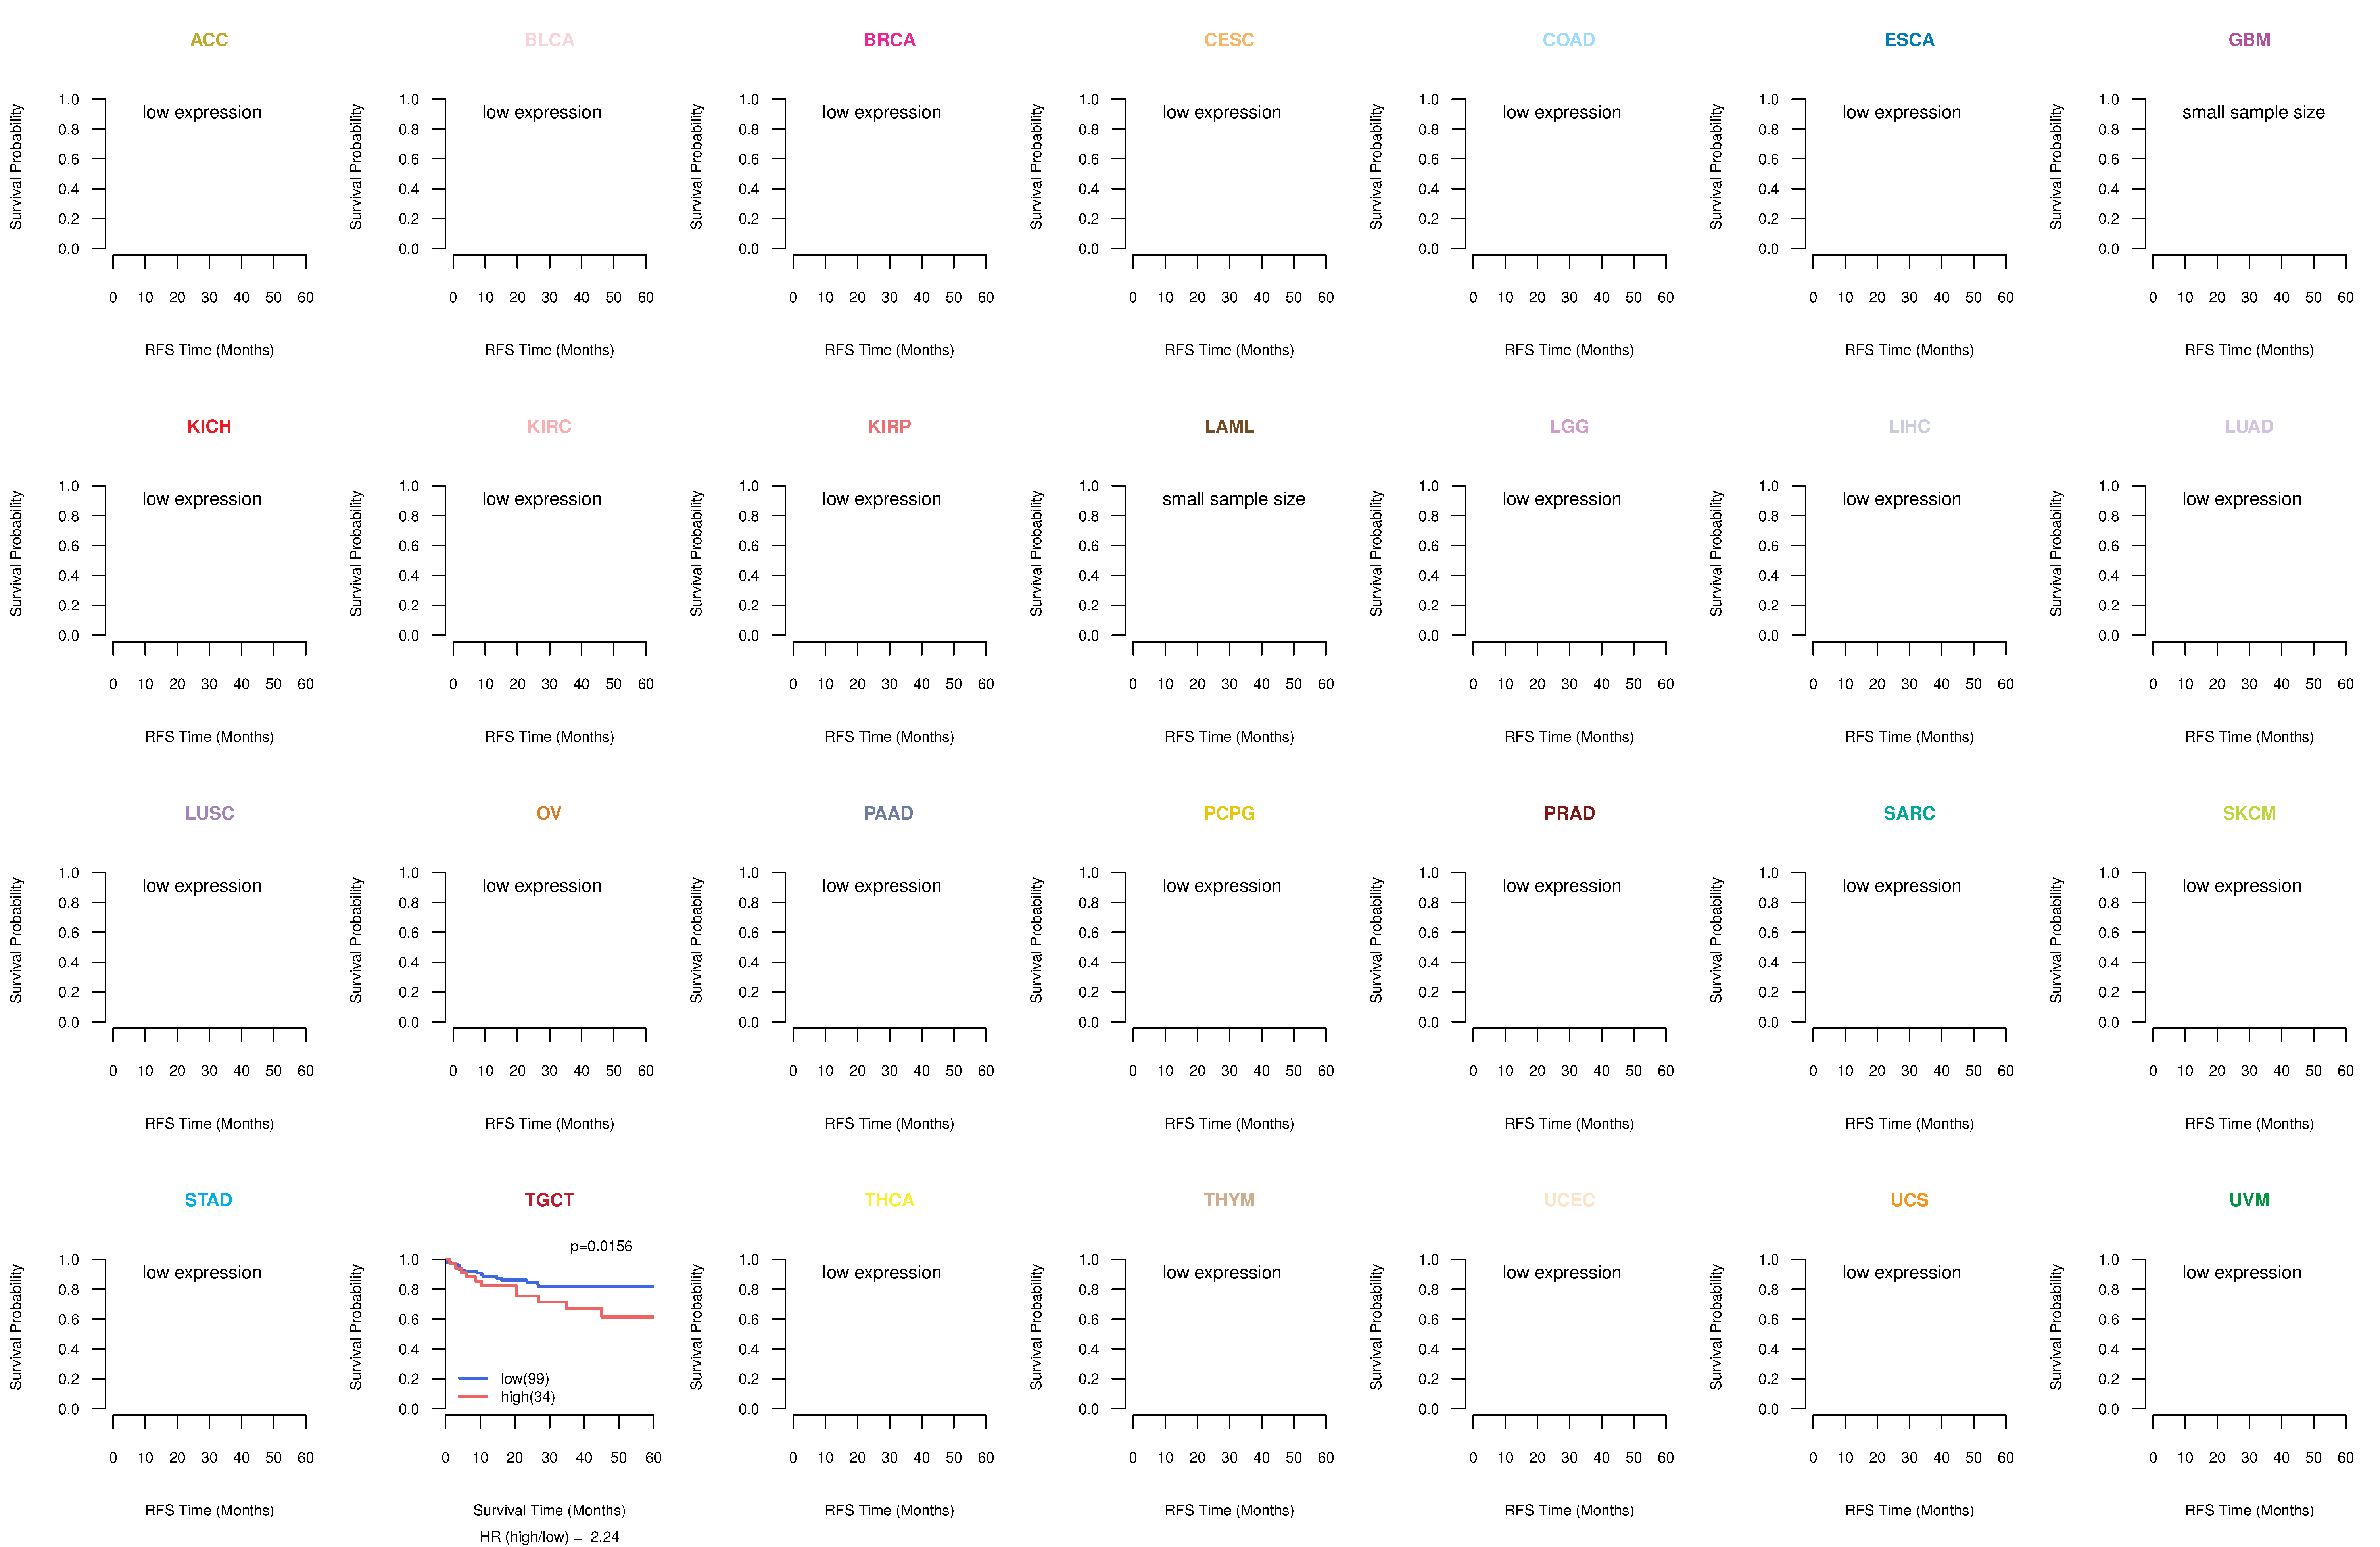
| Kaplan-Meier plots with logrank test of relapse free survival (RFS) using 28 cancer types (TCGA IlluminaHiSeq_RNASeqV2, pan-cancer normalized log2(norm_counts+1) data, version 2016-08-16) (TCGA clinicalMatrix, phenotype data, version 2016-04-27) * Click on the image enlarge it in a new window. |
 |
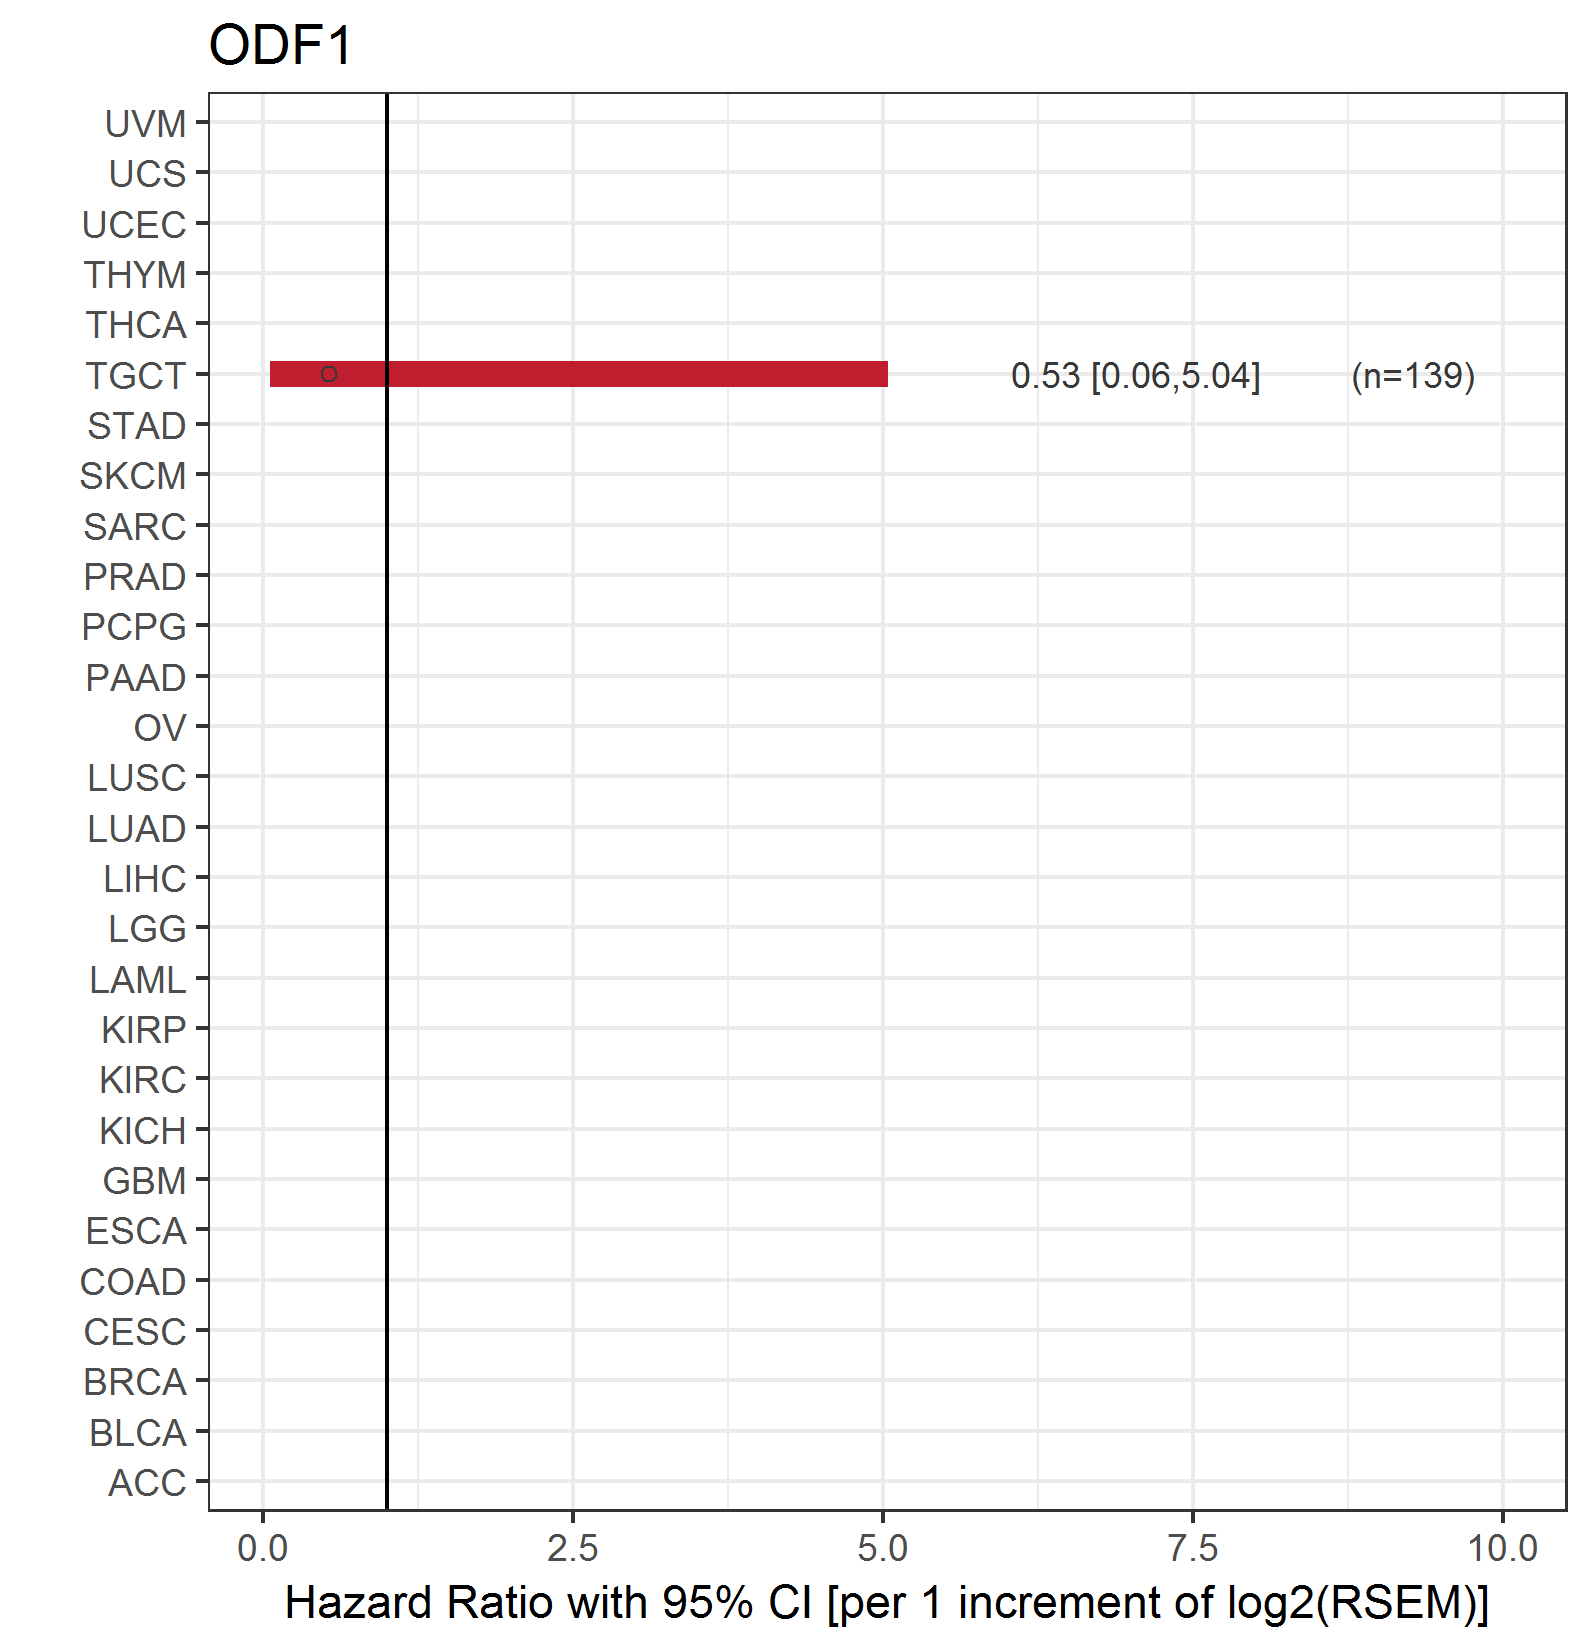
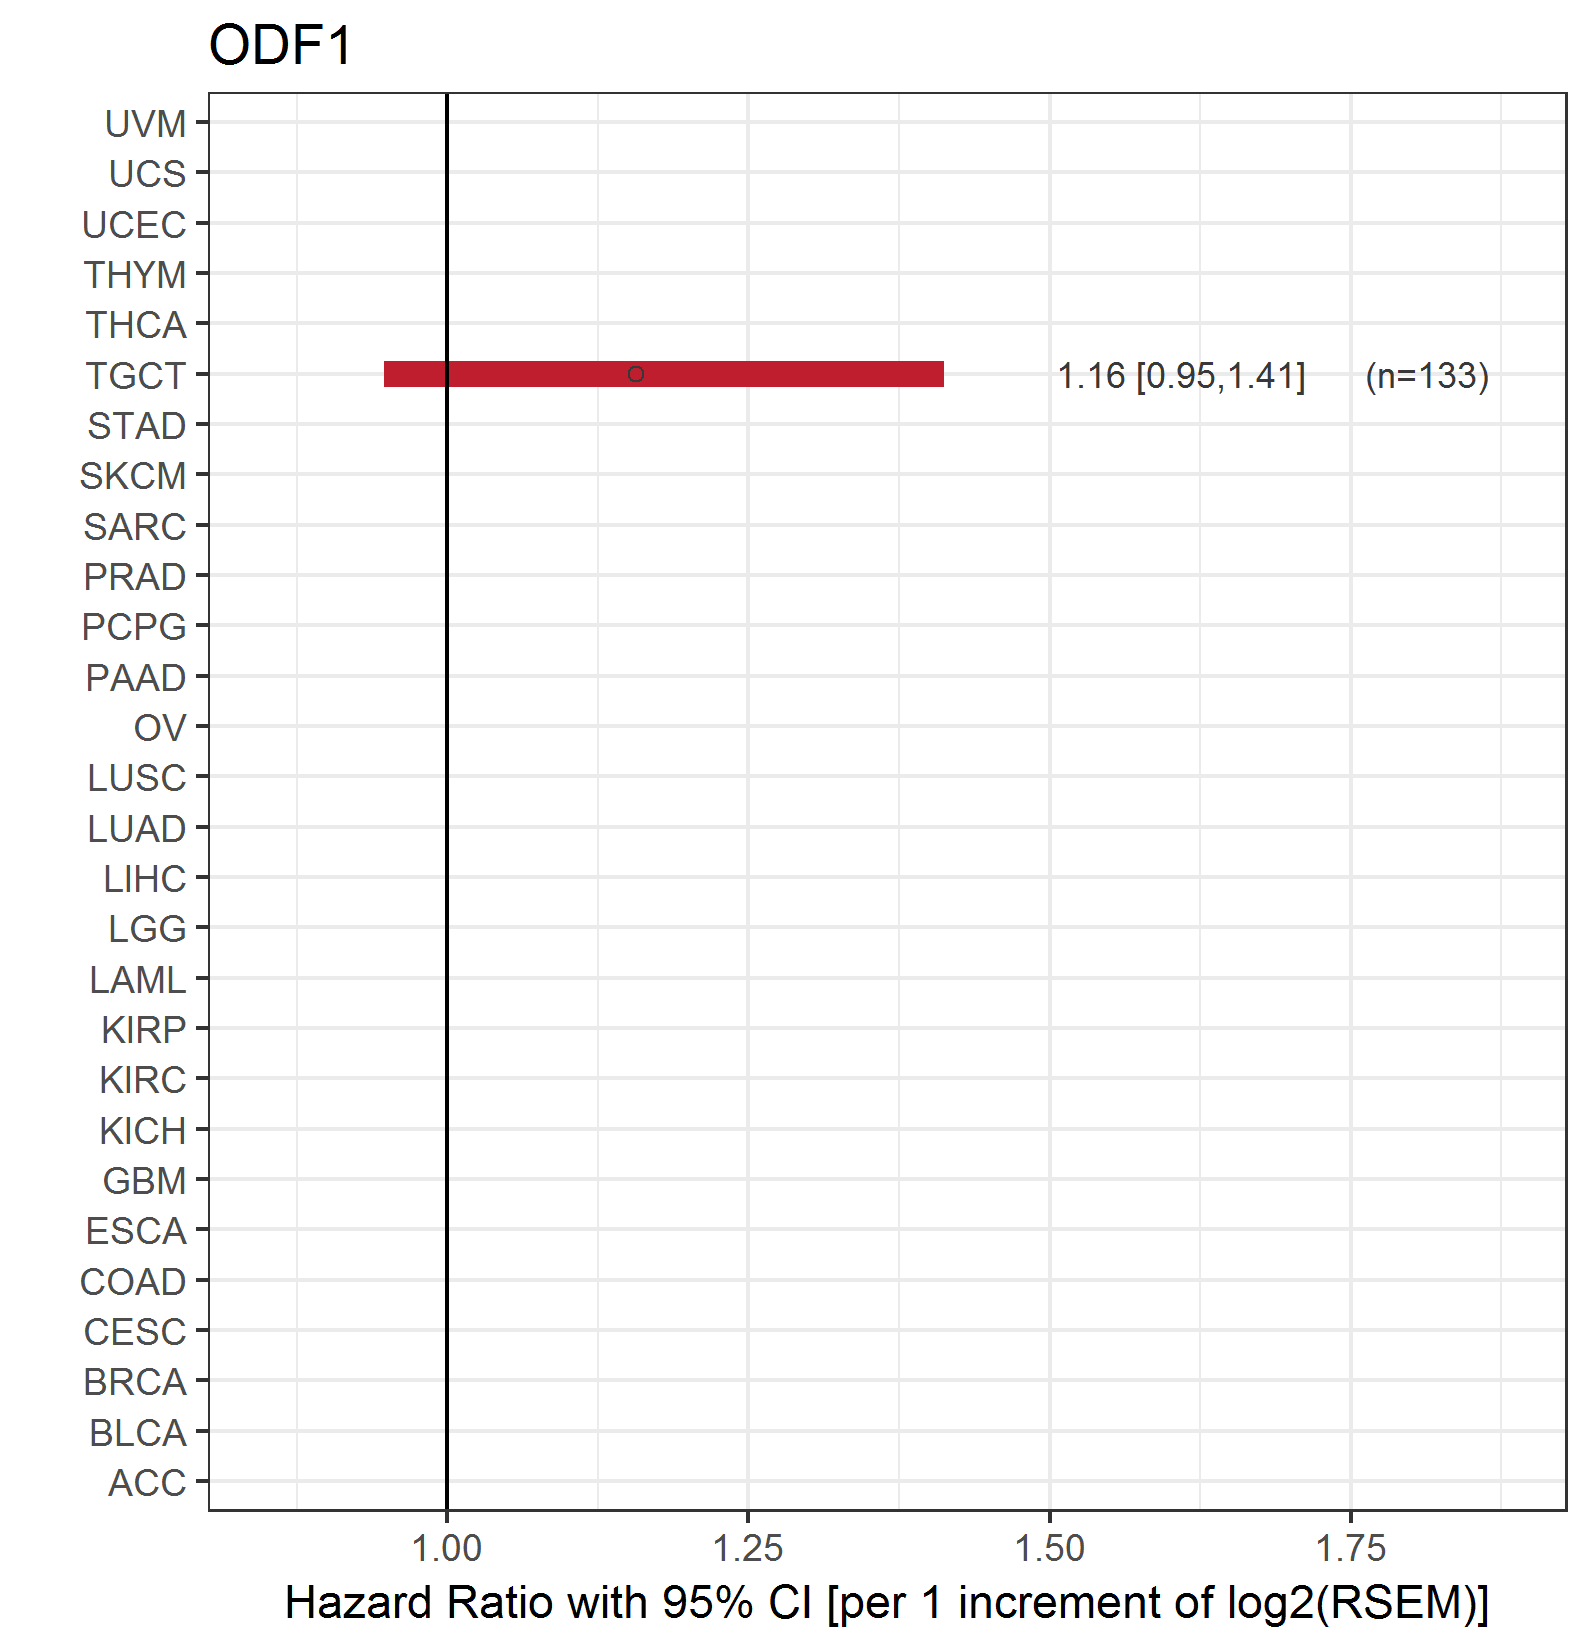
| Forest plot of Cox proportional hazard ratio (HR) and 95% CI of overall survival (OS) using 28 cancer types (TCGA IlluminaHiSeq_RNASeqV2, pan-cancer normalized log2(norm_counts+1) data, version 2016-08-16) (TCGA clinicalMatrix, phenotype data, version 2016-04-27) * Click on the image enlarge it in a new window. |
 |
| Forest plot of Cox proportional hazard ratio (HR) and 95% CI of relapse free survival (RFS) using 28 cancer types (TCGA IlluminaHiSeq_RNASeqV2, pan-cancer normalized log2(norm_counts+1) data, version 2016-08-16) (TCGA clinicalMatrix, phenotype data, version 2016-04-27) * Click on the image enlarge it in a new window. |
 |
| Top |
| TissGeneClin for ODF1 |
| TissGeneDrug for ODF1 |
| Drug information targeting TissGene (DrugBank Version 5.0.6, 2017-04-01) |
| DrugBank ID | Drug name | Drug activity | Drug type | Drug status |
| Top |
| TissGeneDisease for ODF1 |
| Disease information associated with TissGene (DisGeNet, 2016-06-01) |
| Disease ID | Disease name | # pubmeds | Source |
| umls:C0003873 | Rheumatoid Arthritis | 1 | BeFree |
| umls:C0011847 | Diabetes | 1 | BeFree |
| umls:C0011849 | Diabetes Mellitus | 1 | BeFree |
| umls:C0040336 | Tobacco Use Disorder | 1 | GAD |
| umls:C0206638 | Giant Cell Tumor of Bone | 1 | BeFree |
| umls:C0333307 | Superficial ulcer | 1 | BeFree |
|
Copyright 2016-Present - The University of Texas Health Science Center at Houston (UTHealth) Web File Viewing | How to Report, Fraud, Waste and Abuse | State of Texas | Statewide Search | Texas Homeland Security | Site Policies |