 |
| |
| |
| |
| |
| |
| |
|

| TissGeneSummary for SLC22A18AS |
 Gene summary Gene summary |
| Basic gene information | Gene symbol | SLC22A18AS |
| Gene name | solute carrier family 22 (organic cation transporter), member 18 antisense | |
| Synonyms | BWR1B|BWSCR1B|ORCTL2S|SLC22A1LS|p27-BWR1B | |
| Cytomap | UCSC genome browser: 11p15.5 | |
| Type of gene | protein-coding | |
| RefGenes | NM_001302862.1, NM_007105.3, | |
| Description | Beckwith-Wiedemann region 1BBeckwith-Wiedemann syndrome chromosome region 1, candidate bbeckwith-Wiedemann syndrome chromosomal region 1 candidate gene B proteinorganic cation transporter-like 2 antisenseorganic cation transporter-like protein 2 antis | |
| Modification date | 20141207 | |
| dbXrefs | MIM : 603240 | |
| HGNC : HGNC | ||
| Ensembl : ENSG00000254827 | ||
| HPRD : 09127 | ||
| Protein | UniProt: go to UniProt's Cross Reference DB Table | |
| Expression | CleanEX: HS_SLC22A18AS | |
| BioGPS: 5003 | ||
| Pathway | NCI Pathway Interaction Database: SLC22A18AS | |
| KEGG: SLC22A18AS | ||
| REACTOME: SLC22A18AS | ||
| Pathway Commons: SLC22A18AS | ||
| Context | iHOP: SLC22A18AS | |
| ligand binding site mutation search in PubMed: SLC22A18AS | ||
| UCL Cancer Institute: SLC22A18AS | ||
| Assigned class in TissGDB* | C | |
| Included tissue-specific gene expression resources | TiGER,GTEx | |
| Specific-tissues in normal samples (assigned by TissGDB using HPA, TiGER, and GTEx) | Colon | |
| Cancer types related to the specific-tissues in cancer samples (assigned by TissGDB using TCGA) | COAD | |
| Reference showing the relevant tissue of SLC22A18AS | ||
| Description by TissGene annotations | ||
| * Class A consists of genes with literature evidence and is part of the cTissGenes. Class B consists of only cTissGenes without additional evidence. The remaining genes belong to Class C. |
| Gene ontology having evidence of Inferred from Direct Assay (IDA) from Entrez |
| GO ID | GO term | PubMed ID |
| Top |
| TissGeneExp for SLC22A18AS |
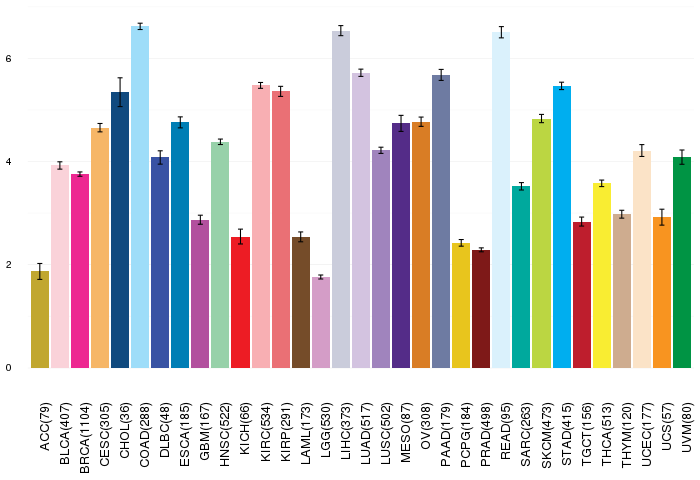
| Gene expressions across 28 cancer types (X-axis: cancer type and Y-axis: log2(norm_counts+1)) (TCGA IlluminaHiSeq_RNASeqV2, pan-cancer normalized log2(norm_counts+1) data, version 2016-08-16) |
 |
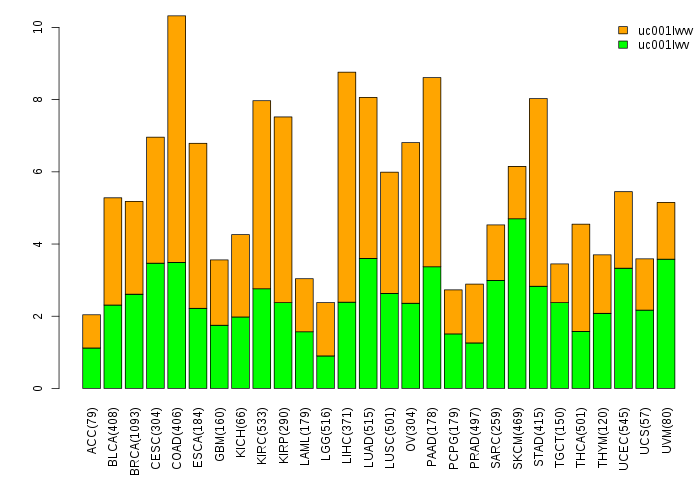
| Gene isoform expressions across 28 cancer types (X-axis: cancer type and Y-axis: log2(norm_counts+1)) (TCGA pan-cancer tcga_rsem_isoform_tpm, version 2016-09-01) |
 |
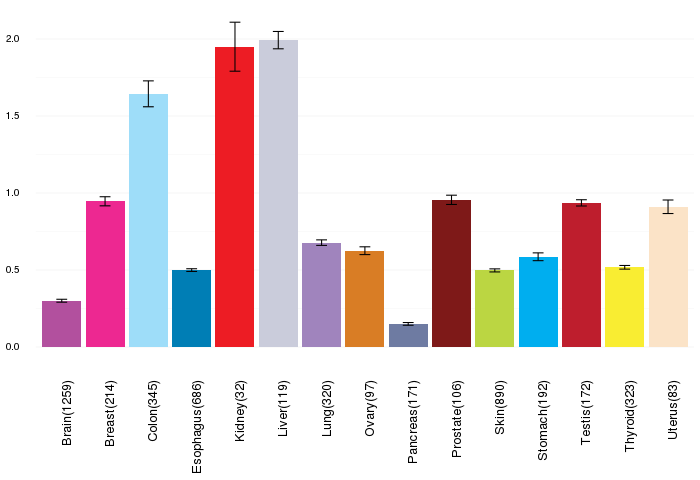
| Gene expressions across normal tissues of GTEx data (GTEx GTEx_Analysis_v6_RNA-seq_RNA-SeQCv1.1.8_gene_rpkm.gct) - Here, we shows the matched tissue types only among our 28 cancer types. |
 |
| Different expressions across 14 cancer types with more than 10 samples between matched tumors and normals (X-axis: cancer type and Y-axis: log2(norm_counts+1)) (TCGA IlluminaHiSeq_RNASeqV2, pan-cancer normalized log2(norm_counts+1) data, version 2016-08-16) |
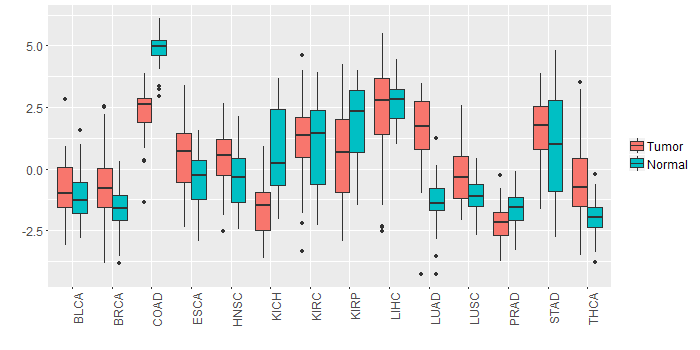 |
| - Significantly differentially expressed cancer types and information. (|Fold change|>1 and FDR<0.05) |
| Cancer type | Mean(exp) in tumor | Mean(exp) in matched normal | Log2FC | P-val. | FDR |
| THCA | -0.520043793 | -1.934486166 | 1.414442373 | 1.59E-09 | 8.93E-09 |
| LUAD | 1.457995132 | -1.333870386 | 2.791865517 | 3.15E-21 | 7.52E-20 |
| COAD | 2.198287041 | 4.849790887 | -2.651503846 | 1.68E-12 | 3.96E-11 |
| KICH | -1.54724542 | 0.73567858 | -2.282924 | 3.43E-06 | 1.17E-05 |
| KIRP | 0.68766108 | 1.76742358 | -1.0797625 | 0.0217 | 0.043672711 |
| Top |
| TissGene-miRNA for SLC22A18AS |
| Significantly anti-correlated miRNAs of TissGene across 28 cancer types (Gene-miRNA relations from TargetScanHuman Relsease 7.1, Conserved_Site_Context_Scores.txt.zip, 06.01.2016) (TCGA IlluminaHiSeq_miRNASeq, log2(RPM+1) data, version 2016-11-21) (TCGA IlluminaHiSeq_RNASeqV2, log2(normalized_count+1) data, version 2016-08-16) (Spearman’s Rank Correlation (p-value<0.05 and coefficient<-0.25)) |
| Cancer type | miRNA id | miRNA accession | P-val. | Coeff. | # samples |
| Top |
| TissGeneMut for SLC22A18AS |
| TissGeneSNV for SLC22A18AS |
| nsSNV counts per each loci. Different colors of circles represent different cancer types. Circle size denotes number of samples. (TCGA somatic mutation (SNPs and small INDELs) data, version 2016-04-25) * Click on the image to enlarge it in a new window. |
 |
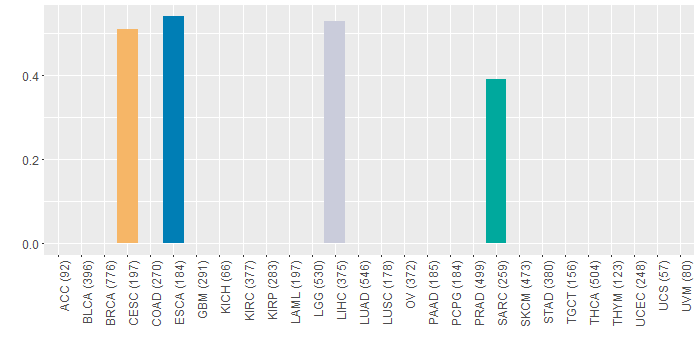
| Somatic nucleotide variants of TissGene across 28 cancer types (X-axis: cancer type and Y-axis: % of mutated samples) The numbers in parentheses are numbers of samples with mutation (nsSNVs). (TCGA somatic mutation (SNPs and small INDELs) data, version 2016-04-25) |
 |
| - nsSNVs sorted by frequency. |
| AAchange | Cancer type | # samples |
| p.R36S | LIHC | 1 |
| p.R105W | CESC | 1 |
| p.P222L | DLBC | 1 |
| p.F229L | SARC | 1 |
| p.A122T | ESCA | 1 |
| p.G74A | LIHC | 1 |
| p.T200I | DLBC | 1 |
| Top |
| TissGeneCNV for SLC22A18AS |
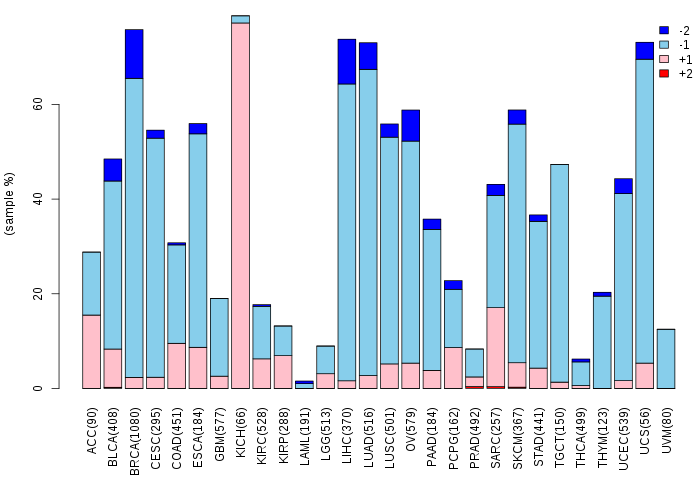
| Copy number variations of TissGene across 28 cancer types (X-axis: cancer type and Y-axis: % of CNV samples) (TCGA Gistic2_CopyNumber_Gistic2_all_data_by_genes, Gistic2 copy number data, version 2016-08-16) |
 |
| Top |
| TissGeneFusions for SLC22A18AS |
| Fusion genes including TissGene (ChimerDB 3.0, 2016-12-01 and TCGA fusion Portal 2015-12-01) |
| Database | Src | Cancer type | Sample | Fusion gene | ORF | 5'-gene BP | 3'-gene BP |
| Chimerdb3.0 | FusionScan | ESCA | TCGA-L5-A4OF-01A | CARS-SLC22A18AS | Out-of-Frame | chr11:3028108 | chr11:2909865 |
| Top |
| TissGeneNet for SLC22A18AS |
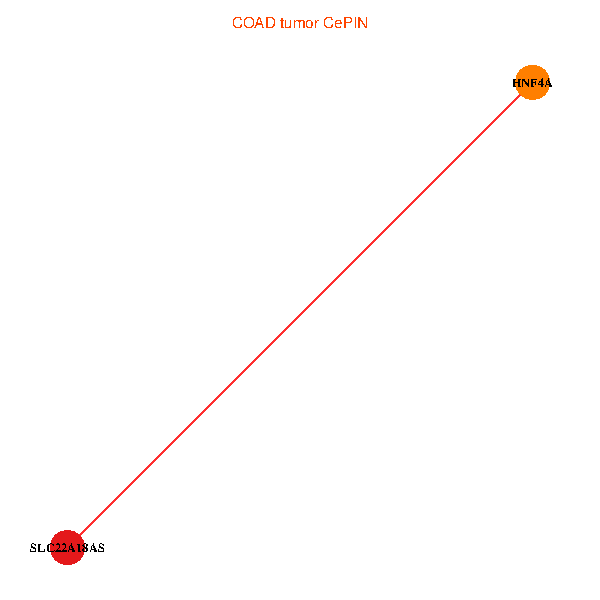
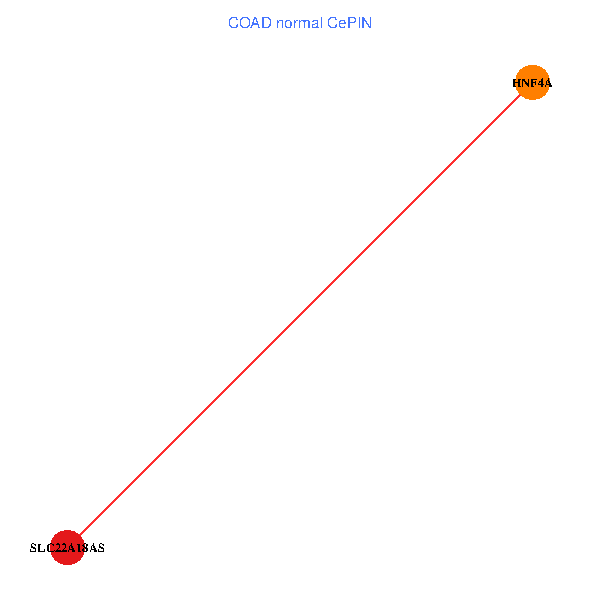
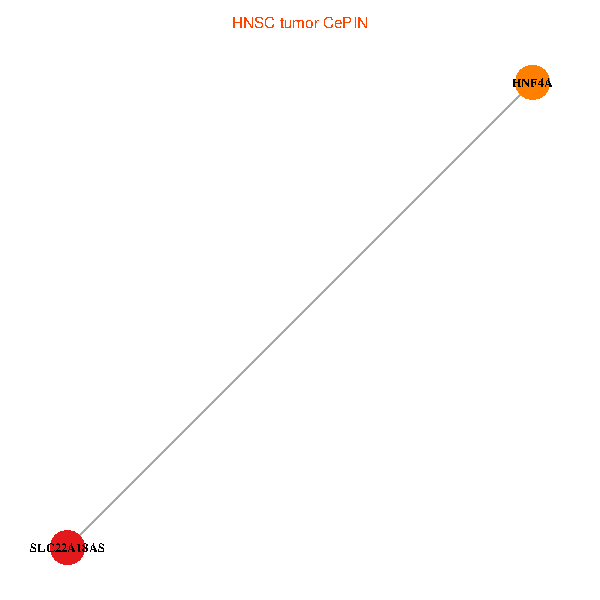
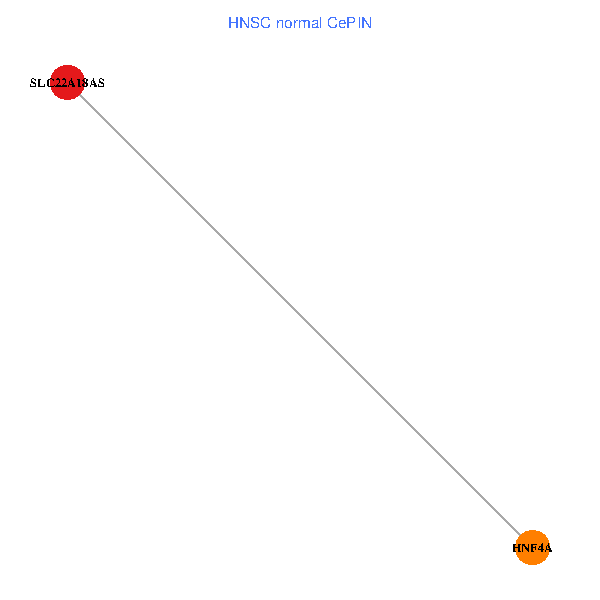
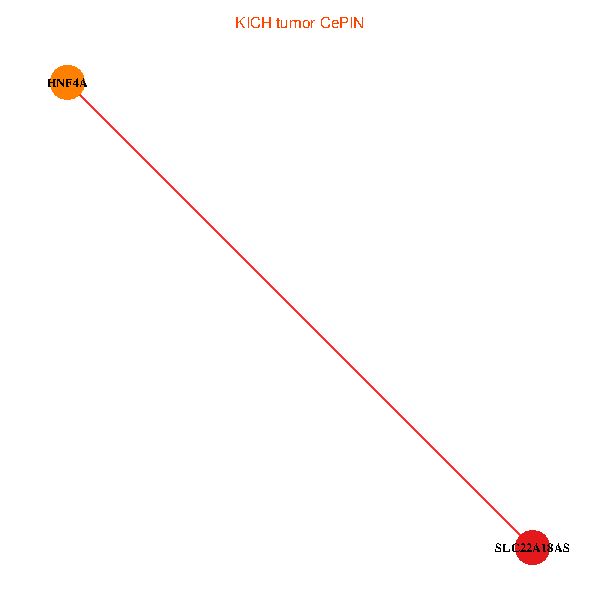
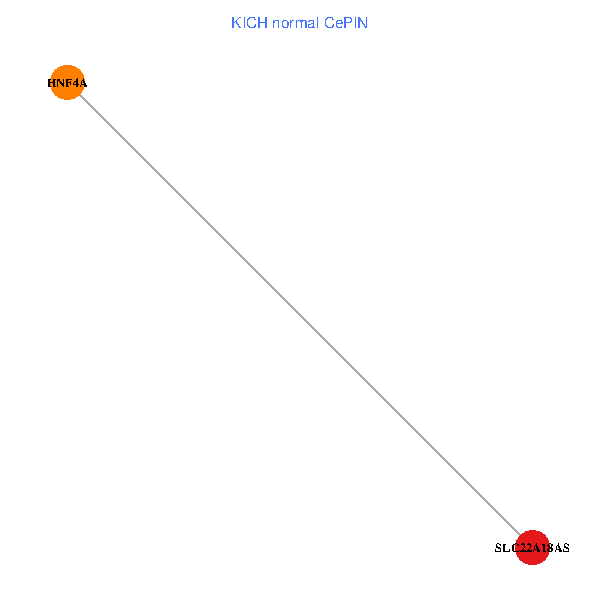
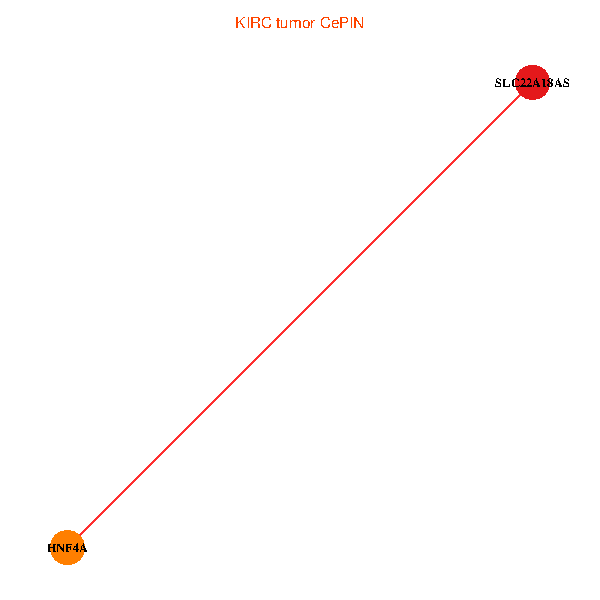
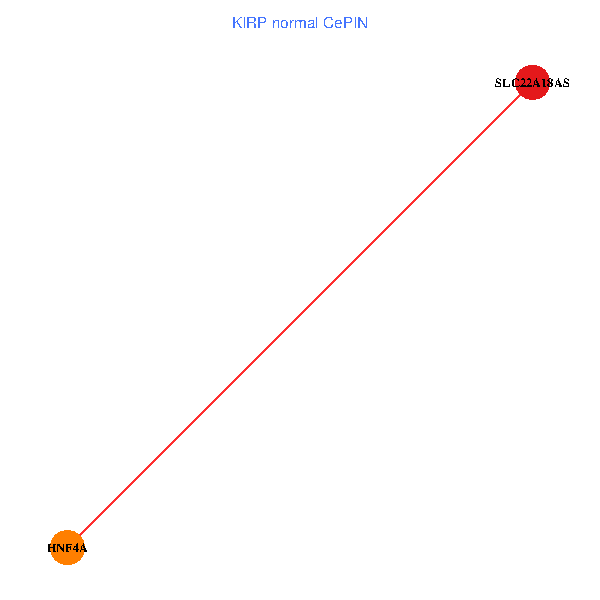
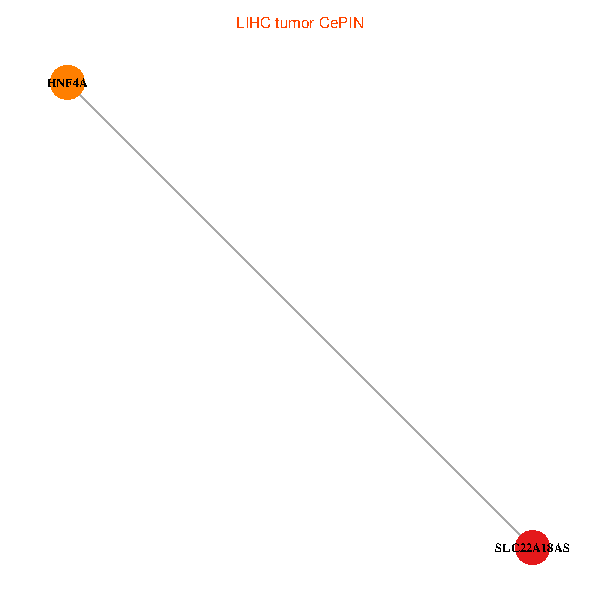
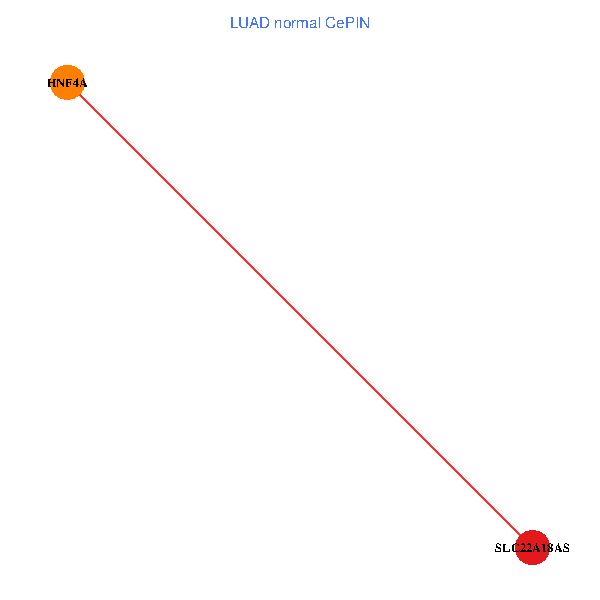
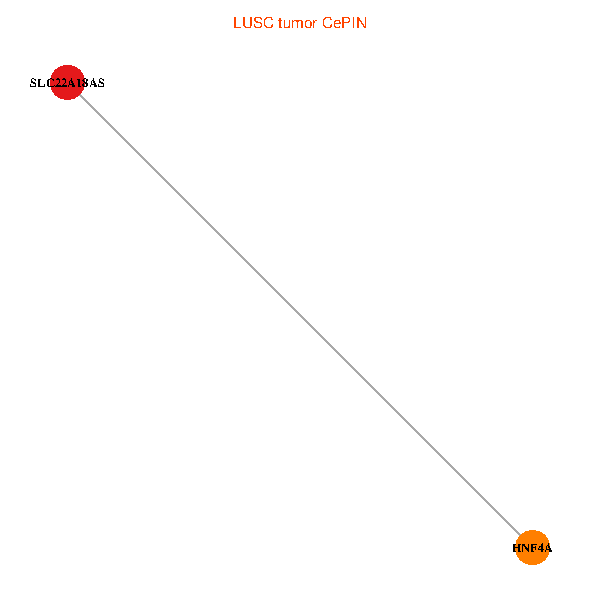
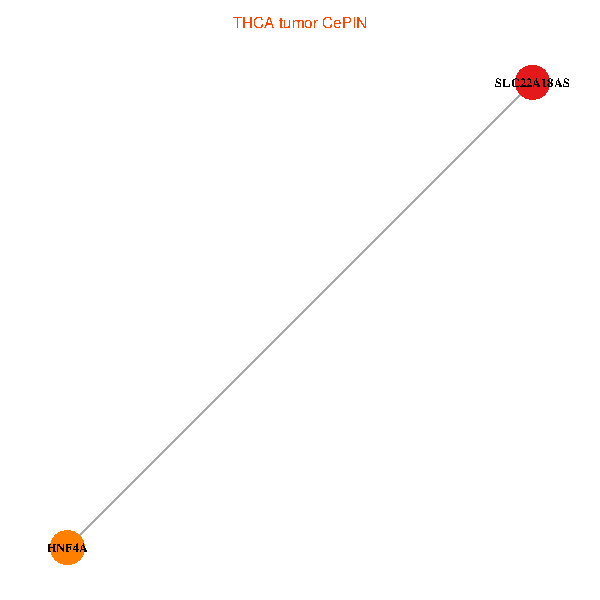
| Co-expressed gene networks based on protein-protein interaction data (CePIN) (TCGA IlluminaHiSeq_RNASeqV2, pan-cancer normalized log2(norm_counts+1) data, version 2016-08-16) (PINA2 ppi data) |
| BRCA (tumor) | BRCA (normal) |
| SLC22A18AS, HNF4A (tumor) | SLC22A18AS, HNF4A (normal) |
 |  |
| COAD (tumor) | COAD (normal) |
| SLC22A18AS, HNF4A (tumor) | SLC22A18AS, HNF4A (normal) |
 |  |
| HNSC (tumor) | HNSC (normal) |
| SLC22A18AS, HNF4A (tumor) | SLC22A18AS, HNF4A (normal) |
 |  |
| KICH (tumor) | KICH (normal) |
| SLC22A18AS, HNF4A (tumor) | SLC22A18AS, HNF4A (normal) |
 |  |
| KIRC (tumor) | KIRC (normal) |
| SLC22A18AS, HNF4A (tumor) | SLC22A18AS, HNF4A (normal) |
 |  |
| KIRP (tumor) | KIRP (normal) |
| SLC22A18AS, HNF4A (tumor) | SLC22A18AS, HNF4A (normal) |
 |  |
| LIHC (tumor) | LIHC (normal) |
| SLC22A18AS, HNF4A (tumor) | SLC22A18AS, HNF4A (normal) |
 |  |
| LUAD (tumor) | LUAD (normal) |
| SLC22A18AS, HNF4A (tumor) | SLC22A18AS, HNF4A (normal) |
 |  |
| LUSC (tumor) | LUSC (normal) |
| SLC22A18AS, HNF4A (tumor) | SLC22A18AS, HNF4A (normal) |
 |  |
| PRAD (tumor) | PRAD (normal) |
| SLC22A18AS, HNF4A (tumor) | SLC22A18AS, HNF4A (normal) |
 |  |
| STAD (tumor) | STAD (normal) |
| SLC22A18AS, HNF4A (tumor) | SLC22A18AS, HNF4A (normal) |
 |  |
| THCA (tumor) | THCA (normal) |
| SLC22A18AS, HNF4A (tumor) | SLC22A18AS, HNF4A (normal) |
 |  |
| Top |
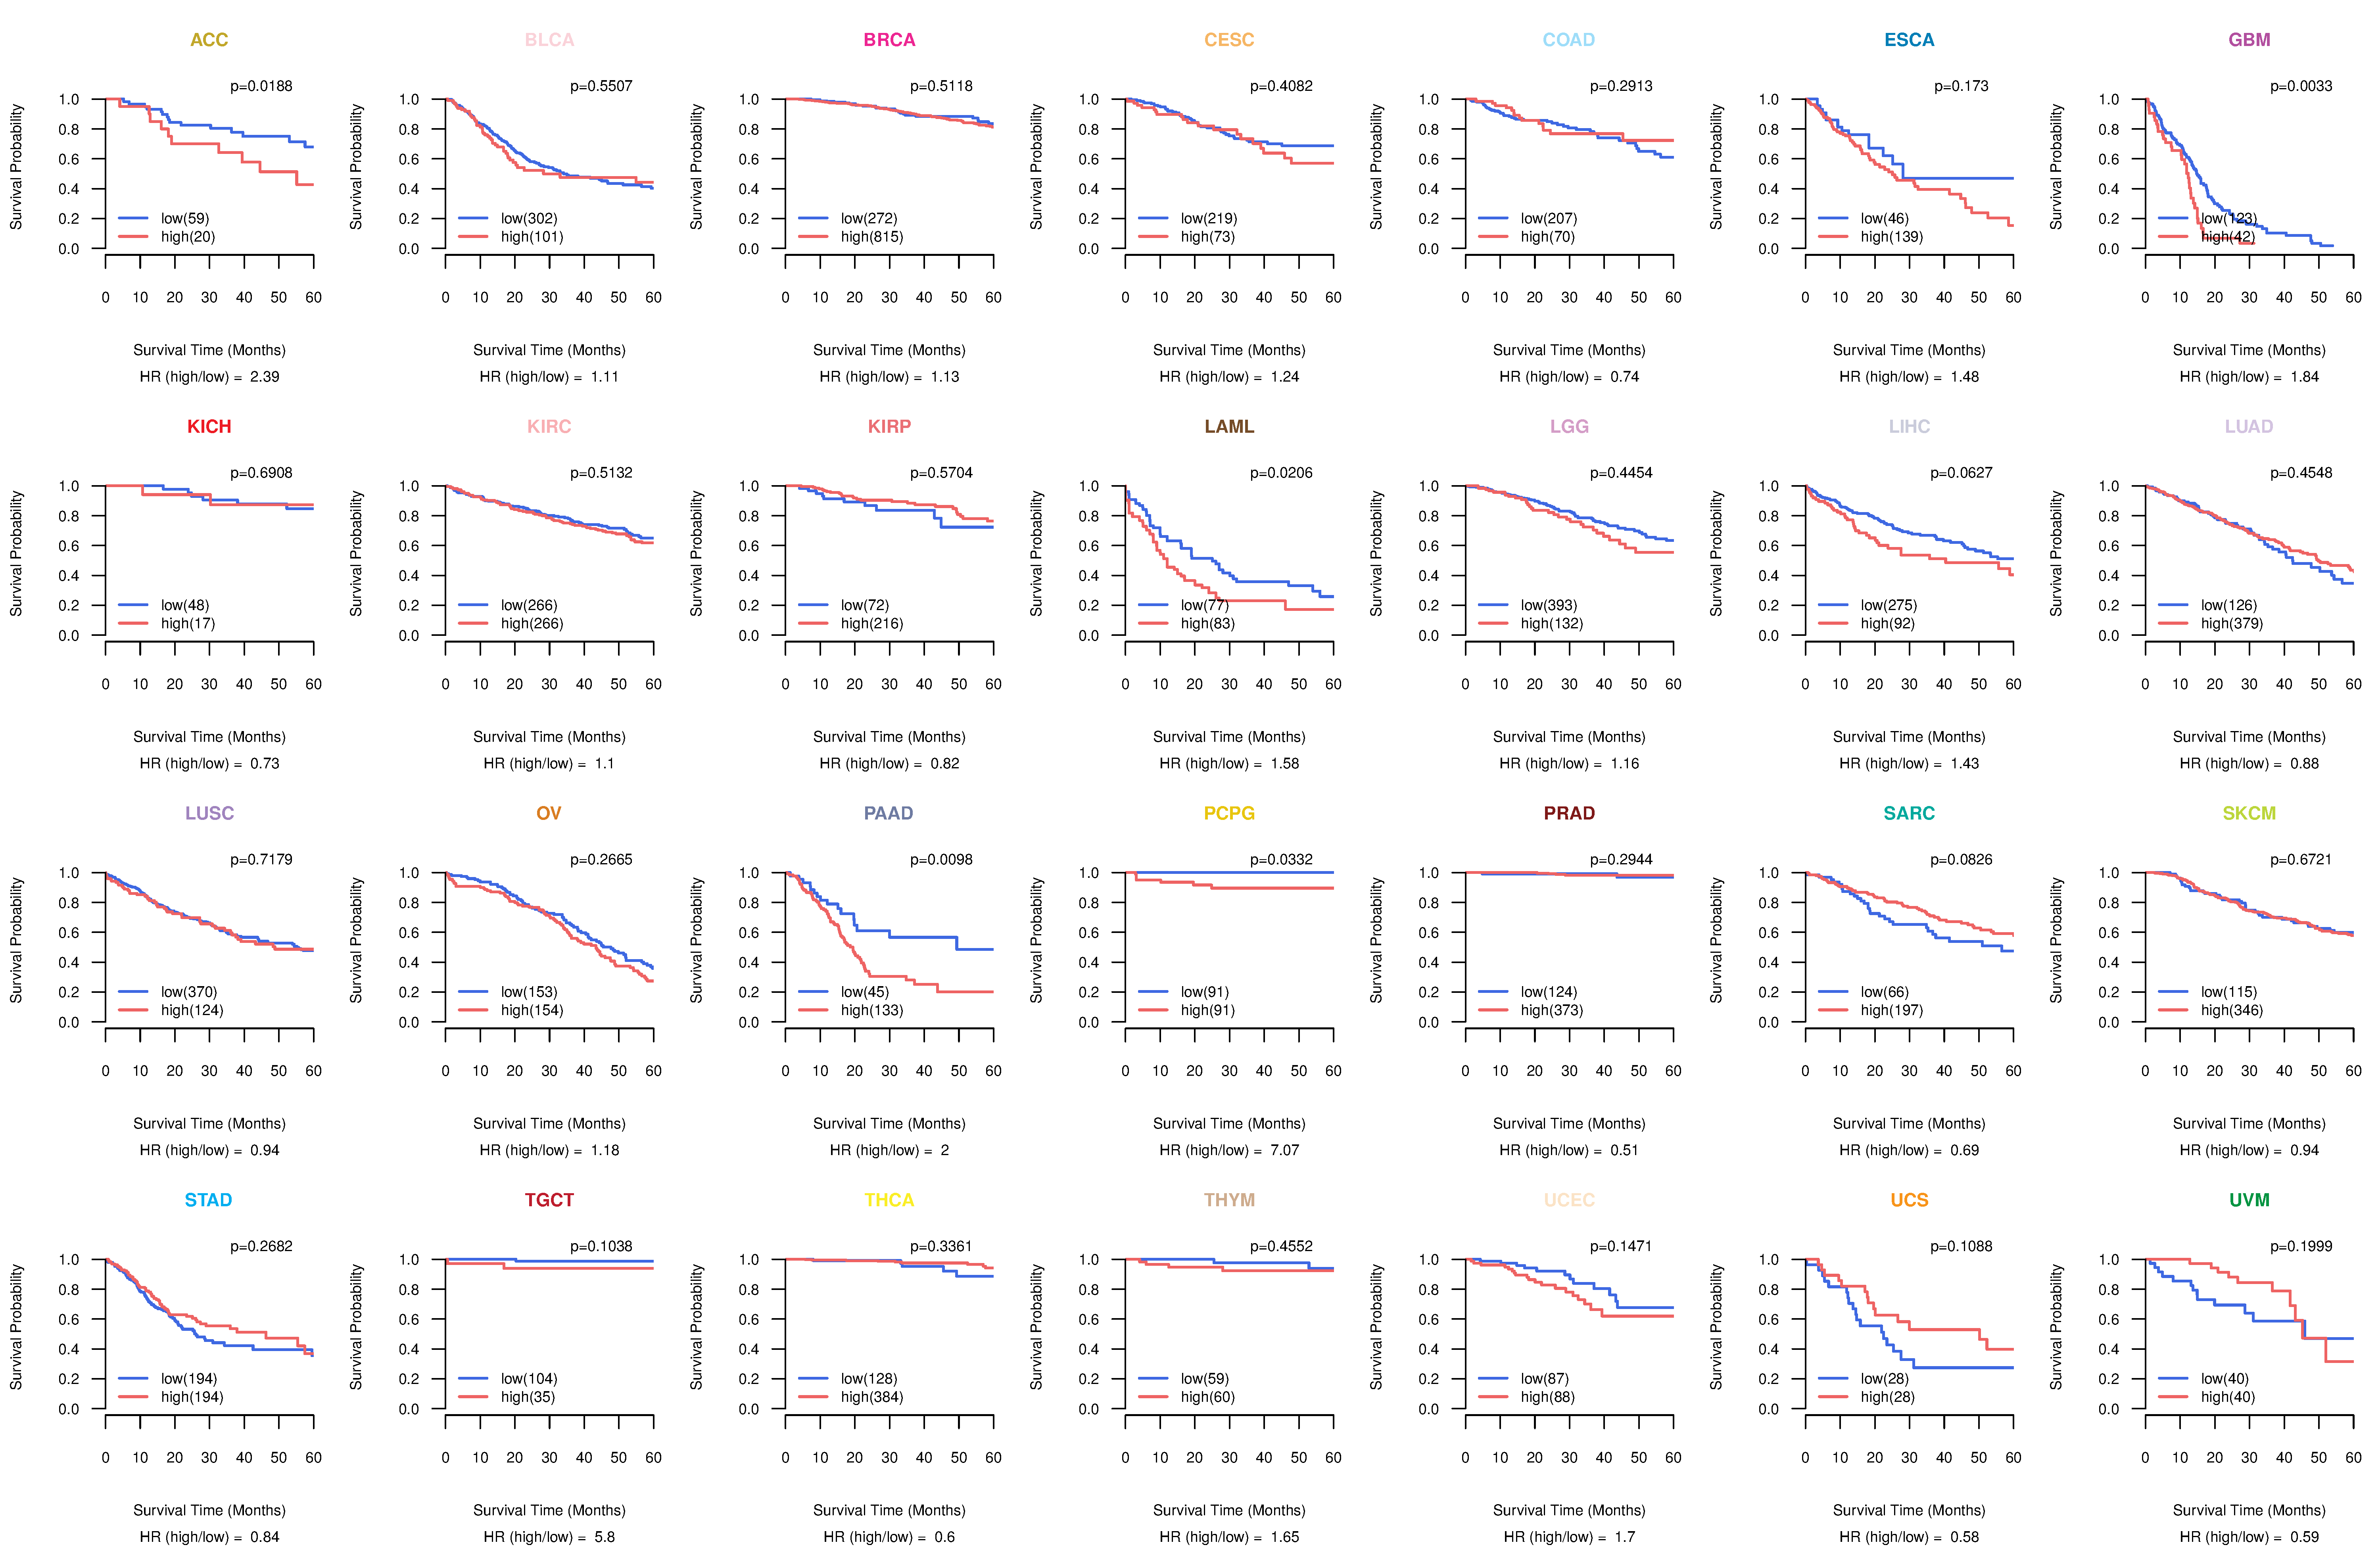
| TissGeneProg for SLC22A18AS |
| Kaplan-Meier plots with logrank tests of overall survival (OS) using 28 cancer types (TCGA IlluminaHiSeq_RNASeqV2, pan-cancer normalized log2(norm_counts+1) data, version 2016-08-16) (TCGA clinicalMatrix, phenotype data, version 2016-04-27) * Click on the image to enlarge it in a new window. |
 |
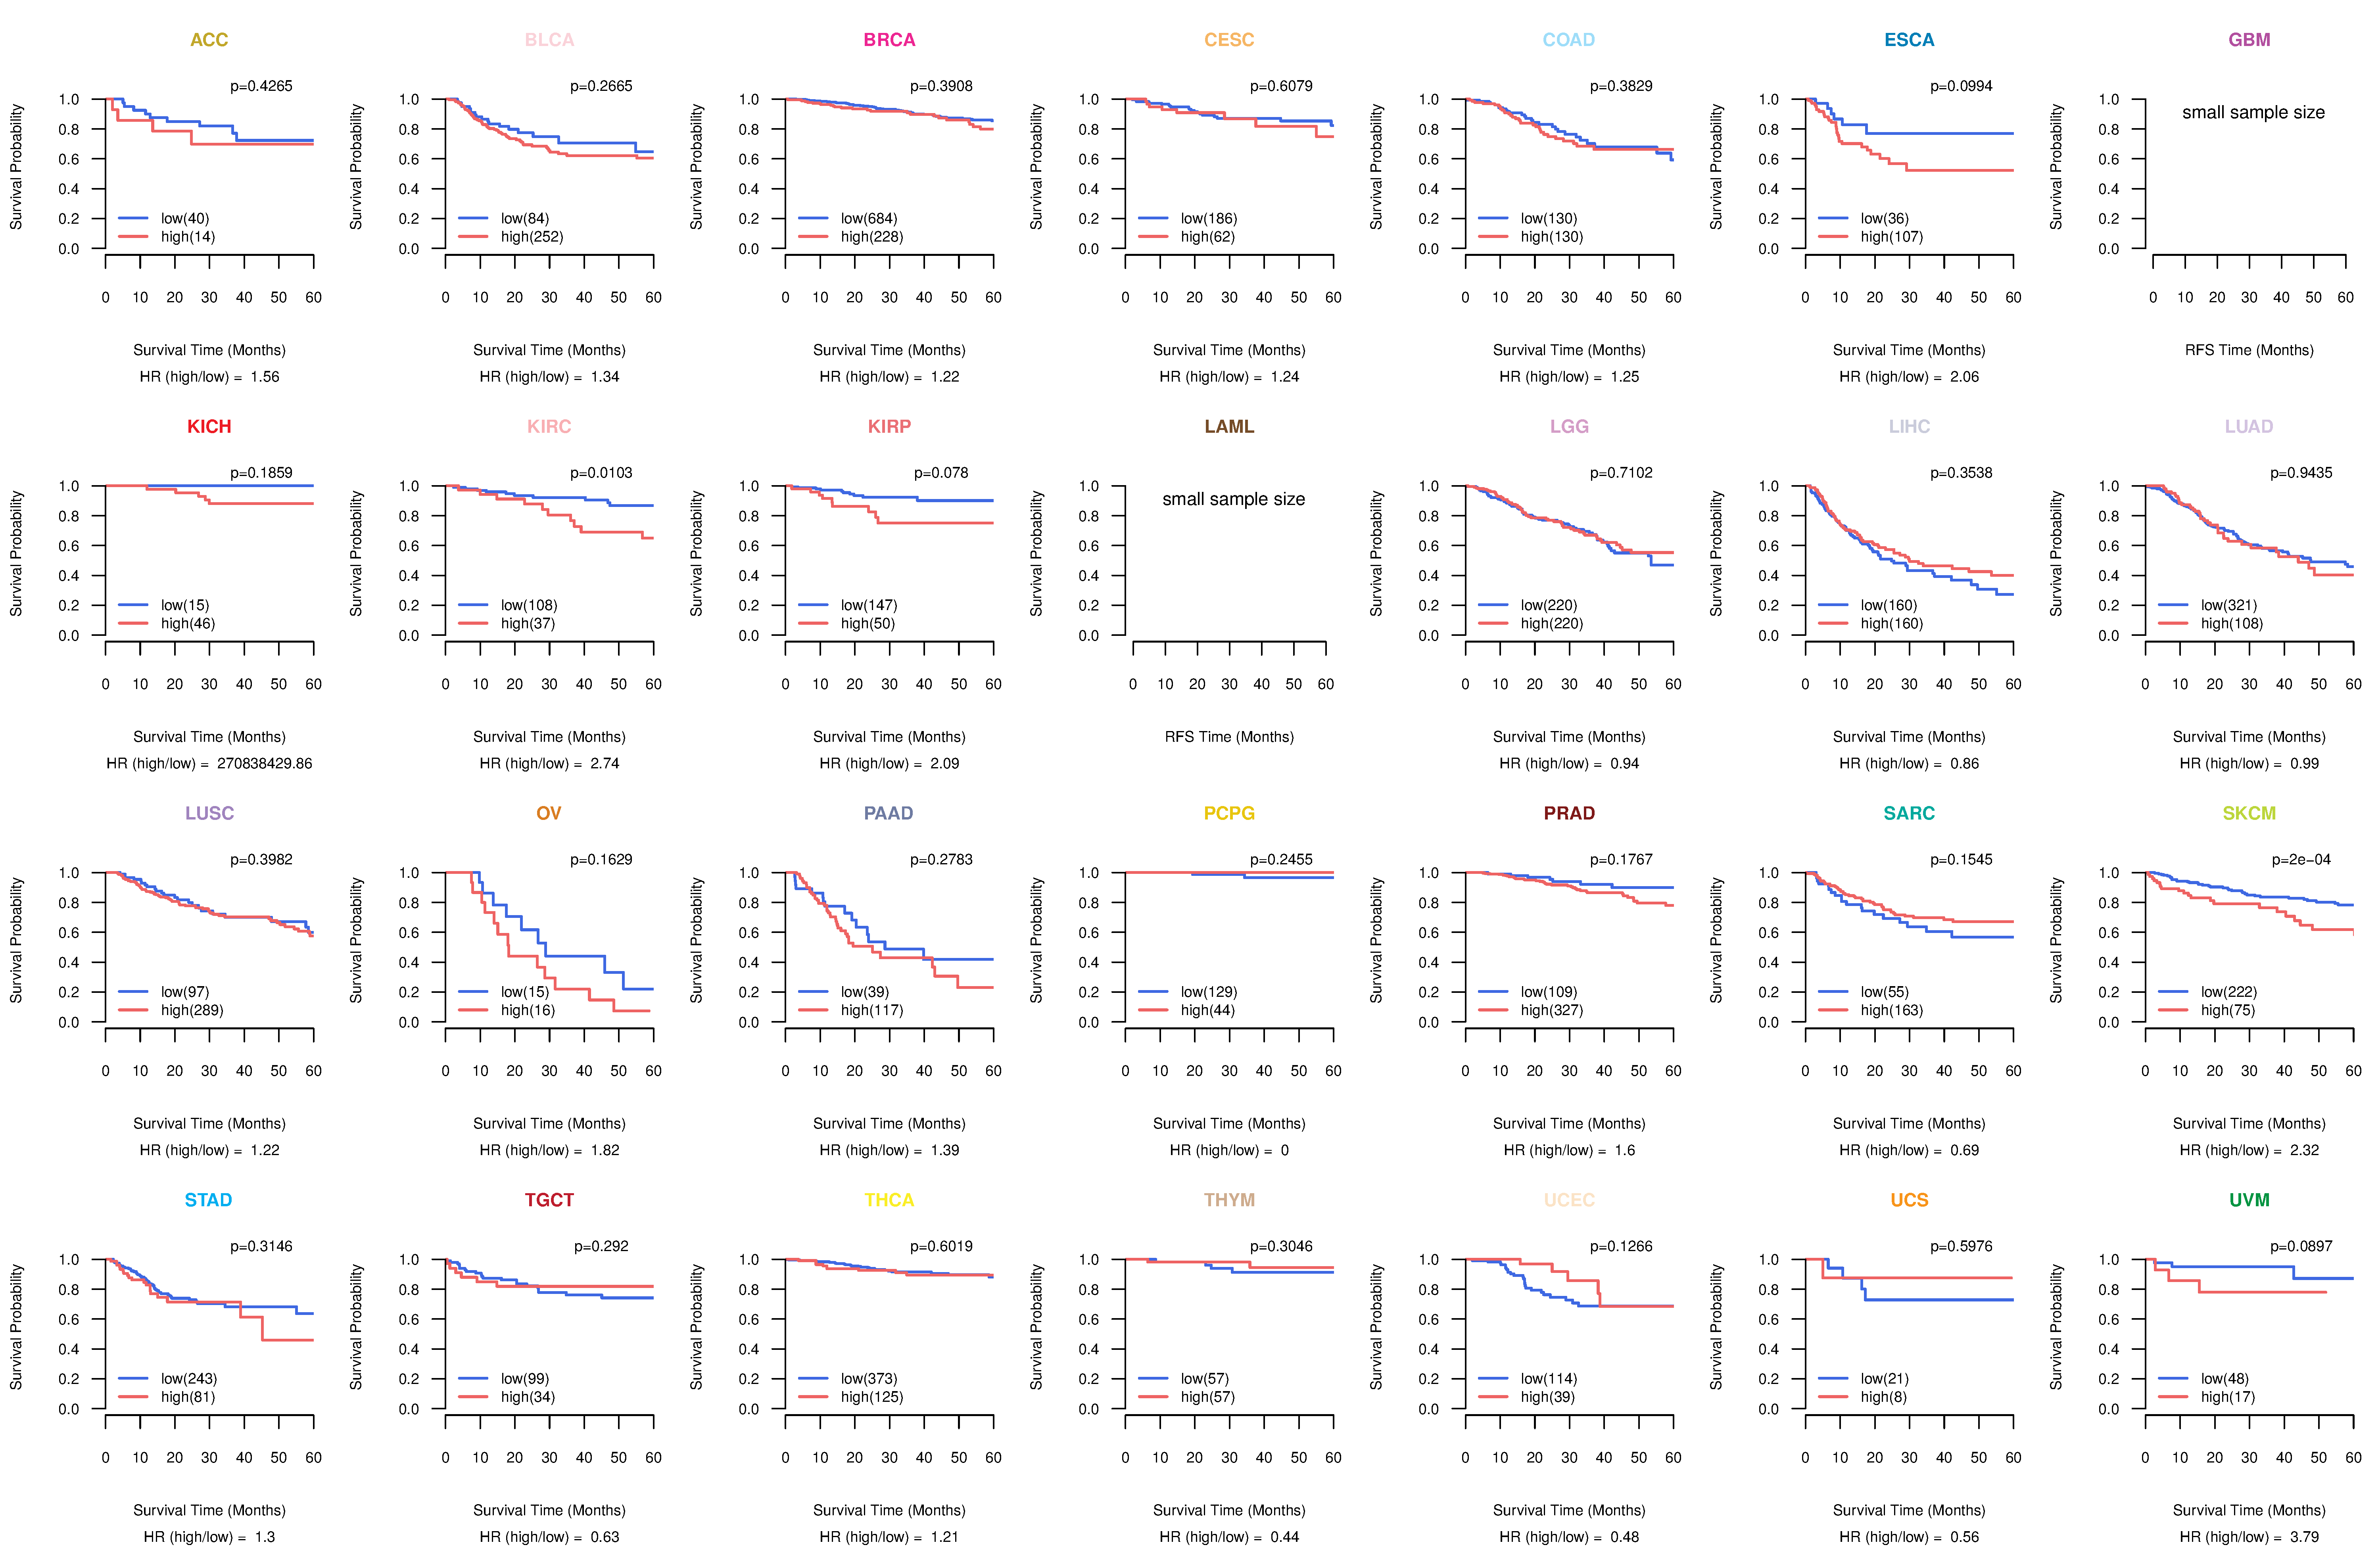
| Kaplan-Meier plots with logrank test of relapse free survival (RFS) using 28 cancer types (TCGA IlluminaHiSeq_RNASeqV2, pan-cancer normalized log2(norm_counts+1) data, version 2016-08-16) (TCGA clinicalMatrix, phenotype data, version 2016-04-27) * Click on the image enlarge it in a new window. |
 |
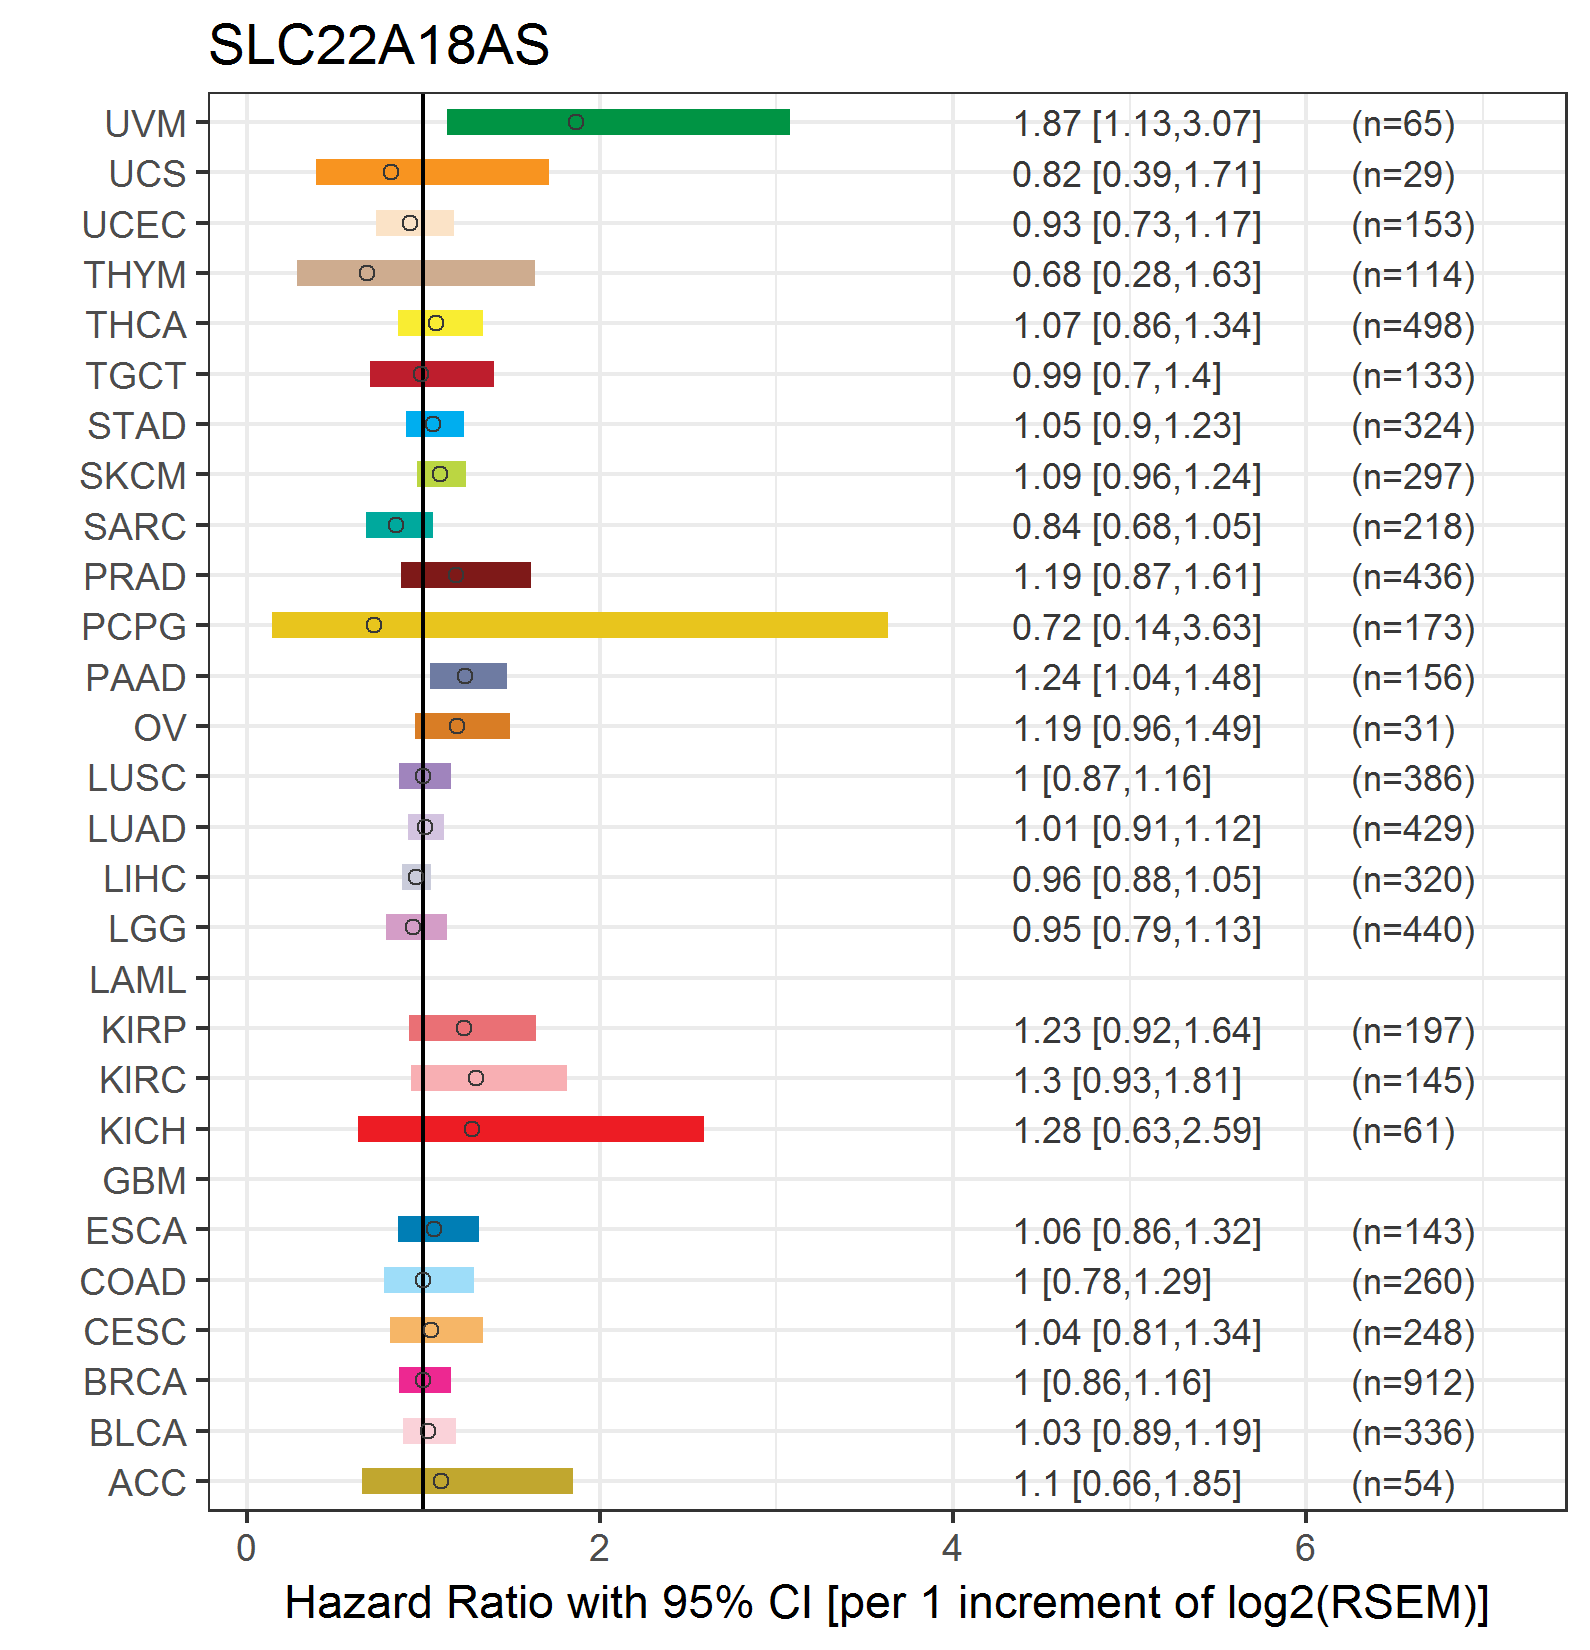
| Forest plot of Cox proportional hazard ratio (HR) and 95% CI of overall survival (OS) using 28 cancer types (TCGA IlluminaHiSeq_RNASeqV2, pan-cancer normalized log2(norm_counts+1) data, version 2016-08-16) (TCGA clinicalMatrix, phenotype data, version 2016-04-27) * Click on the image enlarge it in a new window. |
 |
| Forest plot of Cox proportional hazard ratio (HR) and 95% CI of relapse free survival (RFS) using 28 cancer types (TCGA IlluminaHiSeq_RNASeqV2, pan-cancer normalized log2(norm_counts+1) data, version 2016-08-16) (TCGA clinicalMatrix, phenotype data, version 2016-04-27) * Click on the image enlarge it in a new window. |
 |
| Top |
| TissGeneClin for SLC22A18AS |
| TissGeneDrug for SLC22A18AS |
| Drug information targeting TissGene (DrugBank Version 5.0.6, 2017-04-01) |
| DrugBank ID | Drug name | Drug activity | Drug type | Drug status |
| Top |
| TissGeneDisease for SLC22A18AS |
| Disease information associated with TissGene (DisGeNet, 2016-06-01) |
| Disease ID | Disease name | # pubmeds | Source |
| umls:C0004903 | Beckwith-Wiedemann Syndrome | 1 | BeFree |
|
Copyright 2016-Present - The University of Texas Health Science Center at Houston (UTHealth) Web File Viewing | How to Report, Fraud, Waste and Abuse | State of Texas | Statewide Search | Texas Homeland Security | Site Policies |