 |
| |
| |
| |
| |
| |
| |
|

| TissGeneSummary for PABPC3 |
 Gene summary Gene summary |
| Basic gene information | Gene symbol | PABPC3 |
| Gene name | poly(A) binding protein, cytoplasmic 3 | |
| Synonyms | PABP3|PABPL3|tPABP | |
| Cytomap | UCSC genome browser: 13q12-q13 | |
| Type of gene | protein-coding | |
| RefGenes | NM_030979.2, | |
| Description | PABP-3poly(A)-binding protein 3poly(A)-binding protein-like 3polyadenylate-binding protein 3testis PABPtestis-specific poly(A)-binding protein (PABP)testis-specific poly(A)-binding protein 3 | |
| Modification date | 20141207 | |
| dbXrefs | MIM : 604680 | |
| HGNC : HGNC | ||
| HPRD : 05248 | ||
| Protein | UniProt: go to UniProt's Cross Reference DB Table | |
| Expression | CleanEX: HS_PABPC3 | |
| BioGPS: 5042 | ||
| Pathway | NCI Pathway Interaction Database: PABPC3 | |
| KEGG: PABPC3 | ||
| REACTOME: PABPC3 | ||
| Pathway Commons: PABPC3 | ||
| Context | iHOP: PABPC3 | |
| ligand binding site mutation search in PubMed: PABPC3 | ||
| UCL Cancer Institute: PABPC3 | ||
| Assigned class in TissGDB* | C | |
| Included tissue-specific gene expression resources | HPA,GTEx | |
| Specific-tissues in normal samples (assigned by TissGDB using HPA, TiGER, and GTEx) | Testis | |
| Cancer types related to the specific-tissues in cancer samples (assigned by TissGDB using TCGA) | TGCT | |
| Reference showing the relevant tissue of PABPC3 | ||
| Description by TissGene annotations | Cancer gene | |
| * Class A consists of genes with literature evidence and is part of the cTissGenes. Class B consists of only cTissGenes without additional evidence. The remaining genes belong to Class C. |
| Gene ontology having evidence of Inferred from Direct Assay (IDA) from Entrez |
| GO ID | GO term | PubMed ID |
| Top |
| TissGeneExp for PABPC3 |
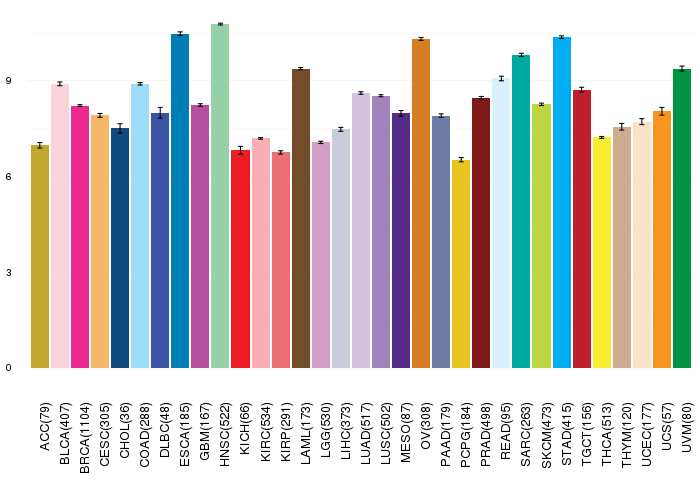
| Gene expressions across 28 cancer types (X-axis: cancer type and Y-axis: log2(norm_counts+1)) (TCGA IlluminaHiSeq_RNASeqV2, pan-cancer normalized log2(norm_counts+1) data, version 2016-08-16) |
 |
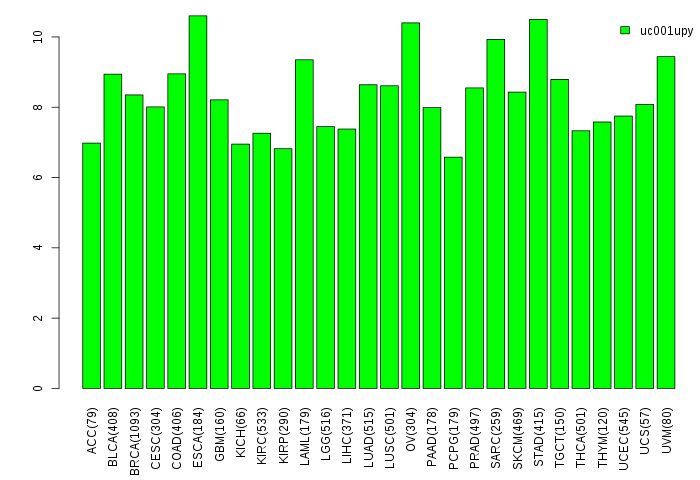
| Gene isoform expressions across 28 cancer types (X-axis: cancer type and Y-axis: log2(norm_counts+1)) (TCGA pan-cancer tcga_rsem_isoform_tpm, version 2016-09-01) |
 |
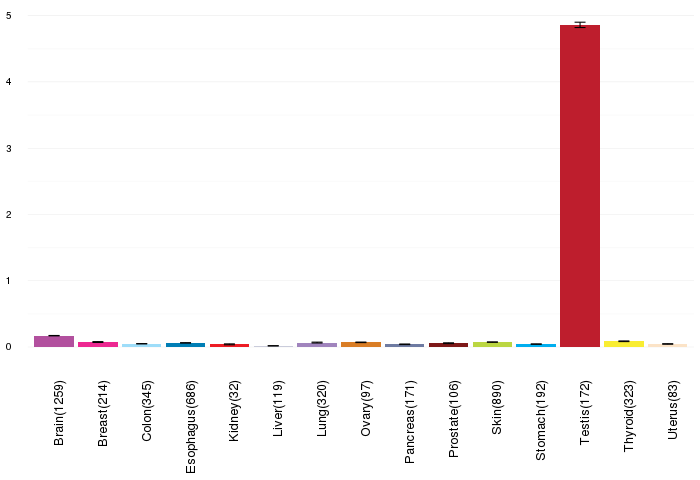
| Gene expressions across normal tissues of GTEx data (GTEx GTEx_Analysis_v6_RNA-seq_RNA-SeQCv1.1.8_gene_rpkm.gct) - Here, we shows the matched tissue types only among our 28 cancer types. |
 |
| Different expressions across 14 cancer types with more than 10 samples between matched tumors and normals (X-axis: cancer type and Y-axis: log2(norm_counts+1)) (TCGA IlluminaHiSeq_RNASeqV2, pan-cancer normalized log2(norm_counts+1) data, version 2016-08-16) |
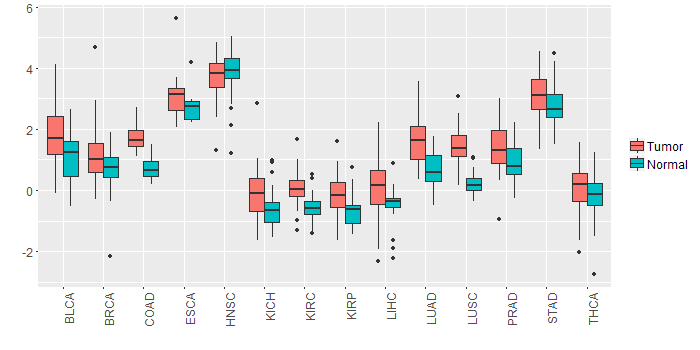 |
| - Significantly differentially expressed cancer types and information. (|Fold change|>1 and FDR<0.05) |
| Cancer type | Mean(exp) in tumor | Mean(exp) in matched normal | Log2FC | P-val. | FDR |
| COAD | 1.750818254 | 0.702229792 | 1.048588462 | 2.27E-12 | 5.24E-11 |
| LUSC | 1.414230546 | 0.206510938 | 1.207719608 | 1.14E-19 | 1.29E-18 |
| Top |
| TissGene-miRNA for PABPC3 |
| Significantly anti-correlated miRNAs of TissGene across 28 cancer types (Gene-miRNA relations from TargetScanHuman Relsease 7.1, Conserved_Site_Context_Scores.txt.zip, 06.01.2016) (TCGA IlluminaHiSeq_miRNASeq, log2(RPM+1) data, version 2016-11-21) (TCGA IlluminaHiSeq_RNASeqV2, log2(normalized_count+1) data, version 2016-08-16) (Spearman’s Rank Correlation (p-value<0.05 and coefficient<-0.25)) |
| Cancer type | miRNA id | miRNA accession | P-val. | Coeff. | # samples |
| Top |
| TissGeneMut for PABPC3 |
| TissGeneSNV for PABPC3 |
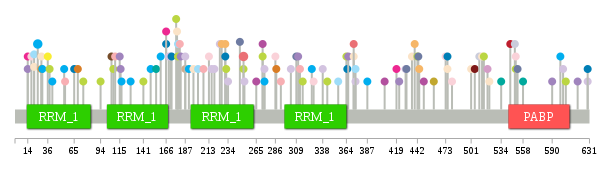
| nsSNV counts per each loci. Different colors of circles represent different cancer types. Circle size denotes number of samples. (TCGA somatic mutation (SNPs and small INDELs) data, version 2016-04-25) * Click on the image to enlarge it in a new window. |
 |
 |
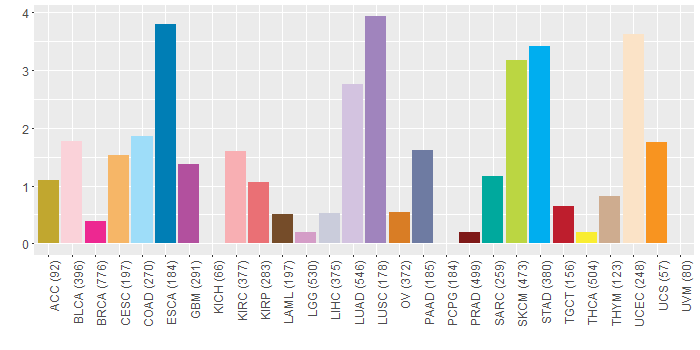
| Somatic nucleotide variants of TissGene across 28 cancer types (X-axis: cancer type and Y-axis: % of mutated samples) The numbers in parentheses are numbers of samples with mutation (nsSNVs). (TCGA somatic mutation (SNPs and small INDELs) data, version 2016-04-25) |
 |
| - nsSNVs sorted by frequency. |
| AAchange | Cancer type | # samples |
| p.A25V | STAD | 2 |
| p.M251I | KIRP | 2 |
| p.Y590S | LUSC | 1 |
| p.V365L | ESCA | 1 |
| p.R505W | PRAD | 1 |
| p.R519L | MESO | 1 |
| p.K444M | CESC | 1 |
| p.V534E | SARC | 1 |
| p.A436V | UCEC | 1 |
| p.A65T | ESCA | 1 |
| p.Y364F | SKCM | 1 |
| p.R272Q | GBM | 1 |
| p.P36S | THCA | 1 |
| p.I110L | KIRC | 1 |
| p.A387T | STAD | 1 |
| p.P419A | BRCA | 1 |
| p.D21N | COAD | 1 |
| p.S227G | CESC | 1 |
| p.D21N | UCEC | 1 |
| p.M460V | ACC | 1 |
| p.K213N | BLCA | 1 |
| p.Y54C | STAD | 1 |
| p.D225E | LUAD | 1 |
| p.E372* | UCEC | 1 |
| p.E29K | UCEC | 1 |
| p.I422T | LUSC | 1 |
| p.R501C | UCEC | 1 |
| p.Q172R | ESCA | 1 |
| p.A187S | LUAD | 1 |
| p.R272Q | SKCM | 1 |
| p.G232E | SKCM | 1 |
| p.K231E | ESCA | 1 |
| p.P316L | SKCM | 1 |
| p.G160R | STAD | 1 |
| p.Q442* | SKCM | 1 |
| p.T618A | LUSC | 1 |
| p.V602A | LUAD | 1 |
| p.K108M | SKCM | 1 |
| p.Y14* | BRCA | 1 |
| p.A625T | DLBC | 1 |
| p.A521T | UCEC | 1 |
| p.A55T | KIRC | 1 |
| p.G141R | SKCM | 1 |
| p.S127L | STAD | 1 |
| p.R374H | LUAD | 1 |
| p.K30T | STAD | 1 |
| p.P549H | LIHC | 1 |
| p.P191S | STAD | 1 |
| p.A366S | LUSC | 1 |
| p.N443T | PAAD | 1 |
| p.K552N | PAAD | 1 |
| p.R94Q | SKCM | 1 |
| p.Y116S | LUSC | 1 |
| p.L106V | LAML | 1 |
| p.R519H | LGG | 1 |
| p.A510V | LIHC | 1 |
| p.A247D | PAAD | 1 |
| p.E178* | UCEC | 1 |
| p.S51P | HNSC | 1 |
| p.A406T | GBM | 1 |
| p.G234V | LUAD | 1 |
| p.G355S | COAD | 1 |
| p.P629T | LUAD | 1 |
| p.P515L | SKCM | 1 |
| p.R475H | ESCA | 1 |
| p.A387V | HNSC | 1 |
| p.P629T | ESCA | 1 |
| p.S219G | LUAD | 1 |
| p.V338E | LUAD | 1 |
| p.R41W | STAD | 1 |
| p.K177R | SKCM | 1 |
| p.L69R | OV | 1 |
| p.S480* | BLCA | 1 |
| p.T274M | STAD | 1 |
| p.E149K | STAD | 1 |
| p.D286H | BLCA | 1 |
| p.P216H | LUAD | 1 |
| p.T274K | LUAD | 1 |
| p.R166H | BRCA | 1 |
| p.D117E | STAD | 1 |
| p.R309H | PAAD | 1 |
| p.T473M | BLCA | 1 |
| p.A181T | KIRC | 1 |
| p.R272Q | READ | 1 |
| p.A187S | THYM | 1 |
| p.K196N | UCEC | 1 |
| p.L207F | KIRC | 1 |
| p.P550H | BLCA | 1 |
| p.R311W | CHOL | 1 |
| p.R513C | UCEC | 1 |
| p.M251I | SKCM | 1 |
| p.R287S | OV | 1 |
| p.R475H | UCEC | 1 |
| p.H439Y | CESC | 1 |
| p.R166H | ESCA | 1 |
| p.I155T | SARC | 1 |
| p.D75N | SKCM | 1 |
| p.D303N | LUAD | 1 |
| p.D201Y | COAD | 1 |
| p.G558D | SARC | 1 |
| p.R430H | PAAD | 1 |
| p.T48S | HNSC | 1 |
| p.F169I | LUAD | 1 |
| p.R374H | COAD | 1 |
| p.E372G | KIRP | 1 |
| p.L18F | BLCA | 1 |
| p.R374C | CHOL | 1 |
| p.M326I | STAD | 1 |
| p.P343S | SKCM | 1 |
| p.R265* | GBM | 1 |
| p.N252D | LUAD | 1 |
| p.Q292X | KIRC | 1 |
| p.R544M | TGCT | 1 |
| p.P429H | LUAD | 1 |
| p.R513C | READ | 1 |
| p.R599H | STAD | 1 |
| p.R449H | GBM | 1 |
| p.K231E | CESC | 1 |
| p.A313V | KIRC | 1 |
| p.A605V | SKCM | 1 |
| p.A391T | HNSC | 1 |
| p.A313V | READ | 1 |
| p.R179X | COAD | 1 |
| p.G627S | READ | 1 |
| p.G50C | HNSC | 1 |
| p.T618A | HNSC | 1 |
| p.R311W | LUSC | 1 |
| p.E328Q | BLCA | 1 |
| p.Y14* | LUSC | 1 |
| p.Q395E | HNSC | 1 |
| p.L38F | SKCM | 1 |
| p.E29K | UCS | 1 |
| p.L115V | LUSC | 1 |
| p.G171V | LUAD | 1 |
| p.R179Q | SKCM | 1 |
| p.E182K | LUSC | 1 |
| p.P550S | SKCM | 1 |
| Top |
| TissGeneCNV for PABPC3 |
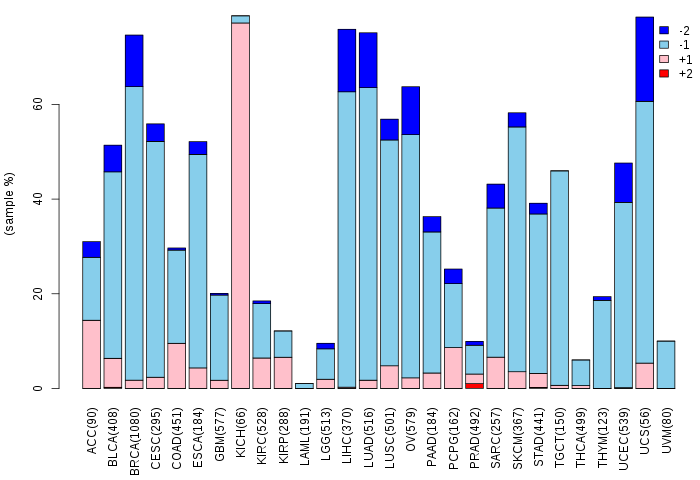
| Copy number variations of TissGene across 28 cancer types (X-axis: cancer type and Y-axis: % of CNV samples) (TCGA Gistic2_CopyNumber_Gistic2_all_data_by_genes, Gistic2 copy number data, version 2016-08-16) |
 |
| Top |
| TissGeneFusions for PABPC3 |
| Fusion genes including TissGene (ChimerDB 3.0, 2016-12-01 and TCGA fusion Portal 2015-12-01) |
| Database | Src | Cancer type | Sample | Fusion gene | ORF | 5'-gene BP | 3'-gene BP |
| Chimerdb3.0 | TopHat-Fusion | LAML | TCGA-AB-2969-03A | PABPC1-PABPC3 | Out-of-Frame | chr8:101721746 | chr13:25671317 |
| Chimerdb3.0 | TopHat-Fusion | OV | TCGA-23-1024-01A | PABPC1-PABPC3 | Out-of-Frame | chr8:101724897 | chr13:25671218 |
| Chimerdb3.0 | TopHat-Fusion | OV | TCGA-24-2023-01A | PABPC1-PABPC3 | Out-of-Frame | chr8:101718958 | chr13:25671669 |
| Chimerdb3.0 | TopHat-Fusion | OV | TCGA-24-2023-01A | PABPC1-PABPC3 | Out-of-Frame | chr8:101724897 | chr13:25671218 |
| Chimerdb3.0 | TopHat-Fusion | OV | TCGA-36-1570-01A | PABPC1-PABPC3 | Out-of-Frame | chr8:101724897 | chr13:25671218 |
| Top |
| TissGeneNet for PABPC3 |
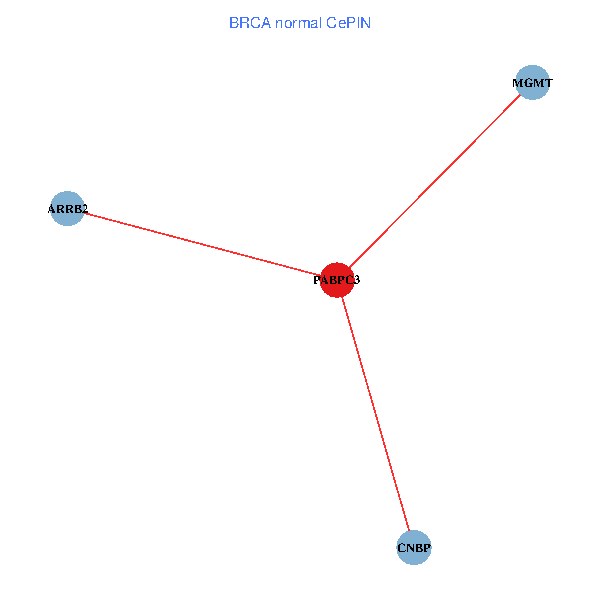
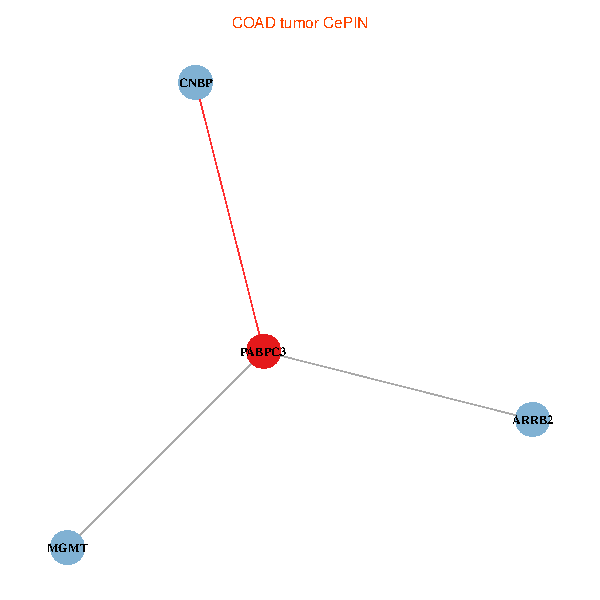
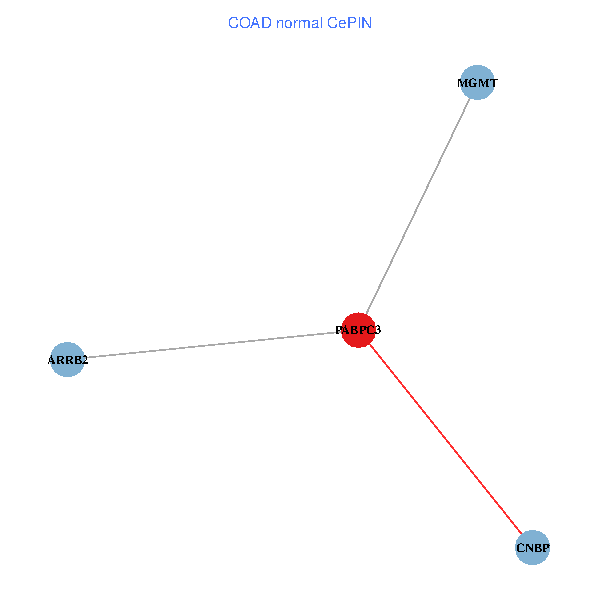
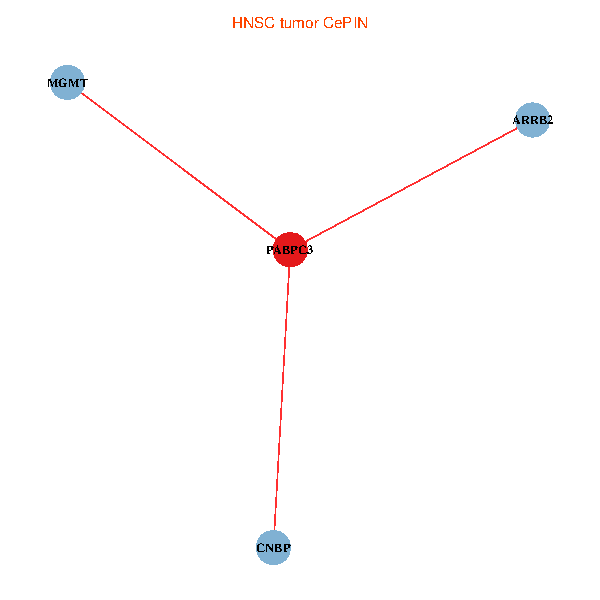
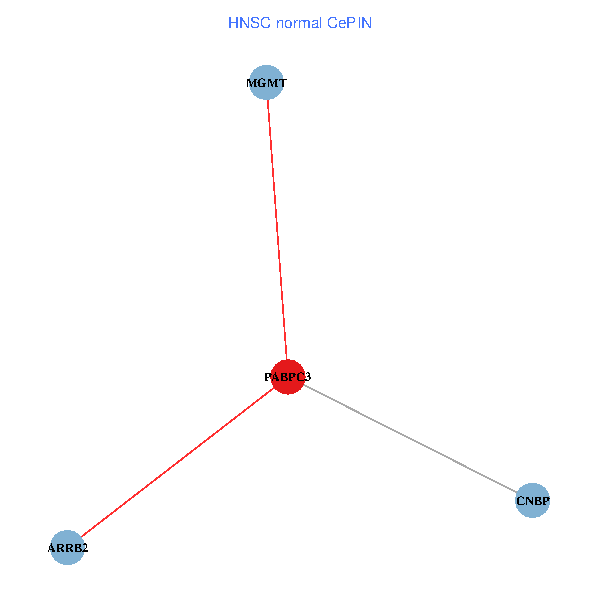
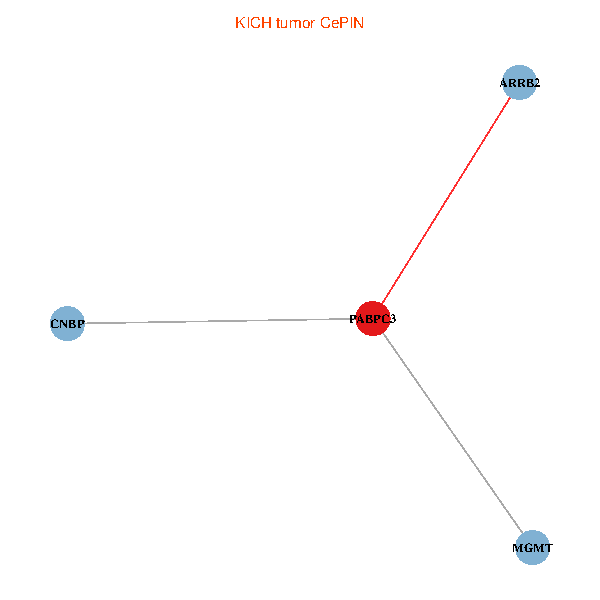
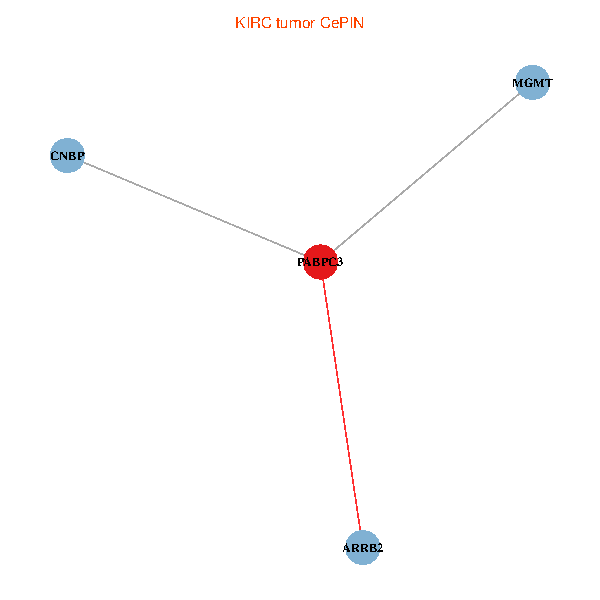
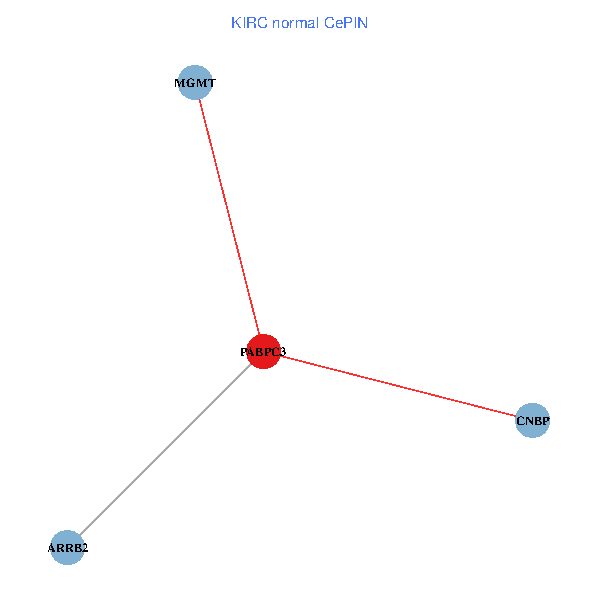
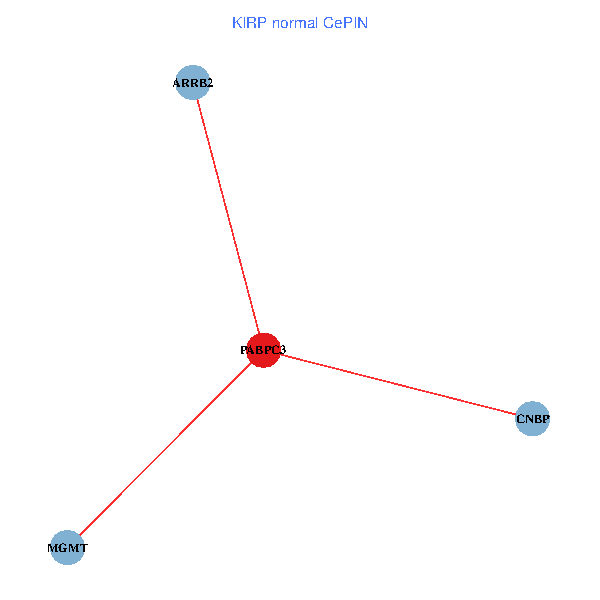
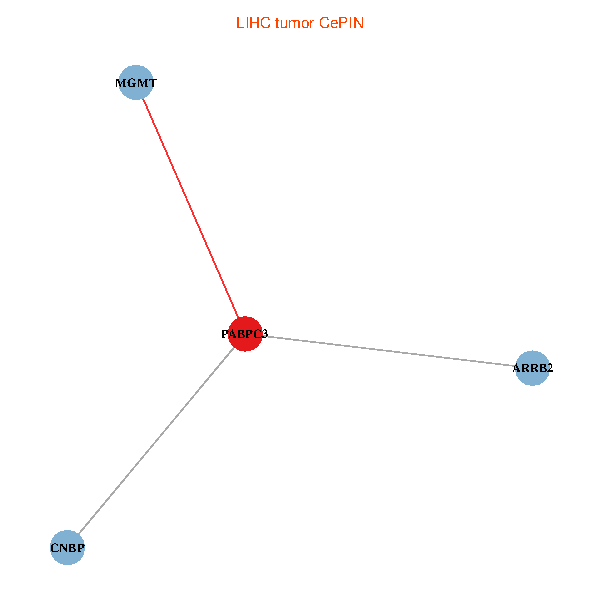
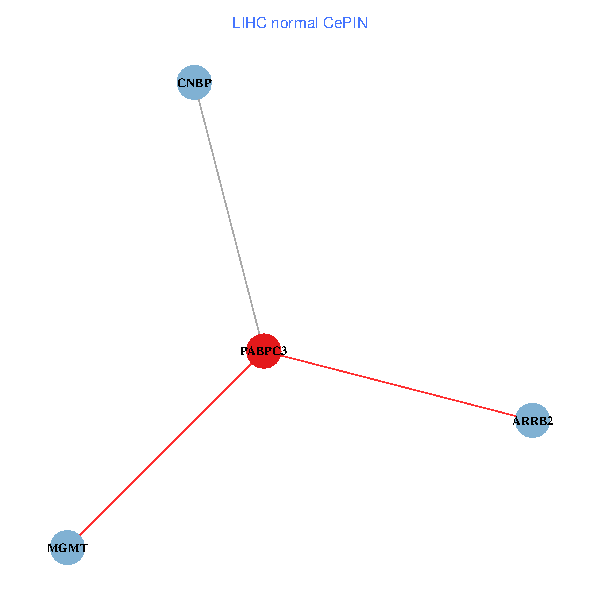
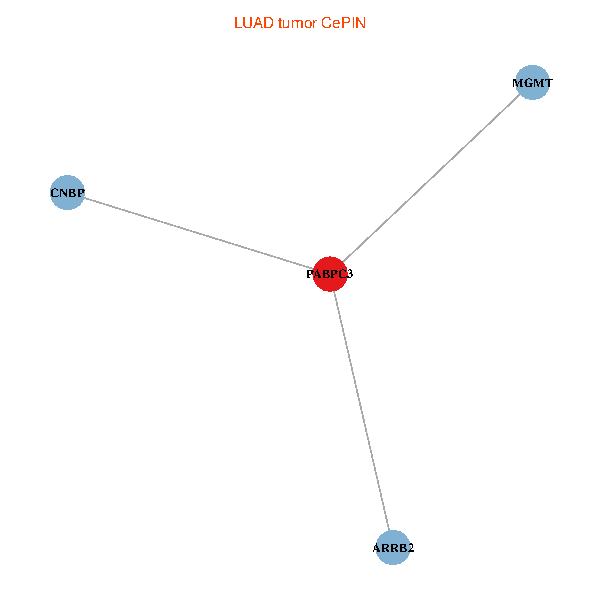
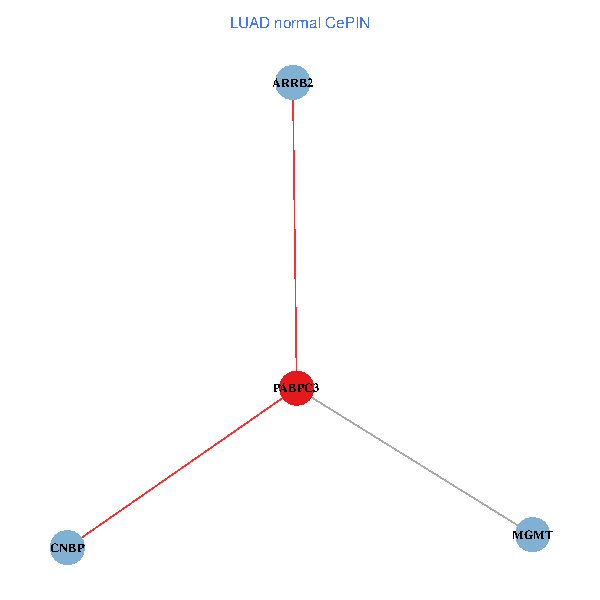
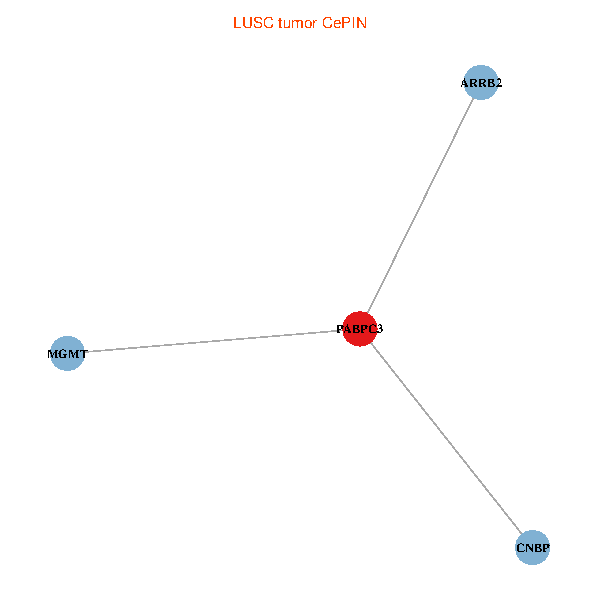
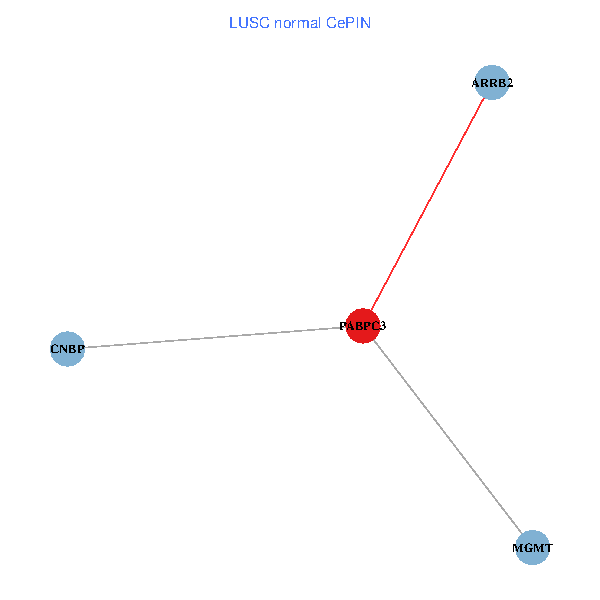
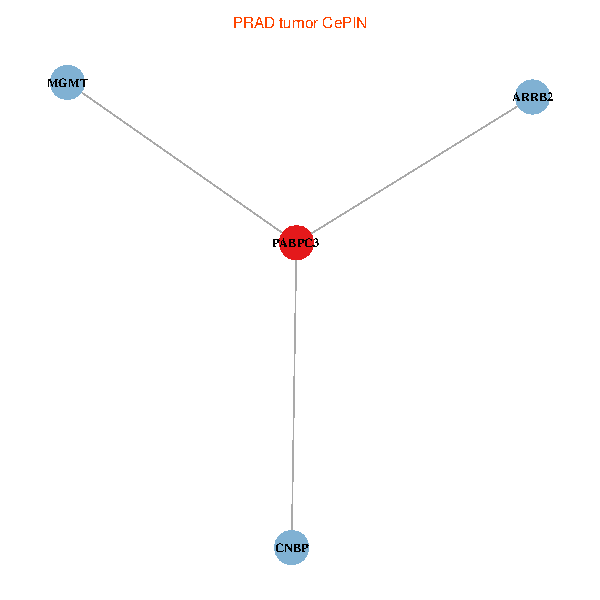
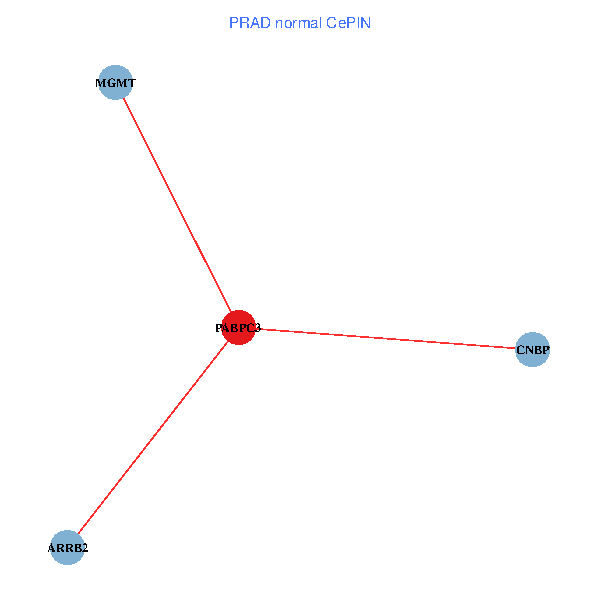
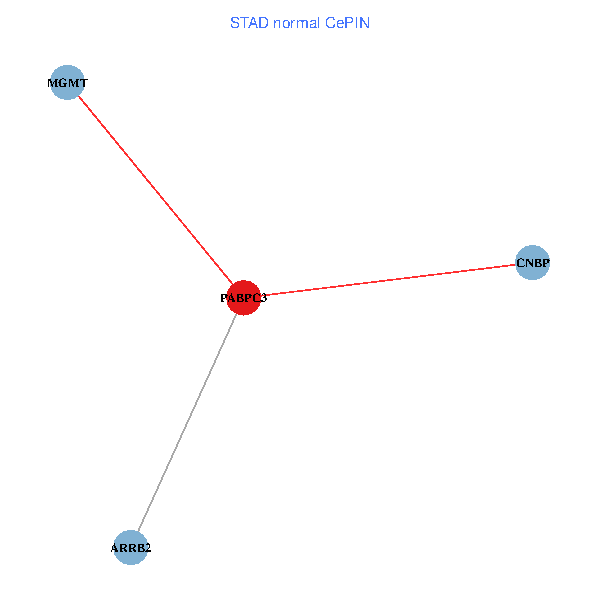
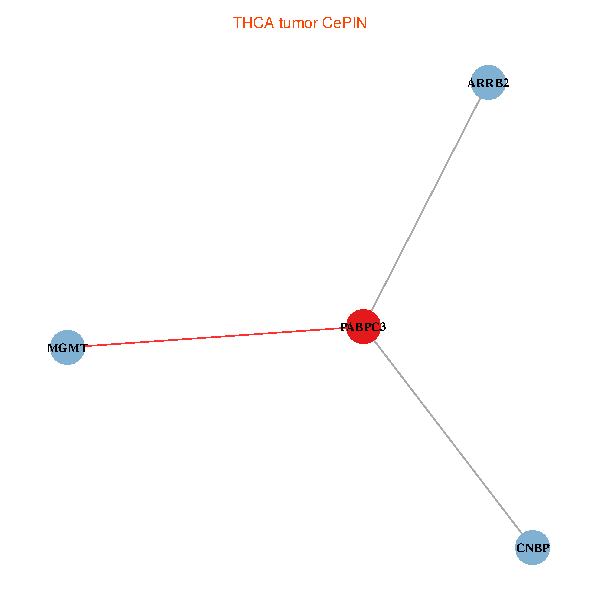
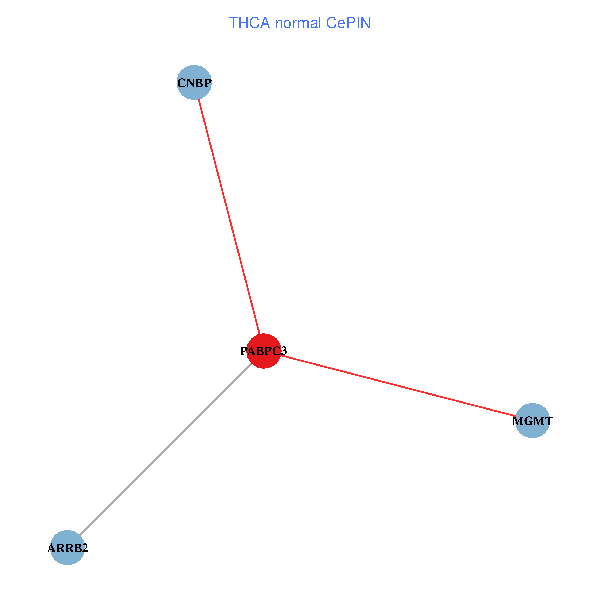
| Co-expressed gene networks based on protein-protein interaction data (CePIN) (TCGA IlluminaHiSeq_RNASeqV2, pan-cancer normalized log2(norm_counts+1) data, version 2016-08-16) (PINA2 ppi data) |
| BRCA (tumor) | BRCA (normal) |
| PABPC3, CNBP, ARRB2, MGMT (tumor) | PABPC3, CNBP, ARRB2, MGMT (normal) |
 |  |
| COAD (tumor) | COAD (normal) |
| PABPC3, CNBP, ARRB2, MGMT (tumor) | PABPC3, CNBP, ARRB2, MGMT (normal) |
 |  |
| HNSC (tumor) | HNSC (normal) |
| PABPC3, CNBP, ARRB2, MGMT (tumor) | PABPC3, CNBP, ARRB2, MGMT (normal) |
 |  |
| KICH (tumor) | KICH (normal) |
| PABPC3, CNBP, ARRB2, MGMT (tumor) | PABPC3, CNBP, ARRB2, MGMT (normal) |
 |  |
| KIRC (tumor) | KIRC (normal) |
| PABPC3, CNBP, ARRB2, MGMT (tumor) | PABPC3, CNBP, ARRB2, MGMT (normal) |
 |  |
| KIRP (tumor) | KIRP (normal) |
| PABPC3, CNBP, ARRB2, MGMT (tumor) | PABPC3, CNBP, ARRB2, MGMT (normal) |
 |  |
| LIHC (tumor) | LIHC (normal) |
| PABPC3, CNBP, ARRB2, MGMT (tumor) | PABPC3, CNBP, ARRB2, MGMT (normal) |
 |  |
| LUAD (tumor) | LUAD (normal) |
| PABPC3, CNBP, ARRB2, MGMT (tumor) | PABPC3, CNBP, ARRB2, MGMT (normal) |
 |  |
| LUSC (tumor) | LUSC (normal) |
| PABPC3, CNBP, ARRB2, MGMT (tumor) | PABPC3, CNBP, ARRB2, MGMT (normal) |
 |  |
| PRAD (tumor) | PRAD (normal) |
| PABPC3, CNBP, ARRB2, MGMT (tumor) | PABPC3, CNBP, ARRB2, MGMT (normal) |
 |  |
| STAD (tumor) | STAD (normal) |
| PABPC3, CNBP, ARRB2, MGMT (tumor) | PABPC3, CNBP, ARRB2, MGMT (normal) |
 |  |
| THCA (tumor) | THCA (normal) |
| PABPC3, CNBP, ARRB2, MGMT (tumor) | PABPC3, CNBP, ARRB2, MGMT (normal) |
 |  |
| Top |
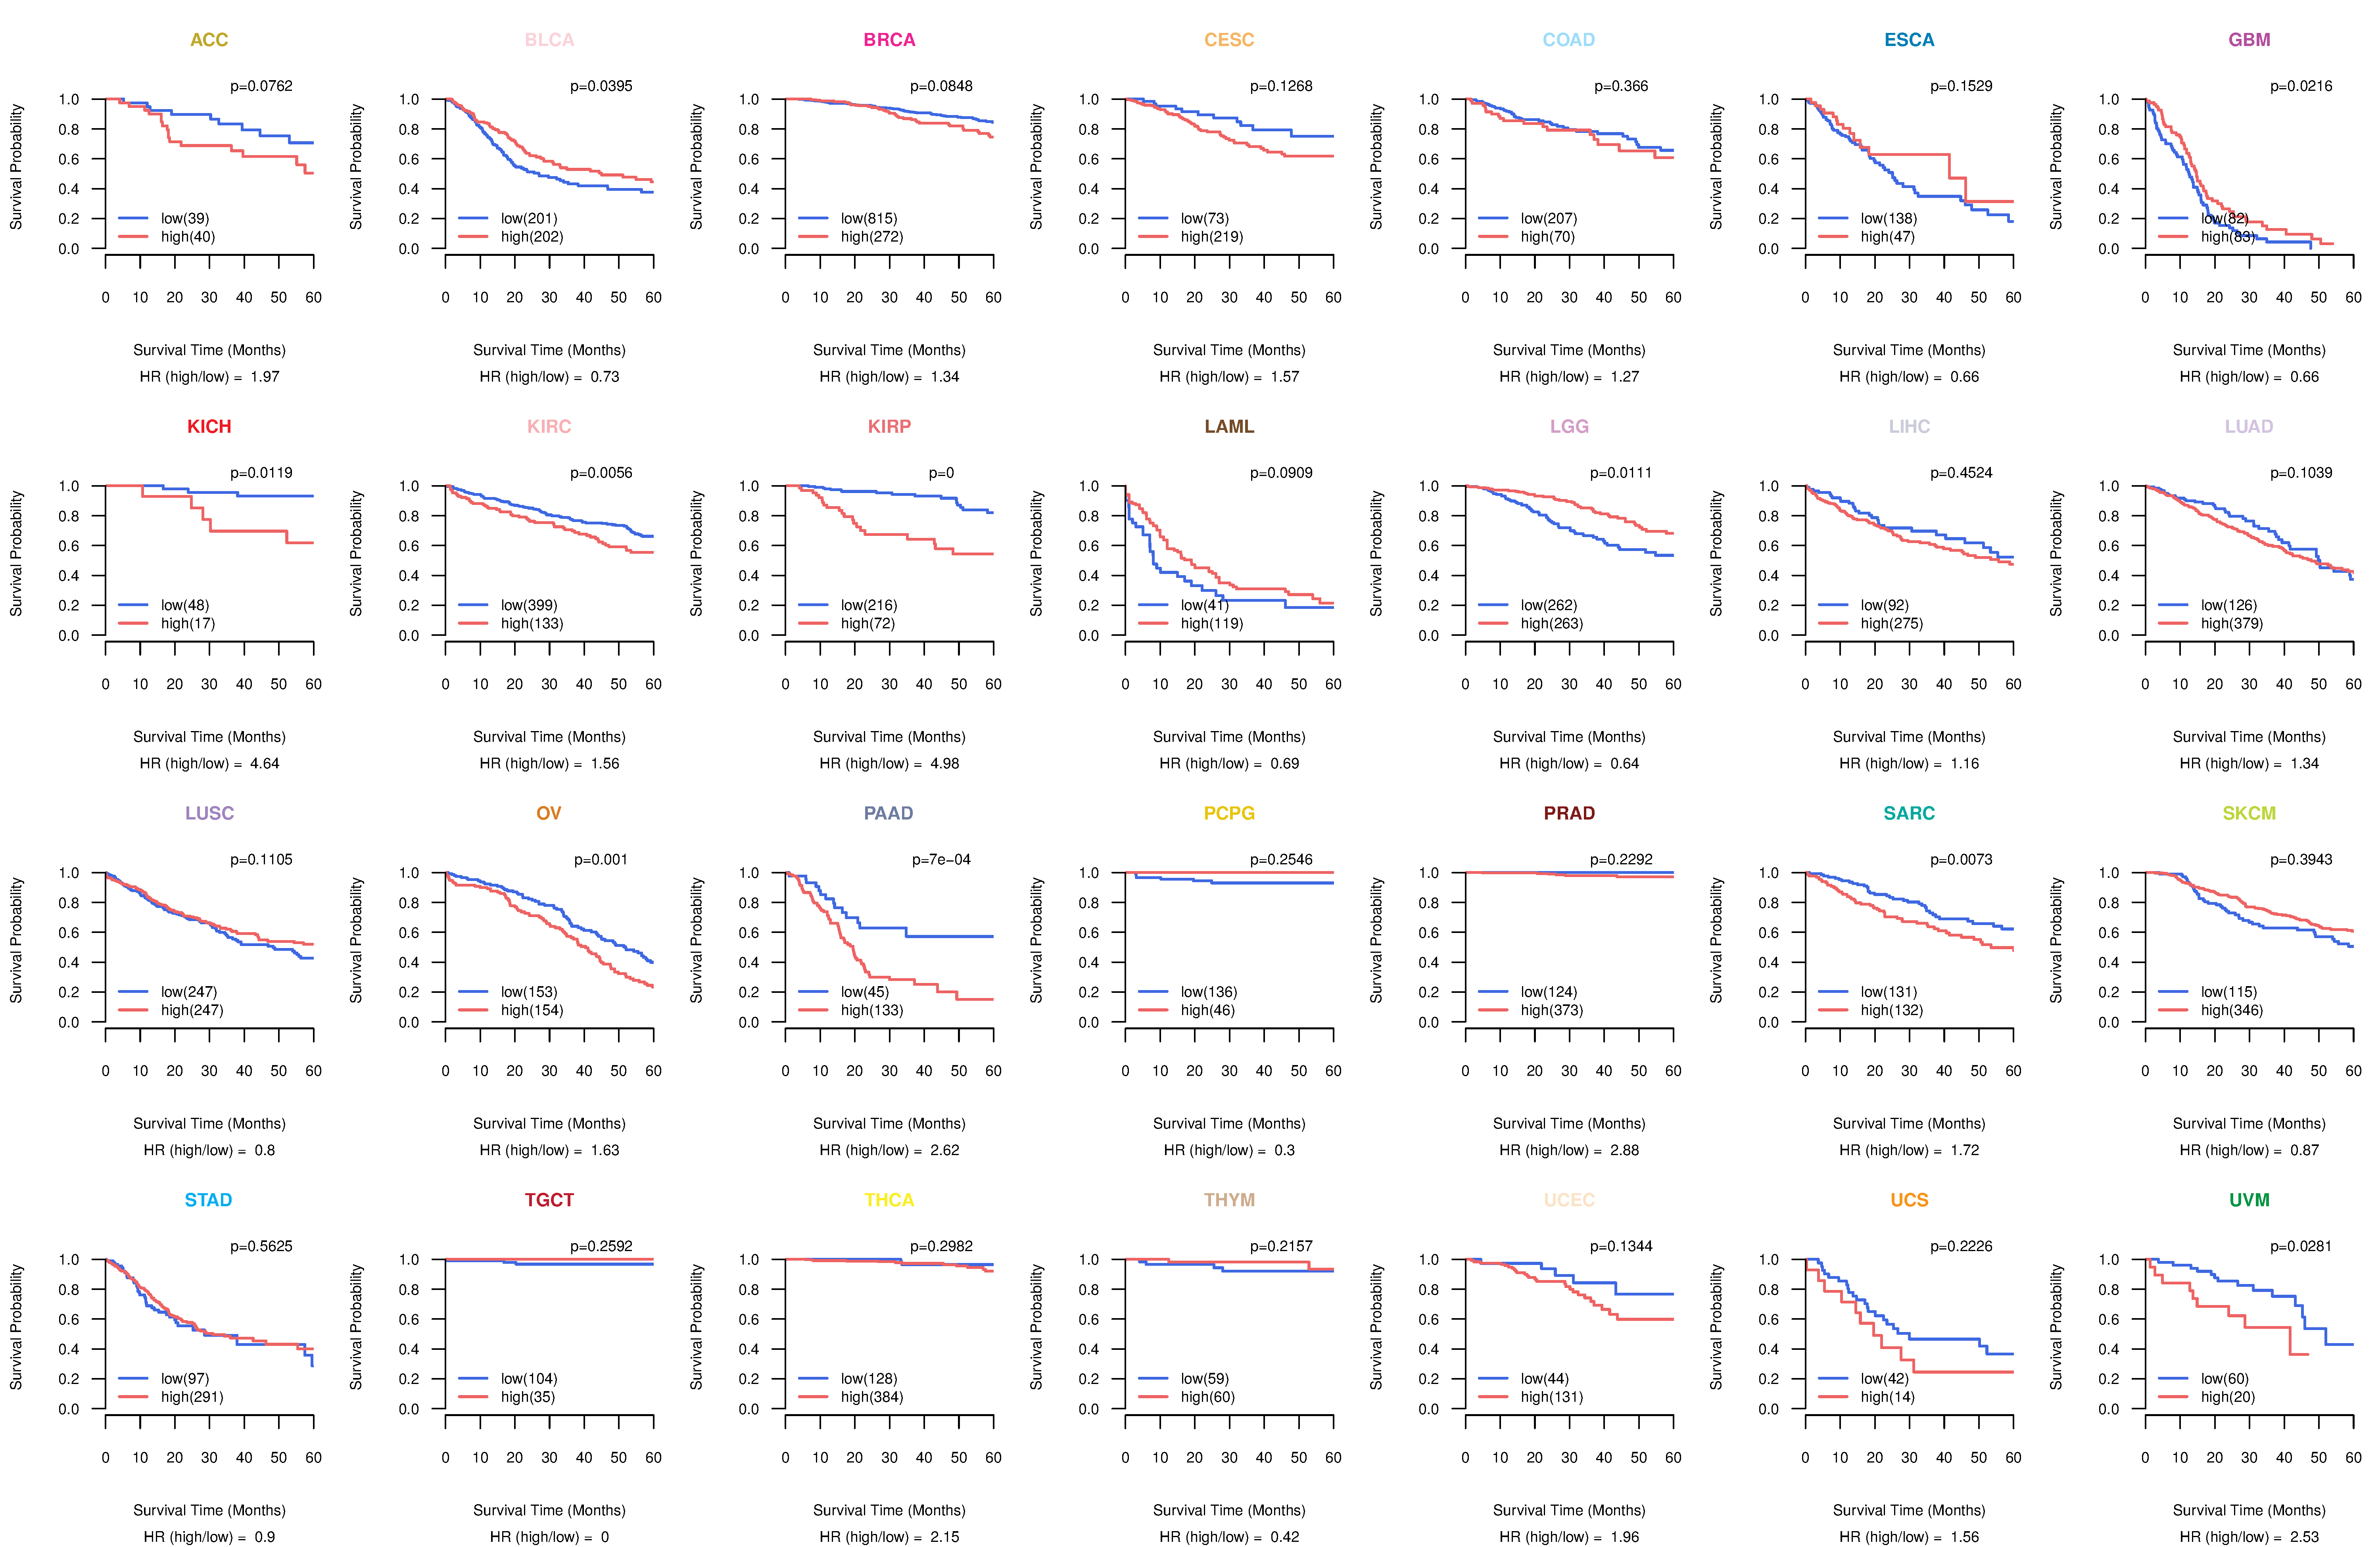
| TissGeneProg for PABPC3 |
| Kaplan-Meier plots with logrank tests of overall survival (OS) using 28 cancer types (TCGA IlluminaHiSeq_RNASeqV2, pan-cancer normalized log2(norm_counts+1) data, version 2016-08-16) (TCGA clinicalMatrix, phenotype data, version 2016-04-27) * Click on the image to enlarge it in a new window. |
 |
| Kaplan-Meier plots with logrank test of relapse free survival (RFS) using 28 cancer types (TCGA IlluminaHiSeq_RNASeqV2, pan-cancer normalized log2(norm_counts+1) data, version 2016-08-16) (TCGA clinicalMatrix, phenotype data, version 2016-04-27) * Click on the image enlarge it in a new window. |
 |
| Forest plot of Cox proportional hazard ratio (HR) and 95% CI of overall survival (OS) using 28 cancer types (TCGA IlluminaHiSeq_RNASeqV2, pan-cancer normalized log2(norm_counts+1) data, version 2016-08-16) (TCGA clinicalMatrix, phenotype data, version 2016-04-27) * Click on the image enlarge it in a new window. |
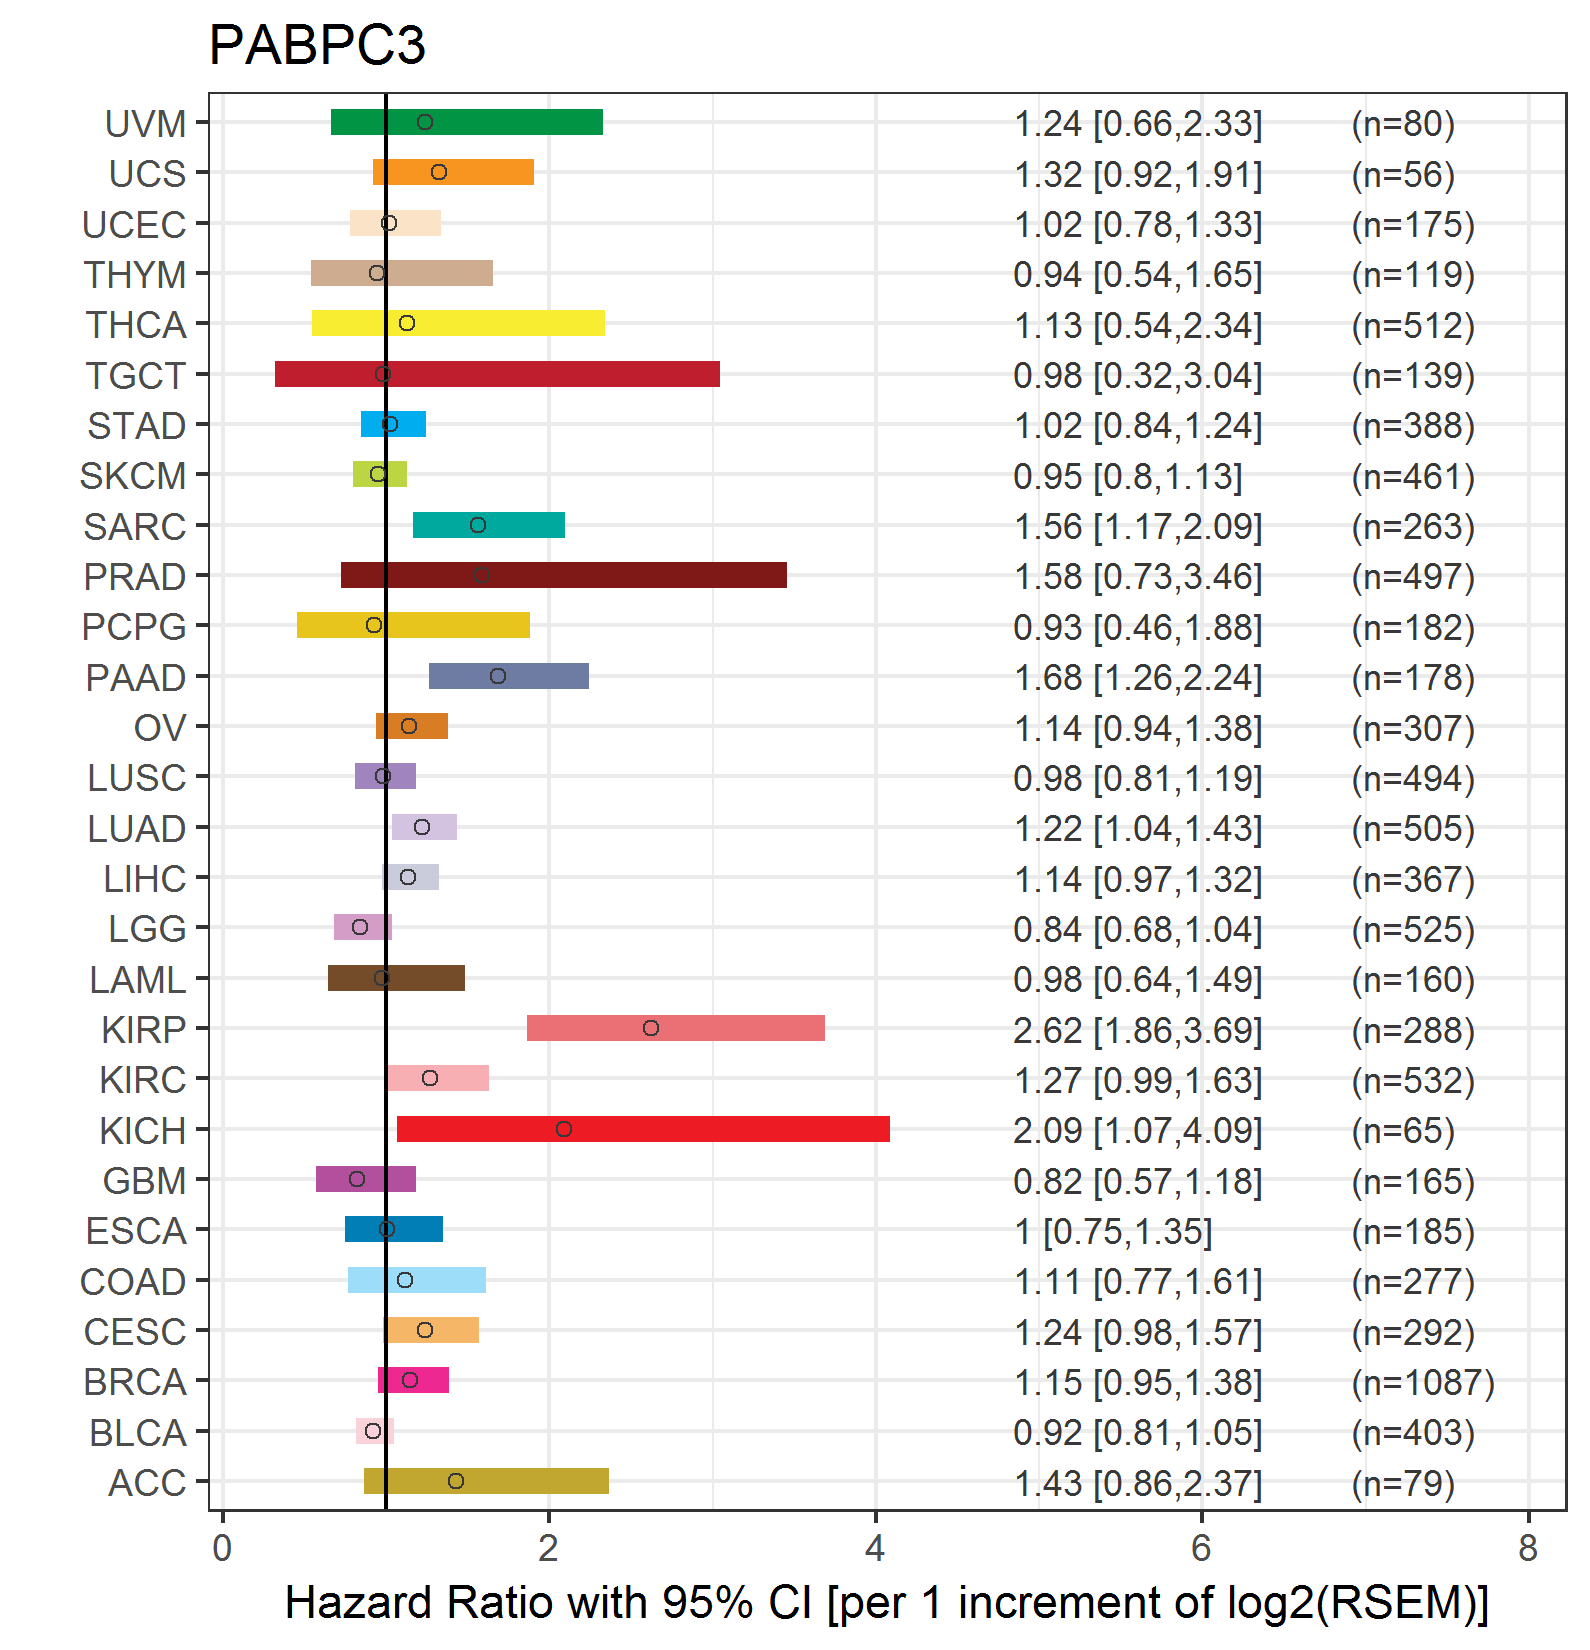 |
| Forest plot of Cox proportional hazard ratio (HR) and 95% CI of relapse free survival (RFS) using 28 cancer types (TCGA IlluminaHiSeq_RNASeqV2, pan-cancer normalized log2(norm_counts+1) data, version 2016-08-16) (TCGA clinicalMatrix, phenotype data, version 2016-04-27) * Click on the image enlarge it in a new window. |
 |
| Top |
| TissGeneClin for PABPC3 |
| TissGeneDrug for PABPC3 |
| Drug information targeting TissGene (DrugBank Version 5.0.6, 2017-04-01) |
| DrugBank ID | Drug name | Drug activity | Drug type | Drug status |
| Top |
| TissGeneDisease for PABPC3 |
| Disease information associated with TissGene (DisGeNet, 2016-06-01) |
| Disease ID | Disease name | # pubmeds | Source |
| umls:C0005911 | Body Weight Changes | 1 | GAD |
| umls:C1561549 | Glomerular filtration rate finding | 1 | GAD |
|
Copyright 2016-Present - The University of Texas Health Science Center at Houston (UTHealth) Web File Viewing | How to Report, Fraud, Waste and Abuse | State of Texas | Statewide Search | Texas Homeland Security | Site Policies |