 |
| |
| |
| |
| |
| |
| |
|

| TissGeneSummary for ANO7 |
 Gene summary Gene summary |
| Basic gene information | Gene symbol | ANO7 |
| Gene name | anoctamin 7 | |
| Synonyms | D-TMPP|DTMPP|IPCA-5|IPCA5|NGEP|PCANAP5|PCANAP5L|TMEM16G | |
| Cytomap | UCSC genome browser: 2q37.3 | |
| Type of gene | protein-coding | |
| RefGenes | NM_001001666.3, NM_001001891.3, | |
| Description | Dresden-transmembrane protein of the prostateanoctamin-7prostate cancer associated protein 5transmembrane protein 16G | |
| Modification date | 20141207 | |
| dbXrefs | MIM : 605096 | |
| HGNC : HGNC | ||
| Ensembl : ENSG00000146205 | ||
| HPRD : 16090 | ||
| Vega : OTTHUMG00000151702 | ||
| Protein | UniProt: go to UniProt's Cross Reference DB Table | |
| Expression | CleanEX: HS_ANO7 | |
| BioGPS: 50636 | ||
| Pathway | NCI Pathway Interaction Database: ANO7 | |
| KEGG: ANO7 | ||
| REACTOME: ANO7 | ||
| Pathway Commons: ANO7 | ||
| Context | iHOP: ANO7 | |
| ligand binding site mutation search in PubMed: ANO7 | ||
| UCL Cancer Institute: ANO7 | ||
| Assigned class in TissGDB* | C | |
| Included tissue-specific gene expression resources | TiGER,GTEx | |
| Specific-tissues in normal samples (assigned by TissGDB using HPA, TiGER, and GTEx) | Prostate | |
| Cancer types related to the specific-tissues in cancer samples (assigned by TissGDB using TCGA) | PRAD | |
| Reference showing the relevant tissue of ANO7 | ||
| Description by TissGene annotations | ||
| * Class A consists of genes with literature evidence and is part of the cTissGenes. Class B consists of only cTissGenes without additional evidence. The remaining genes belong to Class C. |
| Gene ontology having evidence of Inferred from Direct Assay (IDA) from Entrez |
| GO ID | GO term | PubMed ID | GO:0006821 | chloride transport | 22946059 | GO:0006821 | chloride transport | 22946059 |
| Top |
| TissGeneExp for ANO7 |
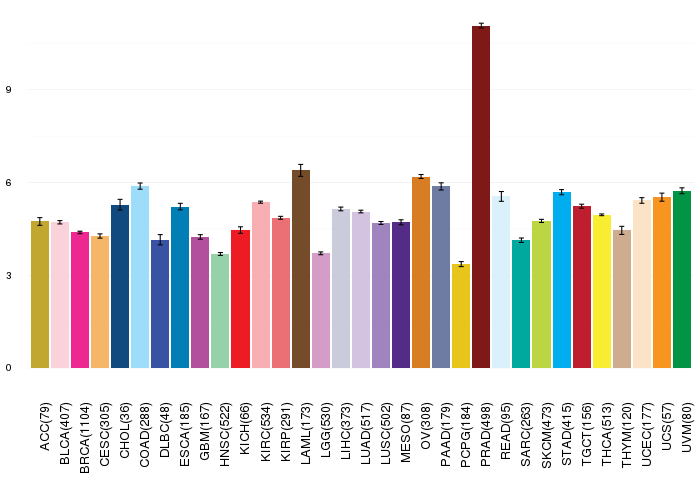
| Gene expressions across 28 cancer types (X-axis: cancer type and Y-axis: log2(norm_counts+1)) (TCGA IlluminaHiSeq_RNASeqV2, pan-cancer normalized log2(norm_counts+1) data, version 2016-08-16) |
 |
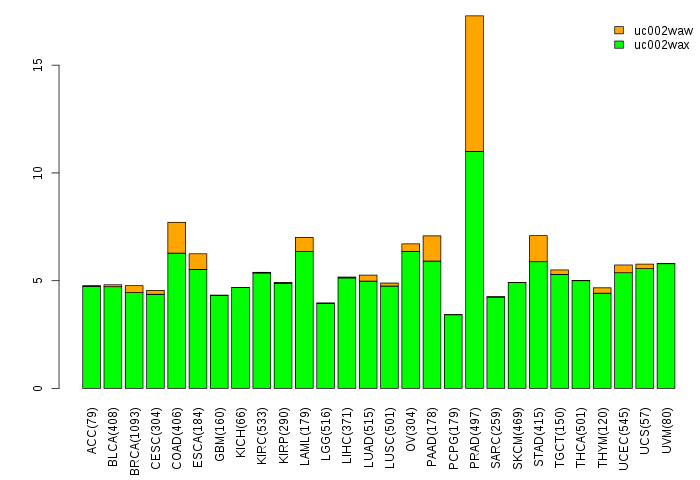
| Gene isoform expressions across 28 cancer types (X-axis: cancer type and Y-axis: log2(norm_counts+1)) (TCGA pan-cancer tcga_rsem_isoform_tpm, version 2016-09-01) |
 |
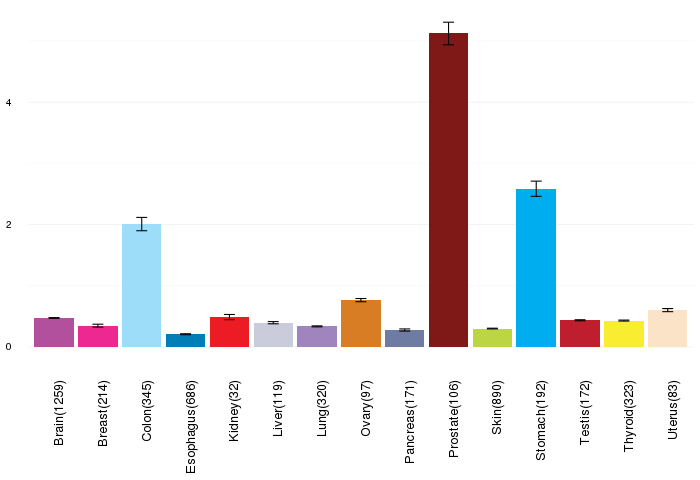
| Gene expressions across normal tissues of GTEx data (GTEx GTEx_Analysis_v6_RNA-seq_RNA-SeQCv1.1.8_gene_rpkm.gct) - Here, we shows the matched tissue types only among our 28 cancer types. |
 |
| Different expressions across 14 cancer types with more than 10 samples between matched tumors and normals (X-axis: cancer type and Y-axis: log2(norm_counts+1)) (TCGA IlluminaHiSeq_RNASeqV2, pan-cancer normalized log2(norm_counts+1) data, version 2016-08-16) |
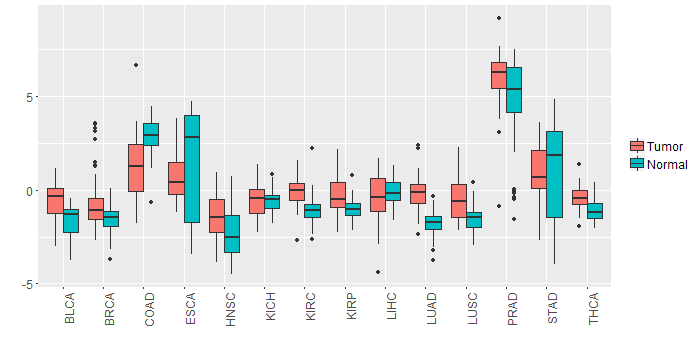 |
| - Significantly differentially expressed cancer types and information. (|Fold change|>1 and FDR<0.05) |
| Cancer type | Mean(exp) in tumor | Mean(exp) in matched normal | Log2FC | P-val. | FDR |
| LUSC | -0.500099933 | -1.540760717 | 1.040660784 | 2.73E-07 | 7.29E-07 |
| LUAD | -0.184165112 | -1.814187526 | 1.630022414 | 2.25E-19 | 4.10E-18 |
| KIRC | -0.011265783 | -1.029835227 | 1.018569444 | 3.37E-15 | 1.71E-14 |
| BLCA | -0.600452771 | -1.658421192 | 1.057968421 | 0.00291 | 0.017444313 |
| PRAD | 5.994444901 | 4.810887209 | 1.183557692 | 0.00316 | 0.008786055 |
| COAD | 1.239462209 | 2.767839132 | -1.528376923 | 0.000838 | 0.002454623 |
| HNSC | -1.267115072 | -2.302508095 | 1.035393023 | 0.000404 | 0.001545918 |
| Top |
| TissGene-miRNA for ANO7 |
| Significantly anti-correlated miRNAs of TissGene across 28 cancer types (Gene-miRNA relations from TargetScanHuman Relsease 7.1, Conserved_Site_Context_Scores.txt.zip, 06.01.2016) (TCGA IlluminaHiSeq_miRNASeq, log2(RPM+1) data, version 2016-11-21) (TCGA IlluminaHiSeq_RNASeqV2, log2(normalized_count+1) data, version 2016-08-16) (Spearman’s Rank Correlation (p-value<0.05 and coefficient<-0.25)) |
| Cancer type | miRNA id | miRNA accession | P-val. | Coeff. | # samples |
| Top |
| TissGeneMut for ANO7 |
| TissGeneSNV for ANO7 |
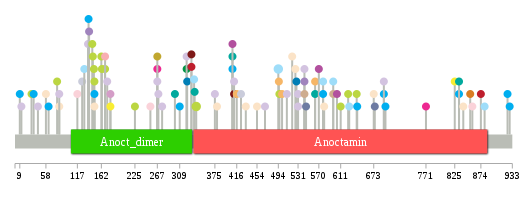
| nsSNV counts per each loci. Different colors of circles represent different cancer types. Circle size denotes number of samples. (TCGA somatic mutation (SNPs and small INDELs) data, version 2016-04-25) * Click on the image to enlarge it in a new window. |
 |
 |
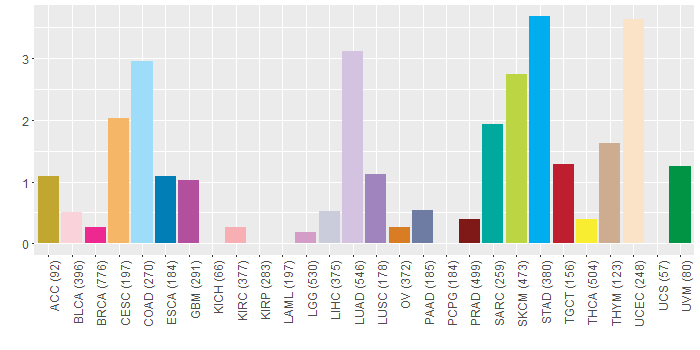
| Somatic nucleotide variants of TissGene across 28 cancer types (X-axis: cancer type and Y-axis: % of mutated samples) The numbers in parentheses are numbers of samples with mutation (nsSNVs). (TCGA somatic mutation (SNPs and small INDELs) data, version 2016-04-25) |
 |
| - nsSNVs sorted by frequency. |
| AAchange | Cancer type | # samples |
| p.G340E | SKCM | 2 |
| p.A494V | COAD | 2 |
| p.R543C | LUSC | 1 |
| p.R158C | HNSC | 1 |
| p.V375L | LUAD | 1 |
| p.L520M | UCEC | 1 |
| p.S501F | CESC | 1 |
| p.A408T | GBM | 1 |
| p.V424A | LIHC | 1 |
| p.R673W | UCEC | 1 |
| p.R531S | LUAD | 1 |
| p.V604I | GBM | 1 |
| p.A179T | THCA | 1 |
| p.Q126R | LIHC | 1 |
| p.R322C | UVM | 1 |
| p.A179T | LGG | 1 |
| p.P267L | ACC | 1 |
| p.W692* | LUAD | 1 |
| p.R148C | SKCM | 1 |
| p.R149C | STAD | 1 |
| p.G269S | LUAD | 1 |
| p.R337K | SARC | 1 |
| p.D31N | SKCM | 1 |
| p.Q12H | LUAD | 1 |
| p.L411M | PRAD | 1 |
| p.L411Q | LUAD | 1 |
| p.V570I | GBM | 1 |
| p.Q642* | STAD | 1 |
| p.V115I | CHOL | 1 |
| p.P331S | TGCT | 1 |
| p.T924M | STAD | 1 |
| p.R578H | COAD | 1 |
| p.A9V | STAD | 1 |
| p.W403X | DLBC | 1 |
| p.R543H | LUAD | 1 |
| p.L846I | READ | 1 |
| p.G163R | SKCM | 1 |
| p.W433C | UCEC | 1 |
| p.A526V | UCEC | 1 |
| p.D146N | SKCM | 1 |
| p.E117* | BLCA | 1 |
| p.A408T | SARC | 1 |
| p.A928V | STAD | 1 |
| p.C169S | KIRC | 1 |
| p.R495C | CESC | 1 |
| p.R336C | COAD | 1 |
| p.V597I | THYM | 1 |
| p.R309H | STAD | 1 |
| p.P267L | LUAD | 1 |
| p.E858K | BLCA | 1 |
| p.G83A | LUAD | 1 |
| p.A641V | SKCM | 1 |
| p.V597I | COAD | 1 |
| p.V854L | OV | 1 |
| p.I563N | CESC | 1 |
| p.S173R | LUAD | 1 |
| p.I379M | UCEC | 1 |
| p.H137Q | LUAD | 1 |
| p.K254N | BLCA | 1 |
| p.R79K | SKCM | 1 |
| p.G611S | SKCM | 1 |
| p.G771C | BRCA | 1 |
| p.W323X | ESCA | 1 |
| p.Y169H | SKCM | 1 |
| p.R149C | UCEC | 1 |
| p.A469P | LUAD | 1 |
| p.G83R | UCEC | 1 |
| p.S546N | PAAD | 1 |
| p.R675H | PAAD | 1 |
| p.A408T | STAD | 1 |
| p.F317L | HNSC | 1 |
| p.R833Q | STAD | 1 |
| p.T300S | SARC | 1 |
| p.R627C | COAD | 1 |
| p.P267R | BRCA | 1 |
| p.V528L | ESCA | 1 |
| p.P17S | HNSC | 1 |
| p.R496C | SKCM | 1 |
| p.R130L | COAD | 1 |
| p.P331L | PRAD | 1 |
| p.R416Q | CESC | 1 |
| p.T139N | LUSC | 1 |
| p.R141Q | HNSC | 1 |
| p.D145N | SKCM | 1 |
| p.A35T | STAD | 1 |
| p.R885Q | HNSC | 1 |
| p.H162N | SKCM | 1 |
| p.G625E | SKCM | 1 |
| p.E63D | STAD | 1 |
| p.P926S | HNSC | 1 |
| p.R825S | THCA | 1 |
| p.E485K | READ | 1 |
| p.R58Q | UCEC | 1 |
| p.V510L | LUAD | 1 |
| p.W692R | STAD | 1 |
| p.I563M | SARC | 1 |
| p.R543C | THYM | 1 |
| p.R149C | SKCM | 1 |
| p.Q841H | UCEC | 1 |
| p.P225L | SKCM | 1 |
| p.R531K | LUAD | 1 |
| p.L276P | LUAD | 1 |
| p.D695N | STAD | 1 |
| p.Q580P | UCEC | 1 |
| p.R322S | LUAD | 1 |
| p.E43Q | LUAD | 1 |
| p.C454Y | UCEC | 1 |
| p.R578H | STAD | 1 |
| p.R833W | SARC | 1 |
| p.R138M | STAD | 1 |
| p.V854I | HNSC | 1 |
| p.D874E | TGCT | 1 |
| p.I881M | COAD | 1 |
| Top |
| TissGeneCNV for ANO7 |
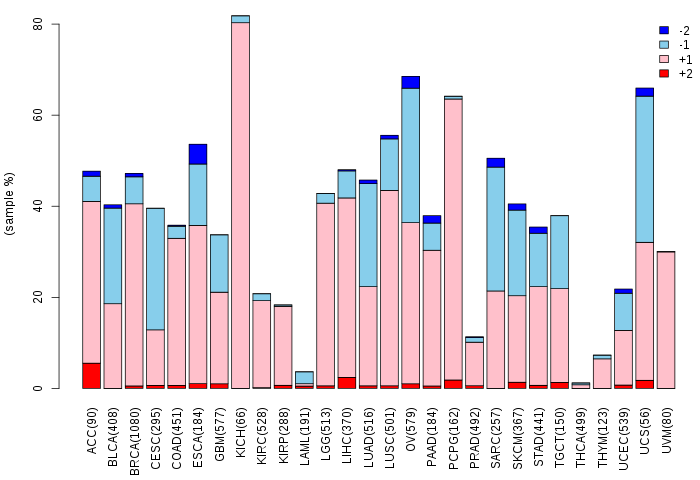
| Copy number variations of TissGene across 28 cancer types (X-axis: cancer type and Y-axis: % of CNV samples) (TCGA Gistic2_CopyNumber_Gistic2_all_data_by_genes, Gistic2 copy number data, version 2016-08-16) |
 |
| Top |
| TissGeneFusions for ANO7 |
| Fusion genes including TissGene (ChimerDB 3.0, 2016-12-01 and TCGA fusion Portal 2015-12-01) |
| Database | Src | Cancer type | Sample | Fusion gene | ORF | 5'-gene BP | 3'-gene BP |
| Chimerdb3.0 | FusionScan | SARC | TCGA-FX-A3RE-01A | ANO7-SEPT2 | In-Frame | chr2:242157796 | chr2:242285580 |
| Chimerdb3.0 | FusionScan | ESCA | TCGA-L5-A891-01A | ANO7-HDLBP | CDS-5'UTR | chr2:242157796 | chr2:242207956 |
| Top |
| TissGeneNet for ANO7 |
| Co-expressed gene networks based on protein-protein interaction data (CePIN) (TCGA IlluminaHiSeq_RNASeqV2, pan-cancer normalized log2(norm_counts+1) data, version 2016-08-16) (PINA2 ppi data) |
| Top |
| TissGeneProg for ANO7 |
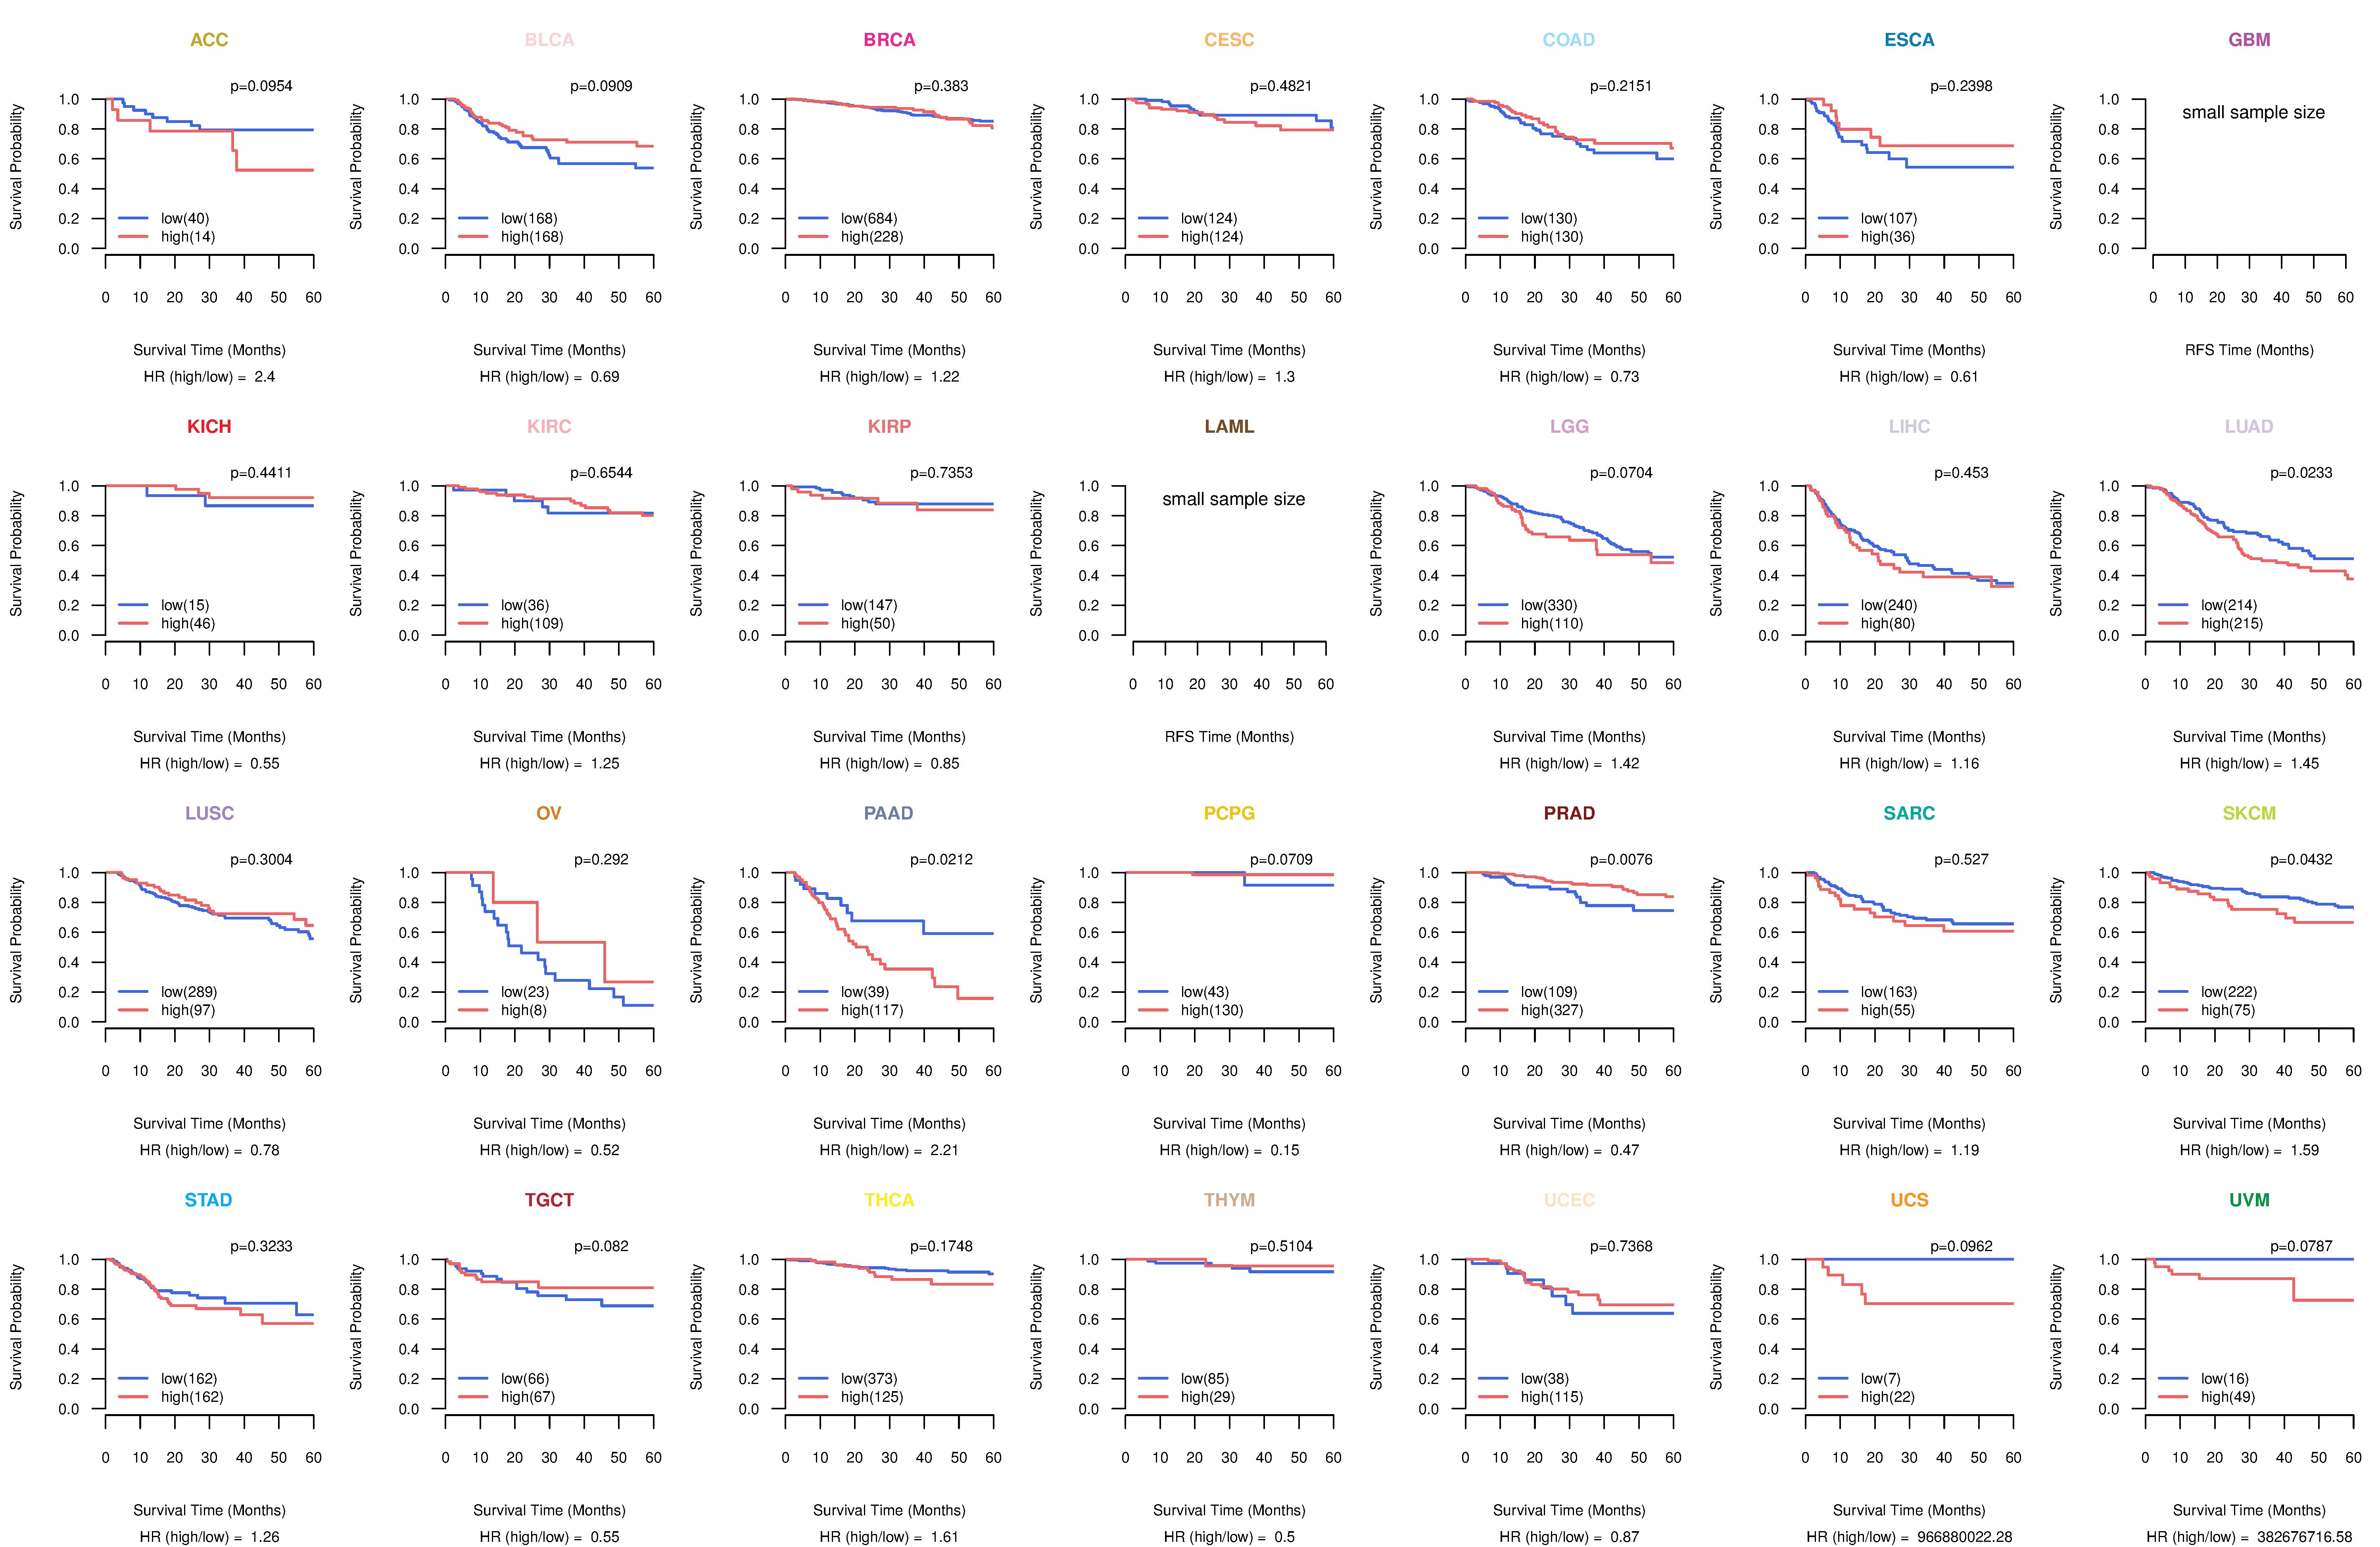
| Kaplan-Meier plots with logrank tests of overall survival (OS) using 28 cancer types (TCGA IlluminaHiSeq_RNASeqV2, pan-cancer normalized log2(norm_counts+1) data, version 2016-08-16) (TCGA clinicalMatrix, phenotype data, version 2016-04-27) * Click on the image to enlarge it in a new window. |
 |
| Kaplan-Meier plots with logrank test of relapse free survival (RFS) using 28 cancer types (TCGA IlluminaHiSeq_RNASeqV2, pan-cancer normalized log2(norm_counts+1) data, version 2016-08-16) (TCGA clinicalMatrix, phenotype data, version 2016-04-27) * Click on the image enlarge it in a new window. |
 |
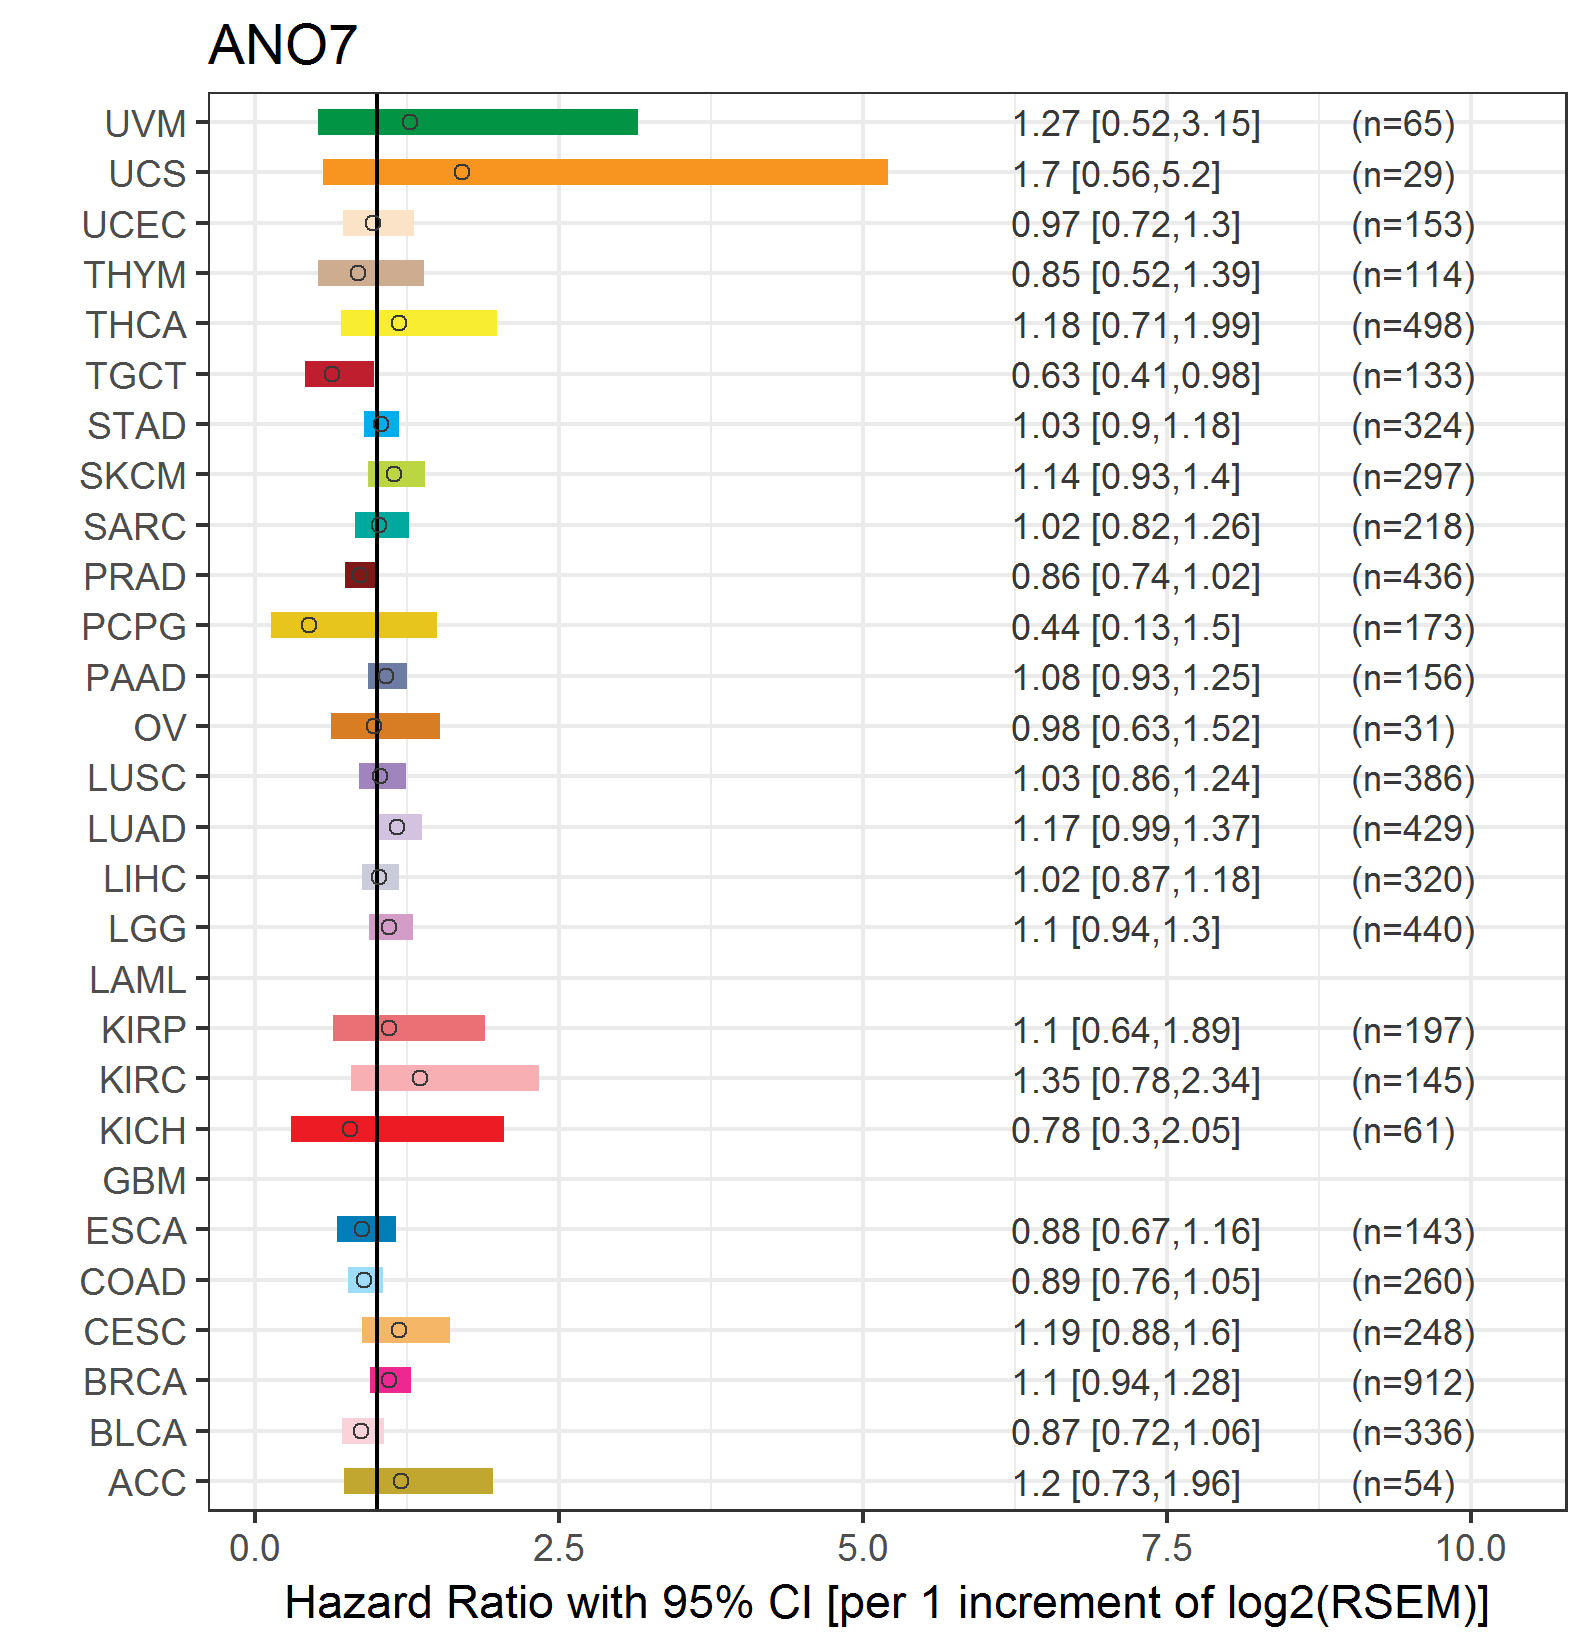
| Forest plot of Cox proportional hazard ratio (HR) and 95% CI of overall survival (OS) using 28 cancer types (TCGA IlluminaHiSeq_RNASeqV2, pan-cancer normalized log2(norm_counts+1) data, version 2016-08-16) (TCGA clinicalMatrix, phenotype data, version 2016-04-27) * Click on the image enlarge it in a new window. |
 |
| Forest plot of Cox proportional hazard ratio (HR) and 95% CI of relapse free survival (RFS) using 28 cancer types (TCGA IlluminaHiSeq_RNASeqV2, pan-cancer normalized log2(norm_counts+1) data, version 2016-08-16) (TCGA clinicalMatrix, phenotype data, version 2016-04-27) * Click on the image enlarge it in a new window. |
 |
| Top |
| TissGeneClin for ANO7 |
| TissGeneDrug for ANO7 |
| Drug information targeting TissGene (DrugBank Version 5.0.6, 2017-04-01) |
| DrugBank ID | Drug name | Drug activity | Drug type | Drug status |
| Top |
| TissGeneDisease for ANO7 |
| Disease information associated with TissGene (DisGeNet, 2016-06-01) |
| Disease ID | Disease name | # pubmeds | Source |
| umls:C0376358 | Malignant neoplasm of prostate | 3 | BeFree |
| umls:C0600139 | Prostate carcinoma | 3 | BeFree |
| umls:C0033578 | Prostatic Neoplasms | 2 | LHGDN |
| umls:C0001418 | Adenocarcinoma | 1 | BeFree |
|
Copyright 2016-Present - The University of Texas Health Science Center at Houston (UTHealth) Web File Viewing | How to Report, Fraud, Waste and Abuse | State of Texas | Statewide Search | Texas Homeland Security | Site Policies |