 |
| |
| |
| |
| |
| |
| |
|

| TissGeneSummary for DHH |
 Gene summary Gene summary |
| Basic gene information | Gene symbol | DHH |
| Gene name | desert hedgehog | |
| Synonyms | GDXYM|HHG-3|SRXY7 | |
| Cytomap | UCSC genome browser: 12q13.1 | |
| Type of gene | protein-coding | |
| RefGenes | NM_021044.2, | |
| Description | desert hedgehog homologdesert hedgehog proteinmutant desert hedgehog | |
| Modification date | 20141219 | |
| dbXrefs | MIM : 605423 | |
| HGNC : HGNC | ||
| Ensembl : ENSG00000139549 | ||
| HPRD : 05664 | ||
| Vega : OTTHUMG00000170408 | ||
| Protein | UniProt: go to UniProt's Cross Reference DB Table | |
| Expression | CleanEX: HS_DHH | |
| BioGPS: 50846 | ||
| Pathway | NCI Pathway Interaction Database: DHH | |
| KEGG: DHH | ||
| REACTOME: DHH | ||
| Pathway Commons: DHH | ||
| Context | iHOP: DHH | |
| ligand binding site mutation search in PubMed: DHH | ||
| UCL Cancer Institute: DHH | ||
| Assigned class in TissGDB* | C | |
| Included tissue-specific gene expression resources | HPA,GTEx | |
| Specific-tissues in normal samples (assigned by TissGDB using HPA, TiGER, and GTEx) | Testis | |
| Cancer types related to the specific-tissues in cancer samples (assigned by TissGDB using TCGA) | TGCT | |
| Reference showing the relevant tissue of DHH | ||
| Description by TissGene annotations | Cancer gene | |
| * Class A consists of genes with literature evidence and is part of the cTissGenes. Class B consists of only cTissGenes without additional evidence. The remaining genes belong to Class C. |
| Gene ontology having evidence of Inferred from Direct Assay (IDA) from Entrez |
| GO ID | GO term | PubMed ID |
| Top |
| TissGeneExp for DHH |
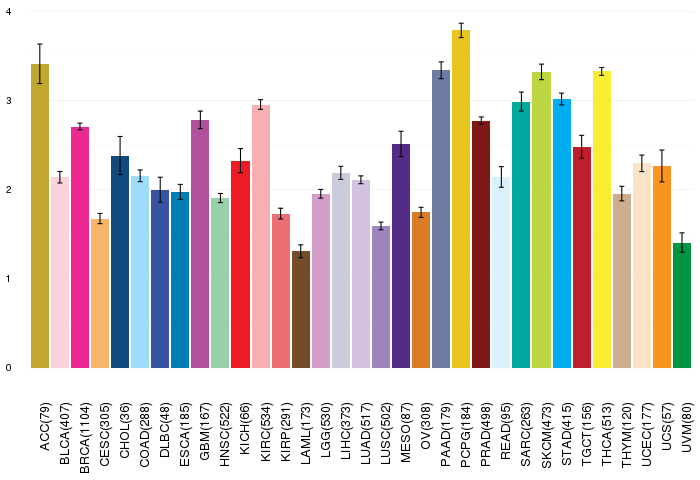
| Gene expressions across 28 cancer types (X-axis: cancer type and Y-axis: log2(norm_counts+1)) (TCGA IlluminaHiSeq_RNASeqV2, pan-cancer normalized log2(norm_counts+1) data, version 2016-08-16) |
 |
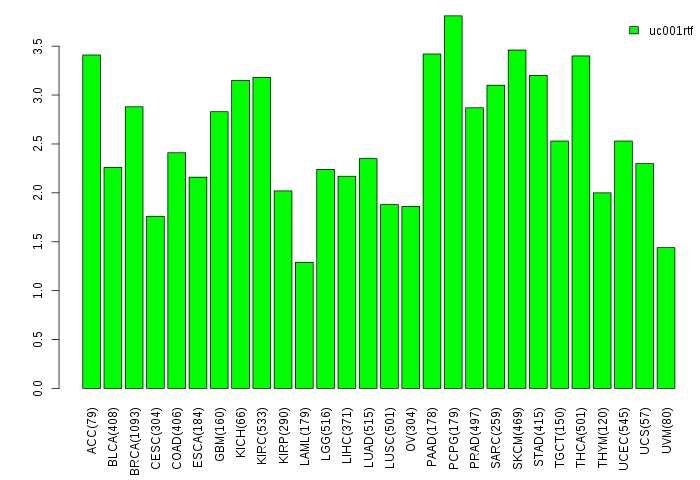
| Gene isoform expressions across 28 cancer types (X-axis: cancer type and Y-axis: log2(norm_counts+1)) (TCGA pan-cancer tcga_rsem_isoform_tpm, version 2016-09-01) |
 |
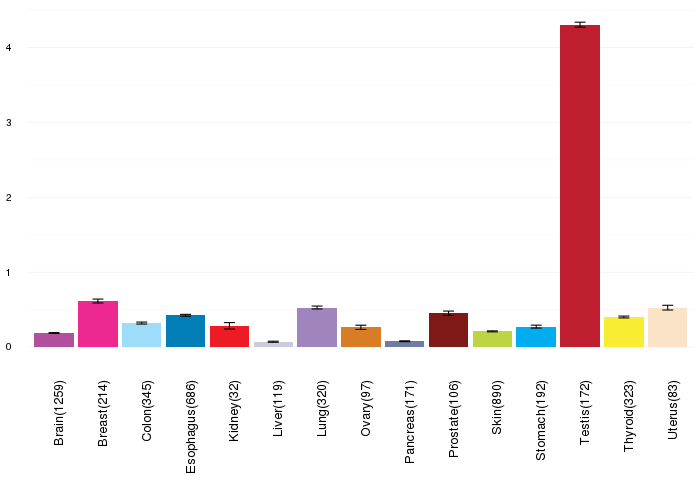
| Gene expressions across normal tissues of GTEx data (GTEx GTEx_Analysis_v6_RNA-seq_RNA-SeQCv1.1.8_gene_rpkm.gct) - Here, we shows the matched tissue types only among our 28 cancer types. |
 |
| Different expressions across 14 cancer types with more than 10 samples between matched tumors and normals (X-axis: cancer type and Y-axis: log2(norm_counts+1)) (TCGA IlluminaHiSeq_RNASeqV2, pan-cancer normalized log2(norm_counts+1) data, version 2016-08-16) |
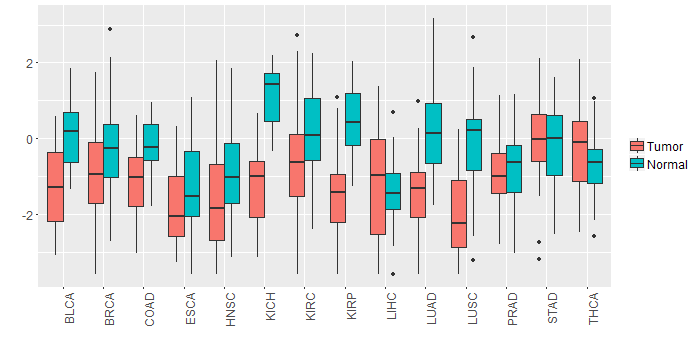 |
| - Significantly differentially expressed cancer types and information. (|Fold change|>1 and FDR<0.05) |
| Cancer type | Mean(exp) in tumor | Mean(exp) in matched normal | Log2FC | P-val. | FDR |
| LUSC | -2.00255654 | -0.08268007 | -1.919876471 | 8.19E-14 | 4.32E-13 |
| LUAD | -1.403392206 | 0.186521587 | -1.589913793 | 4.20E-13 | 3.41E-12 |
| KICH | -1.223314344 | 1.184089656 | -2.407404 | 2.88E-12 | 3.11E-11 |
| KIRP | -1.543241344 | 0.434124281 | -1.977365625 | 1.54E-10 | 1.68E-09 |
| BLCA | -1.208029502 | 0.108165235 | -1.316194737 | 0.000293 | 0.002648911 |
| Top |
| TissGene-miRNA for DHH |
| Significantly anti-correlated miRNAs of TissGene across 28 cancer types (Gene-miRNA relations from TargetScanHuman Relsease 7.1, Conserved_Site_Context_Scores.txt.zip, 06.01.2016) (TCGA IlluminaHiSeq_miRNASeq, log2(RPM+1) data, version 2016-11-21) (TCGA IlluminaHiSeq_RNASeqV2, log2(normalized_count+1) data, version 2016-08-16) (Spearman’s Rank Correlation (p-value<0.05 and coefficient<-0.25)) |
| Cancer type | miRNA id | miRNA accession | P-val. | Coeff. | # samples |
| Top |
| TissGeneMut for DHH |
| TissGeneSNV for DHH |
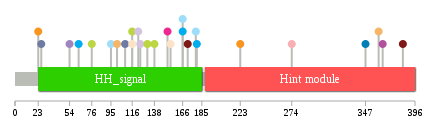
| nsSNV counts per each loci. Different colors of circles represent different cancer types. Circle size denotes number of samples. (TCGA somatic mutation (SNPs and small INDELs) data, version 2016-04-25) * Click on the image to enlarge it in a new window. |
 |
 |
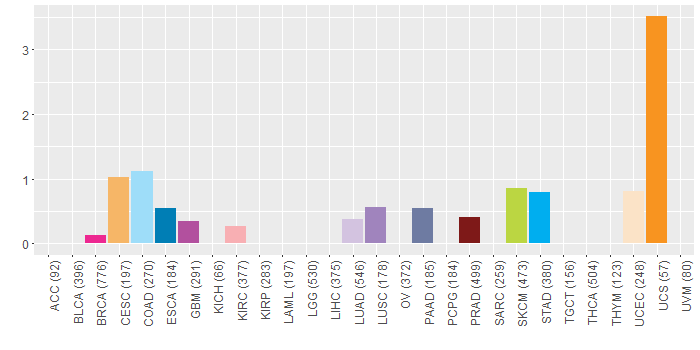
| Somatic nucleotide variants of TissGene across 28 cancer types (X-axis: cancer type and Y-axis: % of mutated samples) The numbers in parentheses are numbers of samples with mutation (nsSNVs). (TCGA somatic mutation (SNPs and small INDELs) data, version 2016-04-25) |
 |
| - nsSNVs sorted by frequency. |
| AAchange | Cancer type | # samples |
| p.D138N | SKCM | 1 |
| p.R124Q | LUAD | 1 |
| p.R179C | COAD | 1 |
| p.S139P | HNSC | 1 |
| p.L360F | CESC | 1 |
| p.D223Y | UCS | 1 |
| p.N116S | UCEC | 1 |
| p.A166T | STAD | 1 |
| p.N116S | SKCM | 1 |
| p.C23Y | UCS | 1 |
| p.R154H | UCEC | 1 |
| p.N180S | STAD | 1 |
| p.A95T | COAD | 1 |
| p.F274I | KIRC | 1 |
| p.A63V | STAD | 1 |
| p.G26D | PAAD | 1 |
| p.L347M | ESCA | 1 |
| p.A109T | PAAD | 1 |
| p.E54Q | LUSC | 1 |
| p.S384P | CHOL | 1 |
| p.H364Y | GBM | 1 |
| p.F171L | PRAD | 1 |
| p.A166T | COAD | 1 |
| p.E131K | SKCM | 1 |
| p.S384F | PRAD | 1 |
| p.R122H | LUAD | 1 |
| p.T151M | BRCA | 1 |
| p.E101K | CESC | 1 |
| p.D76N | SKCM | 1 |
| Top |
| TissGeneCNV for DHH |
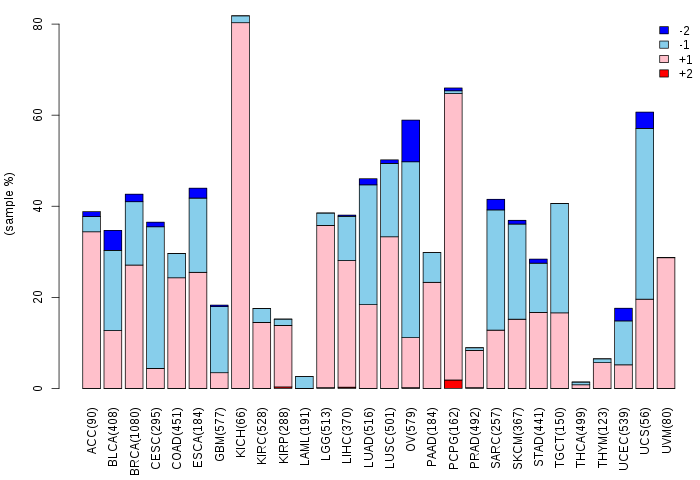
| Copy number variations of TissGene across 28 cancer types (X-axis: cancer type and Y-axis: % of CNV samples) (TCGA Gistic2_CopyNumber_Gistic2_all_data_by_genes, Gistic2 copy number data, version 2016-08-16) |
 |
| Top |
| TissGeneFusions for DHH |
| Fusion genes including TissGene (ChimerDB 3.0, 2016-12-01 and TCGA fusion Portal 2015-12-01) |
| Database | Src | Cancer type | Sample | Fusion gene | ORF | 5'-gene BP | 3'-gene BP |
| Top |
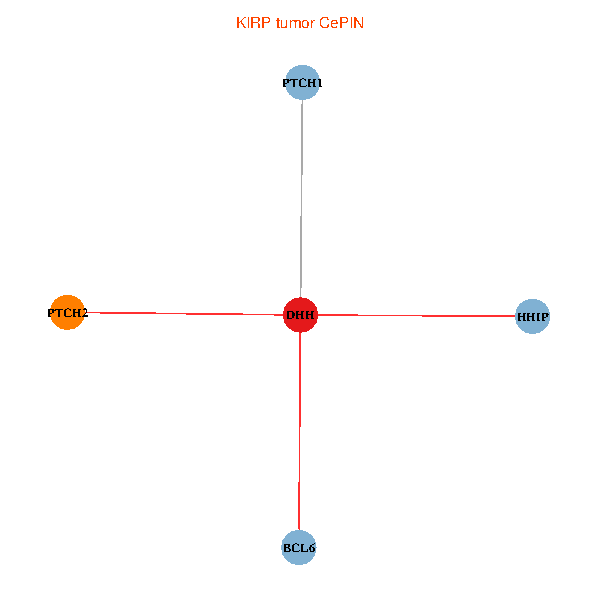
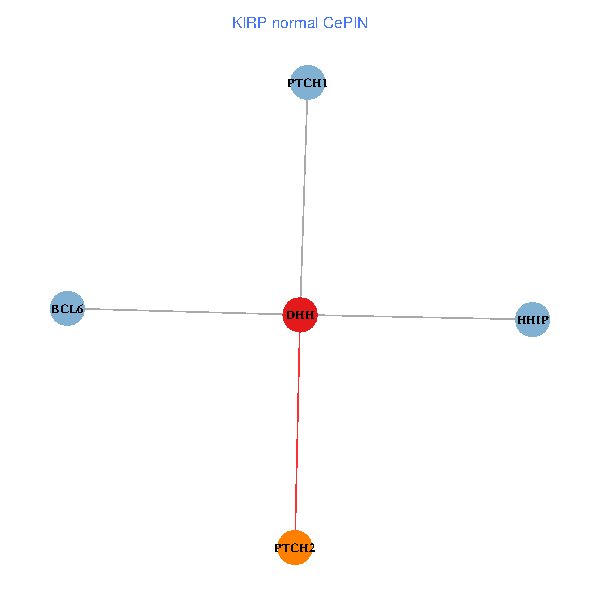
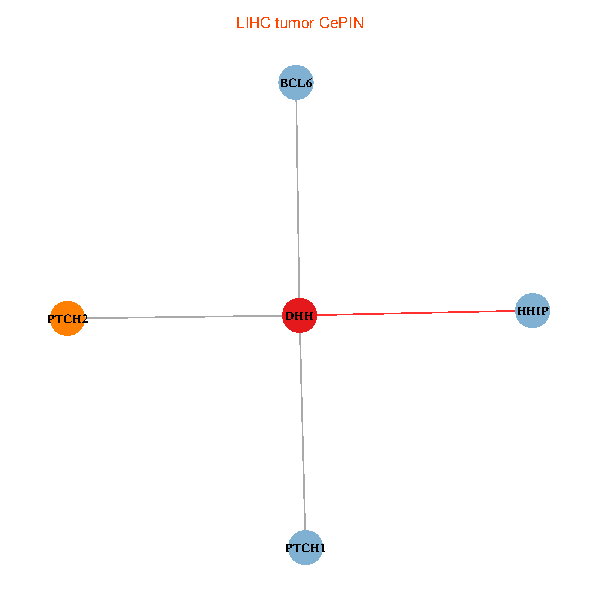
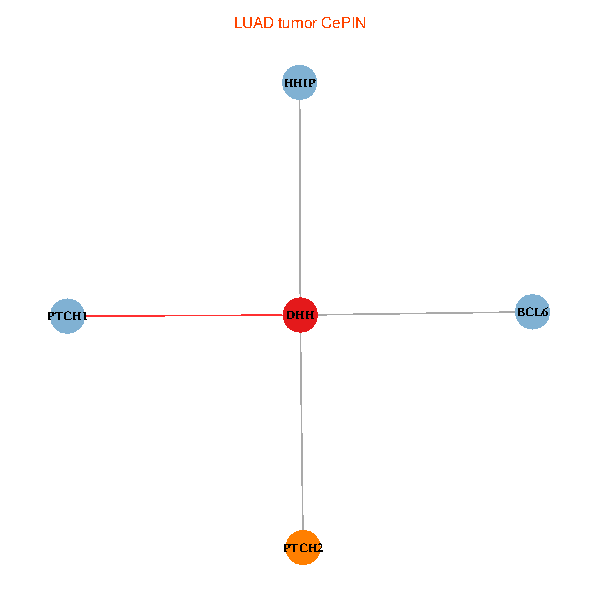
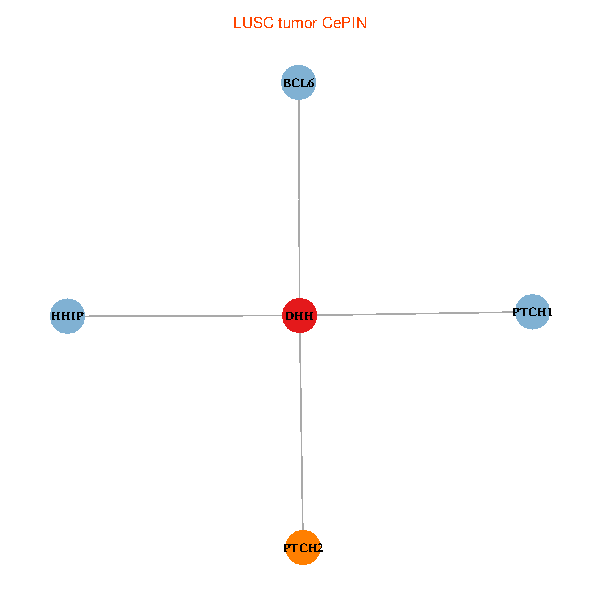
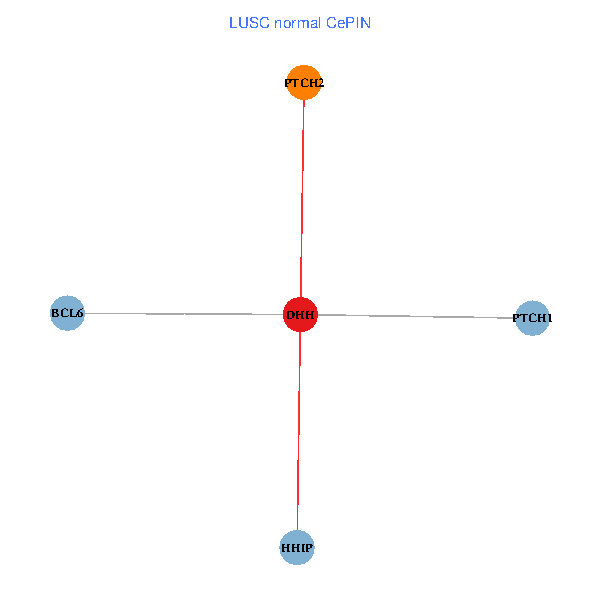
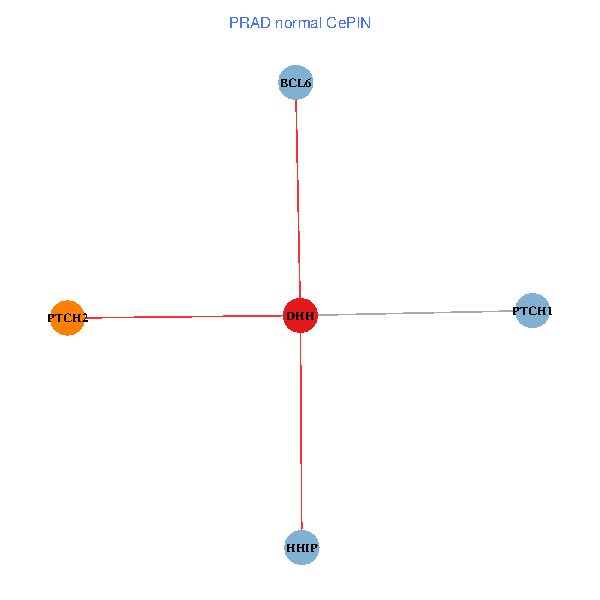
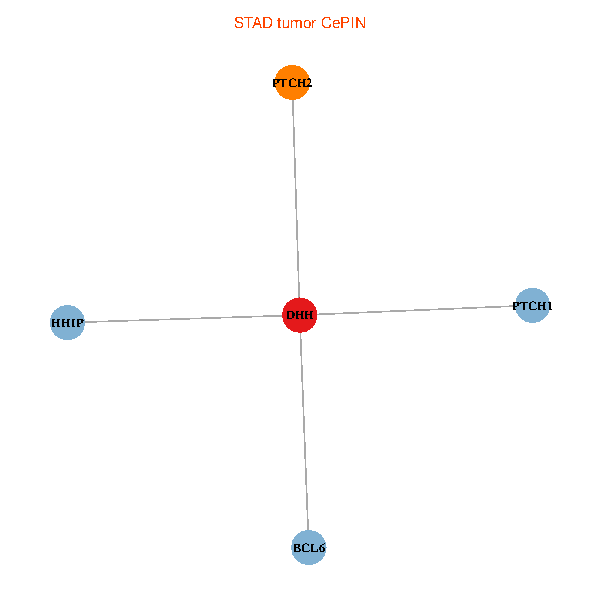
| TissGeneNet for DHH |
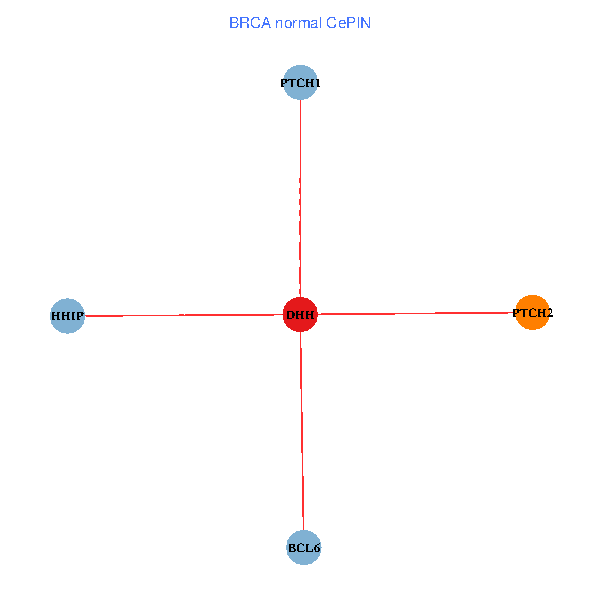
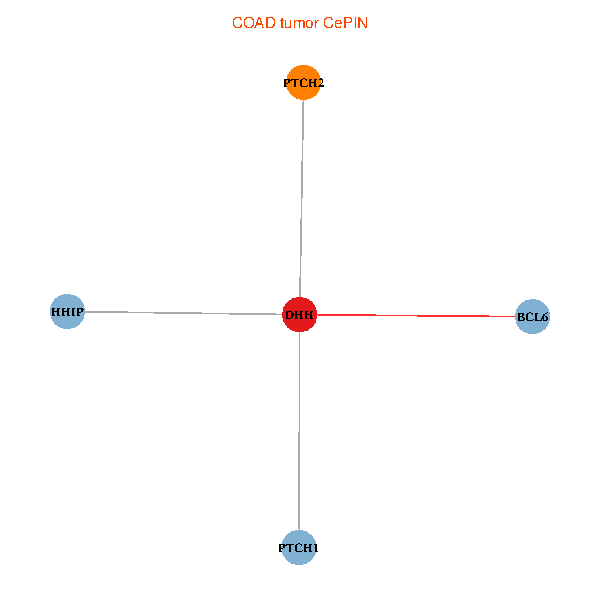
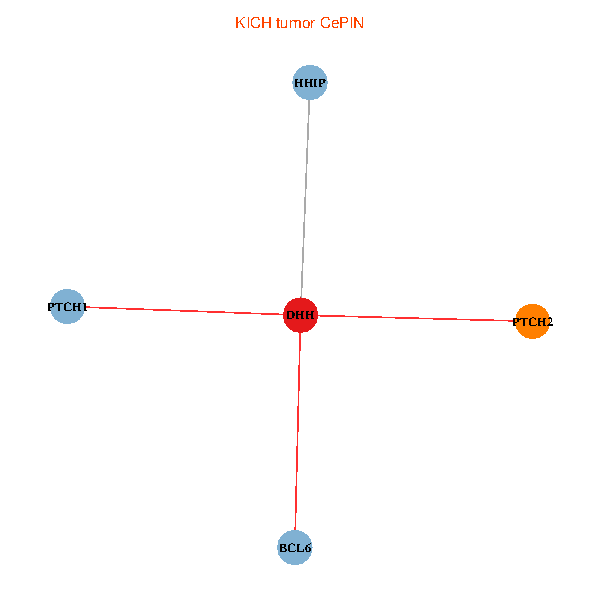
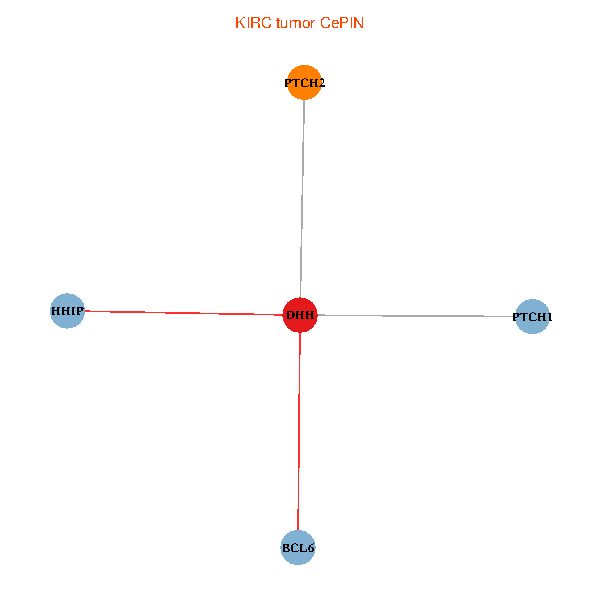
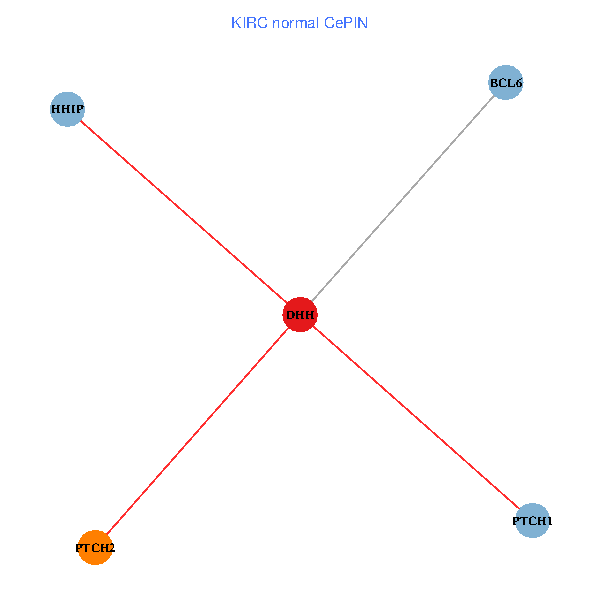
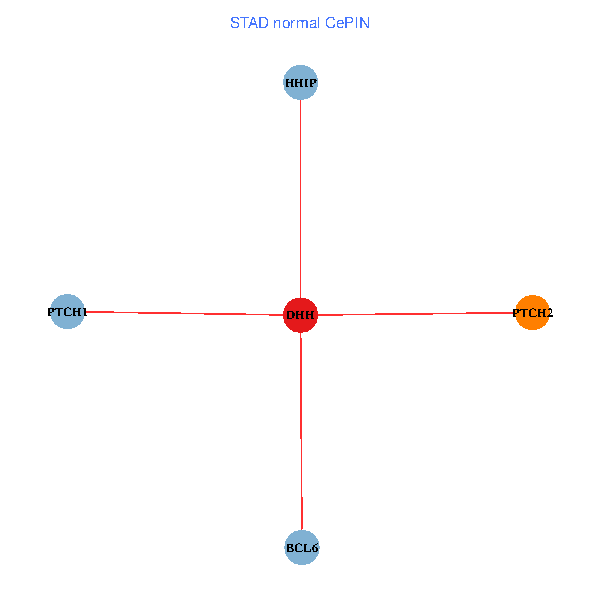
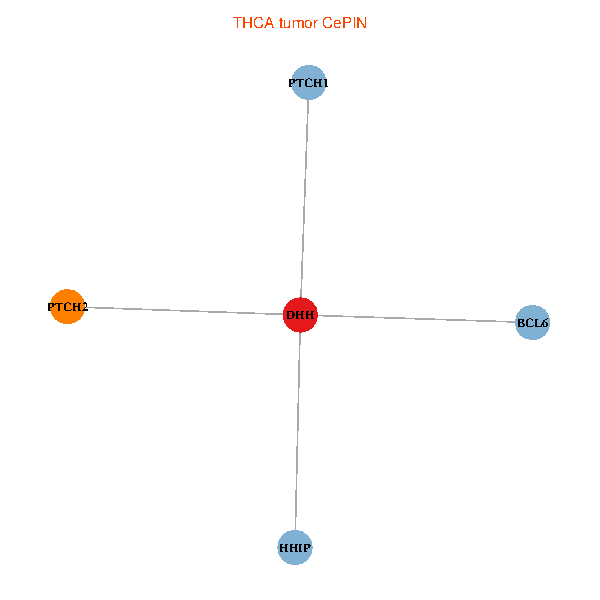
| Co-expressed gene networks based on protein-protein interaction data (CePIN) (TCGA IlluminaHiSeq_RNASeqV2, pan-cancer normalized log2(norm_counts+1) data, version 2016-08-16) (PINA2 ppi data) |
| BRCA (tumor) | BRCA (normal) |
| DHH, BCL6, HHIP, PTCH2, PTCH1 (tumor) | DHH, BCL6, HHIP, PTCH2, PTCH1 (normal) |
 |  |
| COAD (tumor) | COAD (normal) |
| DHH, BCL6, HHIP, PTCH2, PTCH1 (tumor) | DHH, BCL6, HHIP, PTCH2, PTCH1 (normal) |
 |  |
| HNSC (tumor) | HNSC (normal) |
| DHH, BCL6, HHIP, PTCH2, PTCH1 (tumor) | DHH, BCL6, HHIP, PTCH2, PTCH1 (normal) |
 |  |
| KICH (tumor) | KICH (normal) |
| DHH, BCL6, HHIP, PTCH2, PTCH1 (tumor) | DHH, BCL6, HHIP, PTCH2, PTCH1 (normal) |
 |  |
| KIRC (tumor) | KIRC (normal) |
| DHH, BCL6, HHIP, PTCH2, PTCH1 (tumor) | DHH, BCL6, HHIP, PTCH2, PTCH1 (normal) |
 |  |
| KIRP (tumor) | KIRP (normal) |
| DHH, BCL6, HHIP, PTCH2, PTCH1 (tumor) | DHH, BCL6, HHIP, PTCH2, PTCH1 (normal) |
 |  |
| LIHC (tumor) | LIHC (normal) |
| DHH, BCL6, HHIP, PTCH2, PTCH1 (tumor) | DHH, BCL6, HHIP, PTCH2, PTCH1 (normal) |
 |  |
| LUAD (tumor) | LUAD (normal) |
| DHH, BCL6, HHIP, PTCH2, PTCH1 (tumor) | DHH, BCL6, HHIP, PTCH2, PTCH1 (normal) |
 |  |
| LUSC (tumor) | LUSC (normal) |
| DHH, BCL6, HHIP, PTCH2, PTCH1 (tumor) | DHH, BCL6, HHIP, PTCH2, PTCH1 (normal) |
 |  |
| PRAD (tumor) | PRAD (normal) |
| DHH, BCL6, HHIP, PTCH2, PTCH1 (tumor) | DHH, BCL6, HHIP, PTCH2, PTCH1 (normal) |
 |  |
| STAD (tumor) | STAD (normal) |
| DHH, BCL6, HHIP, PTCH2, PTCH1 (tumor) | DHH, BCL6, HHIP, PTCH2, PTCH1 (normal) |
 |  |
| THCA (tumor) | THCA (normal) |
| DHH, BCL6, HHIP, PTCH2, PTCH1 (tumor) | DHH, BCL6, HHIP, PTCH2, PTCH1 (normal) |
 |  |
| Top |
| TissGeneProg for DHH |
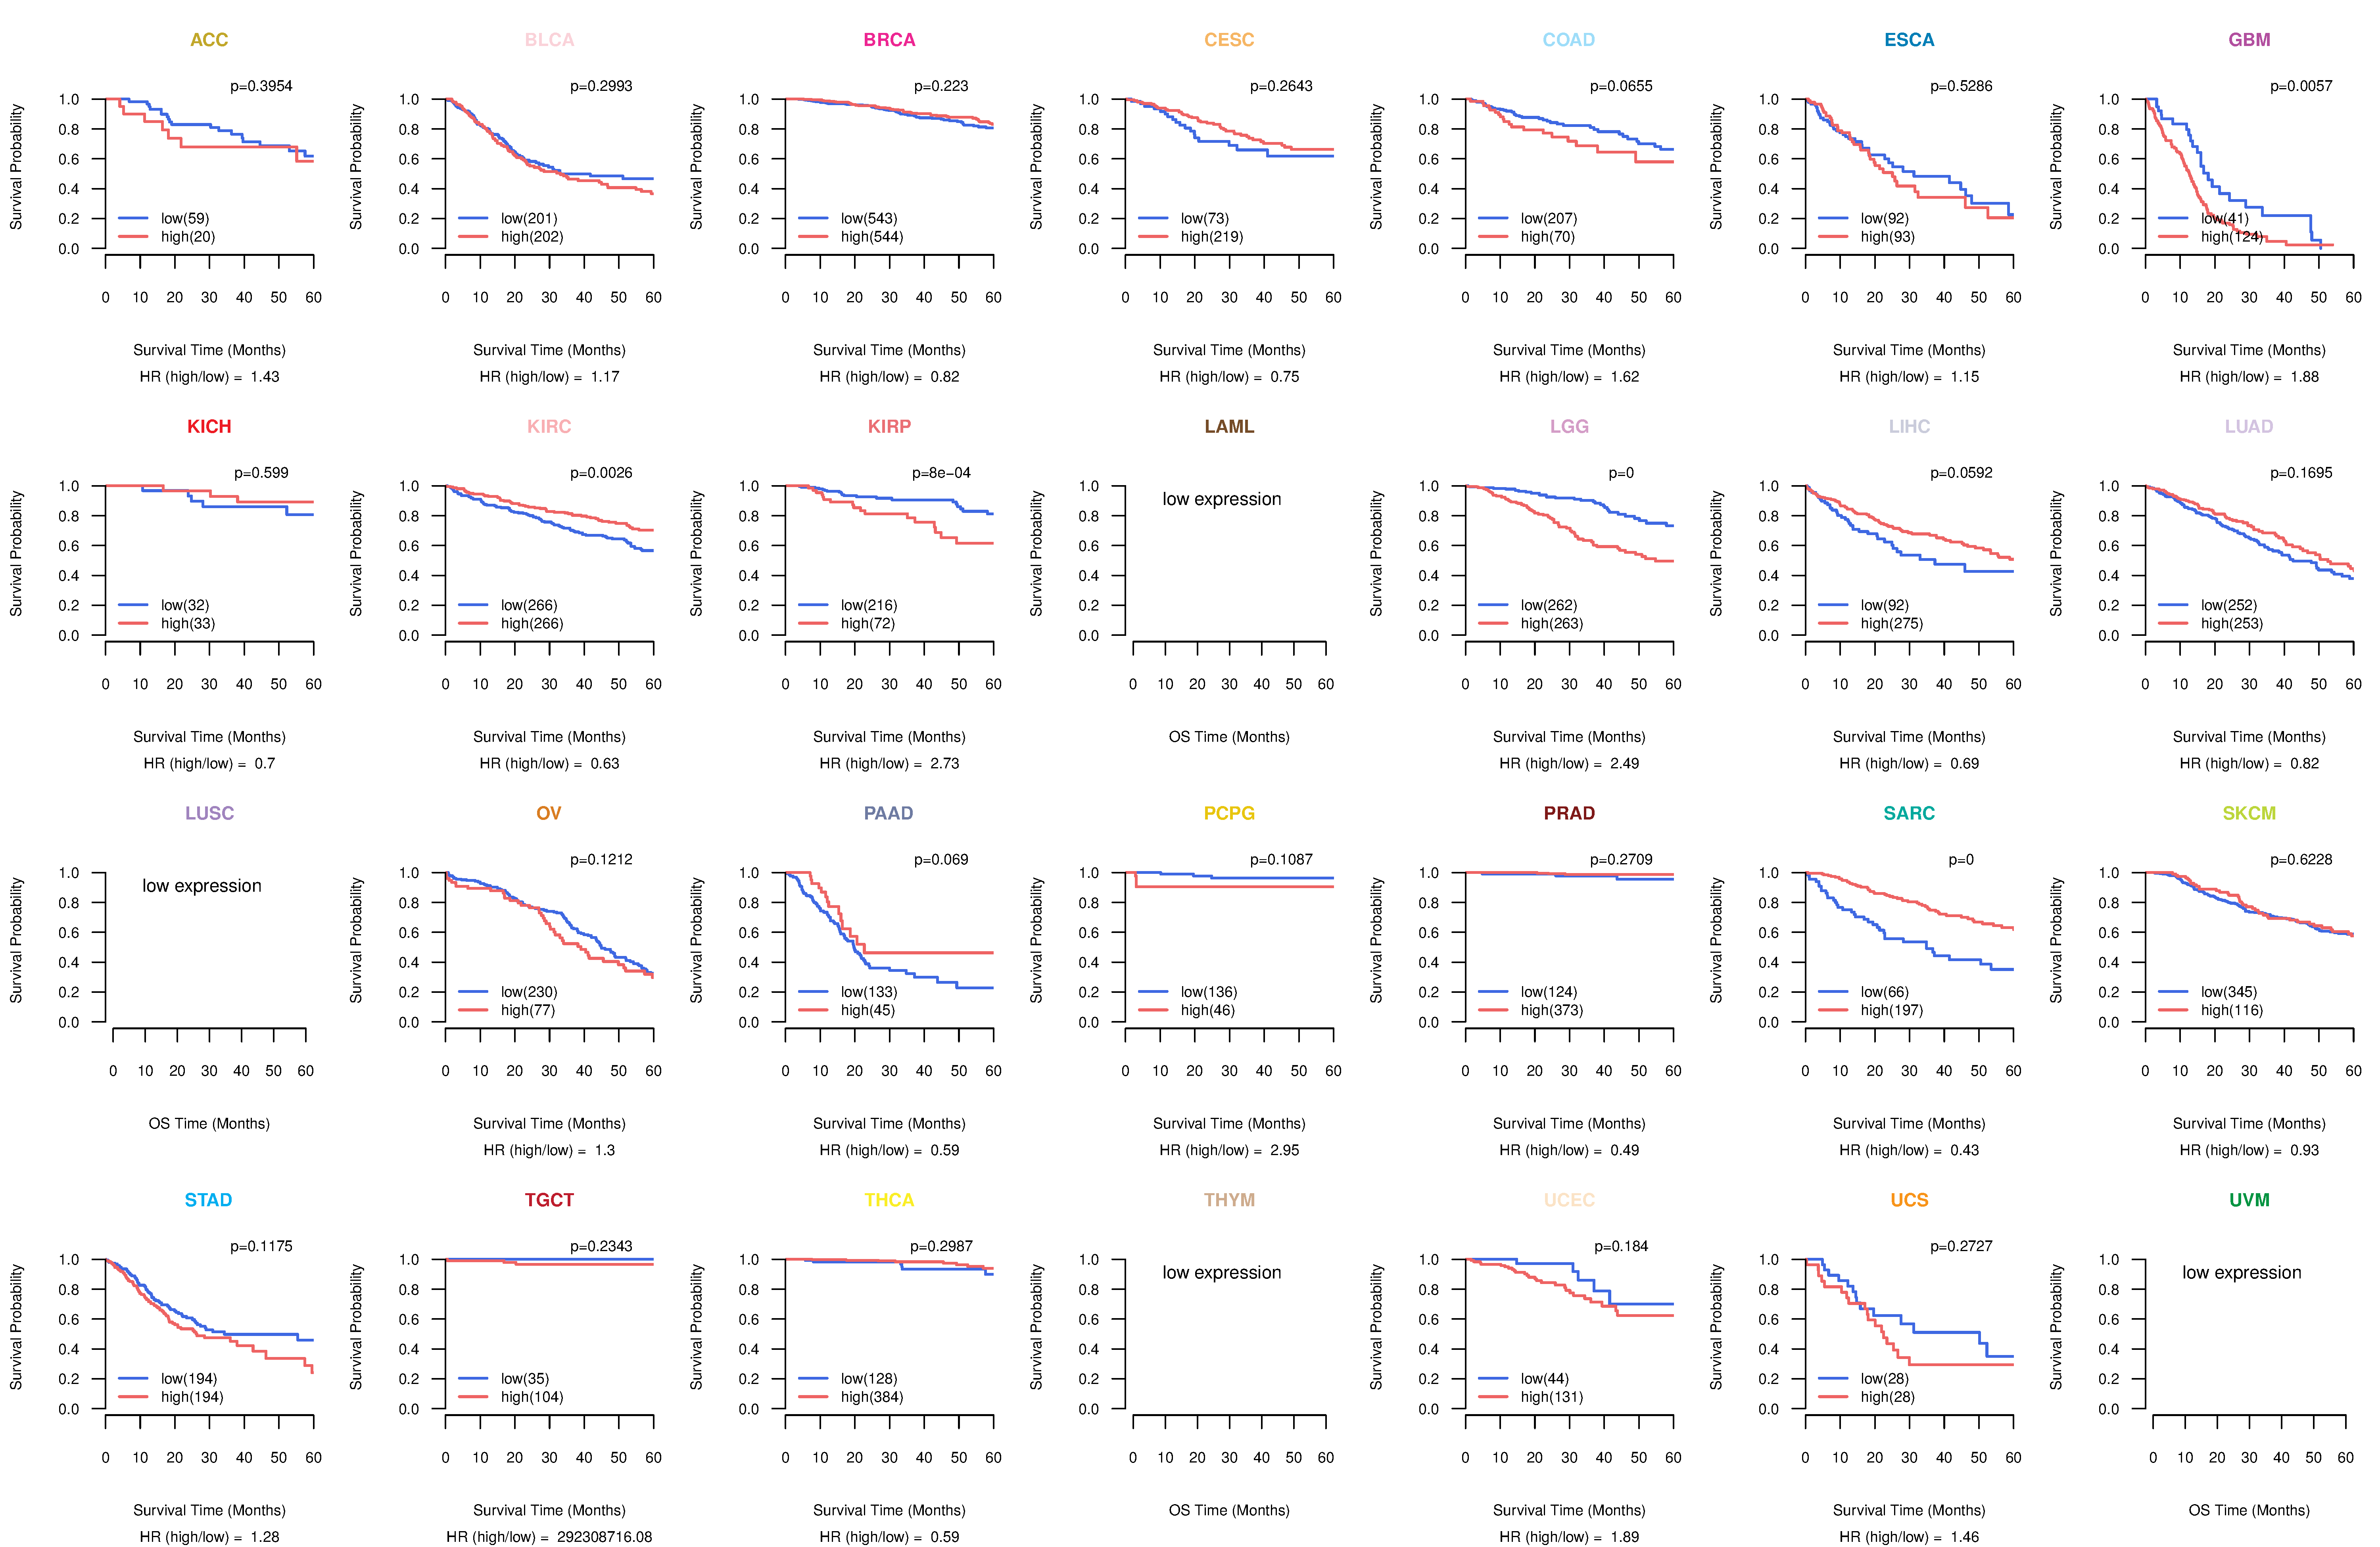
| Kaplan-Meier plots with logrank tests of overall survival (OS) using 28 cancer types (TCGA IlluminaHiSeq_RNASeqV2, pan-cancer normalized log2(norm_counts+1) data, version 2016-08-16) (TCGA clinicalMatrix, phenotype data, version 2016-04-27) * Click on the image to enlarge it in a new window. |
 |
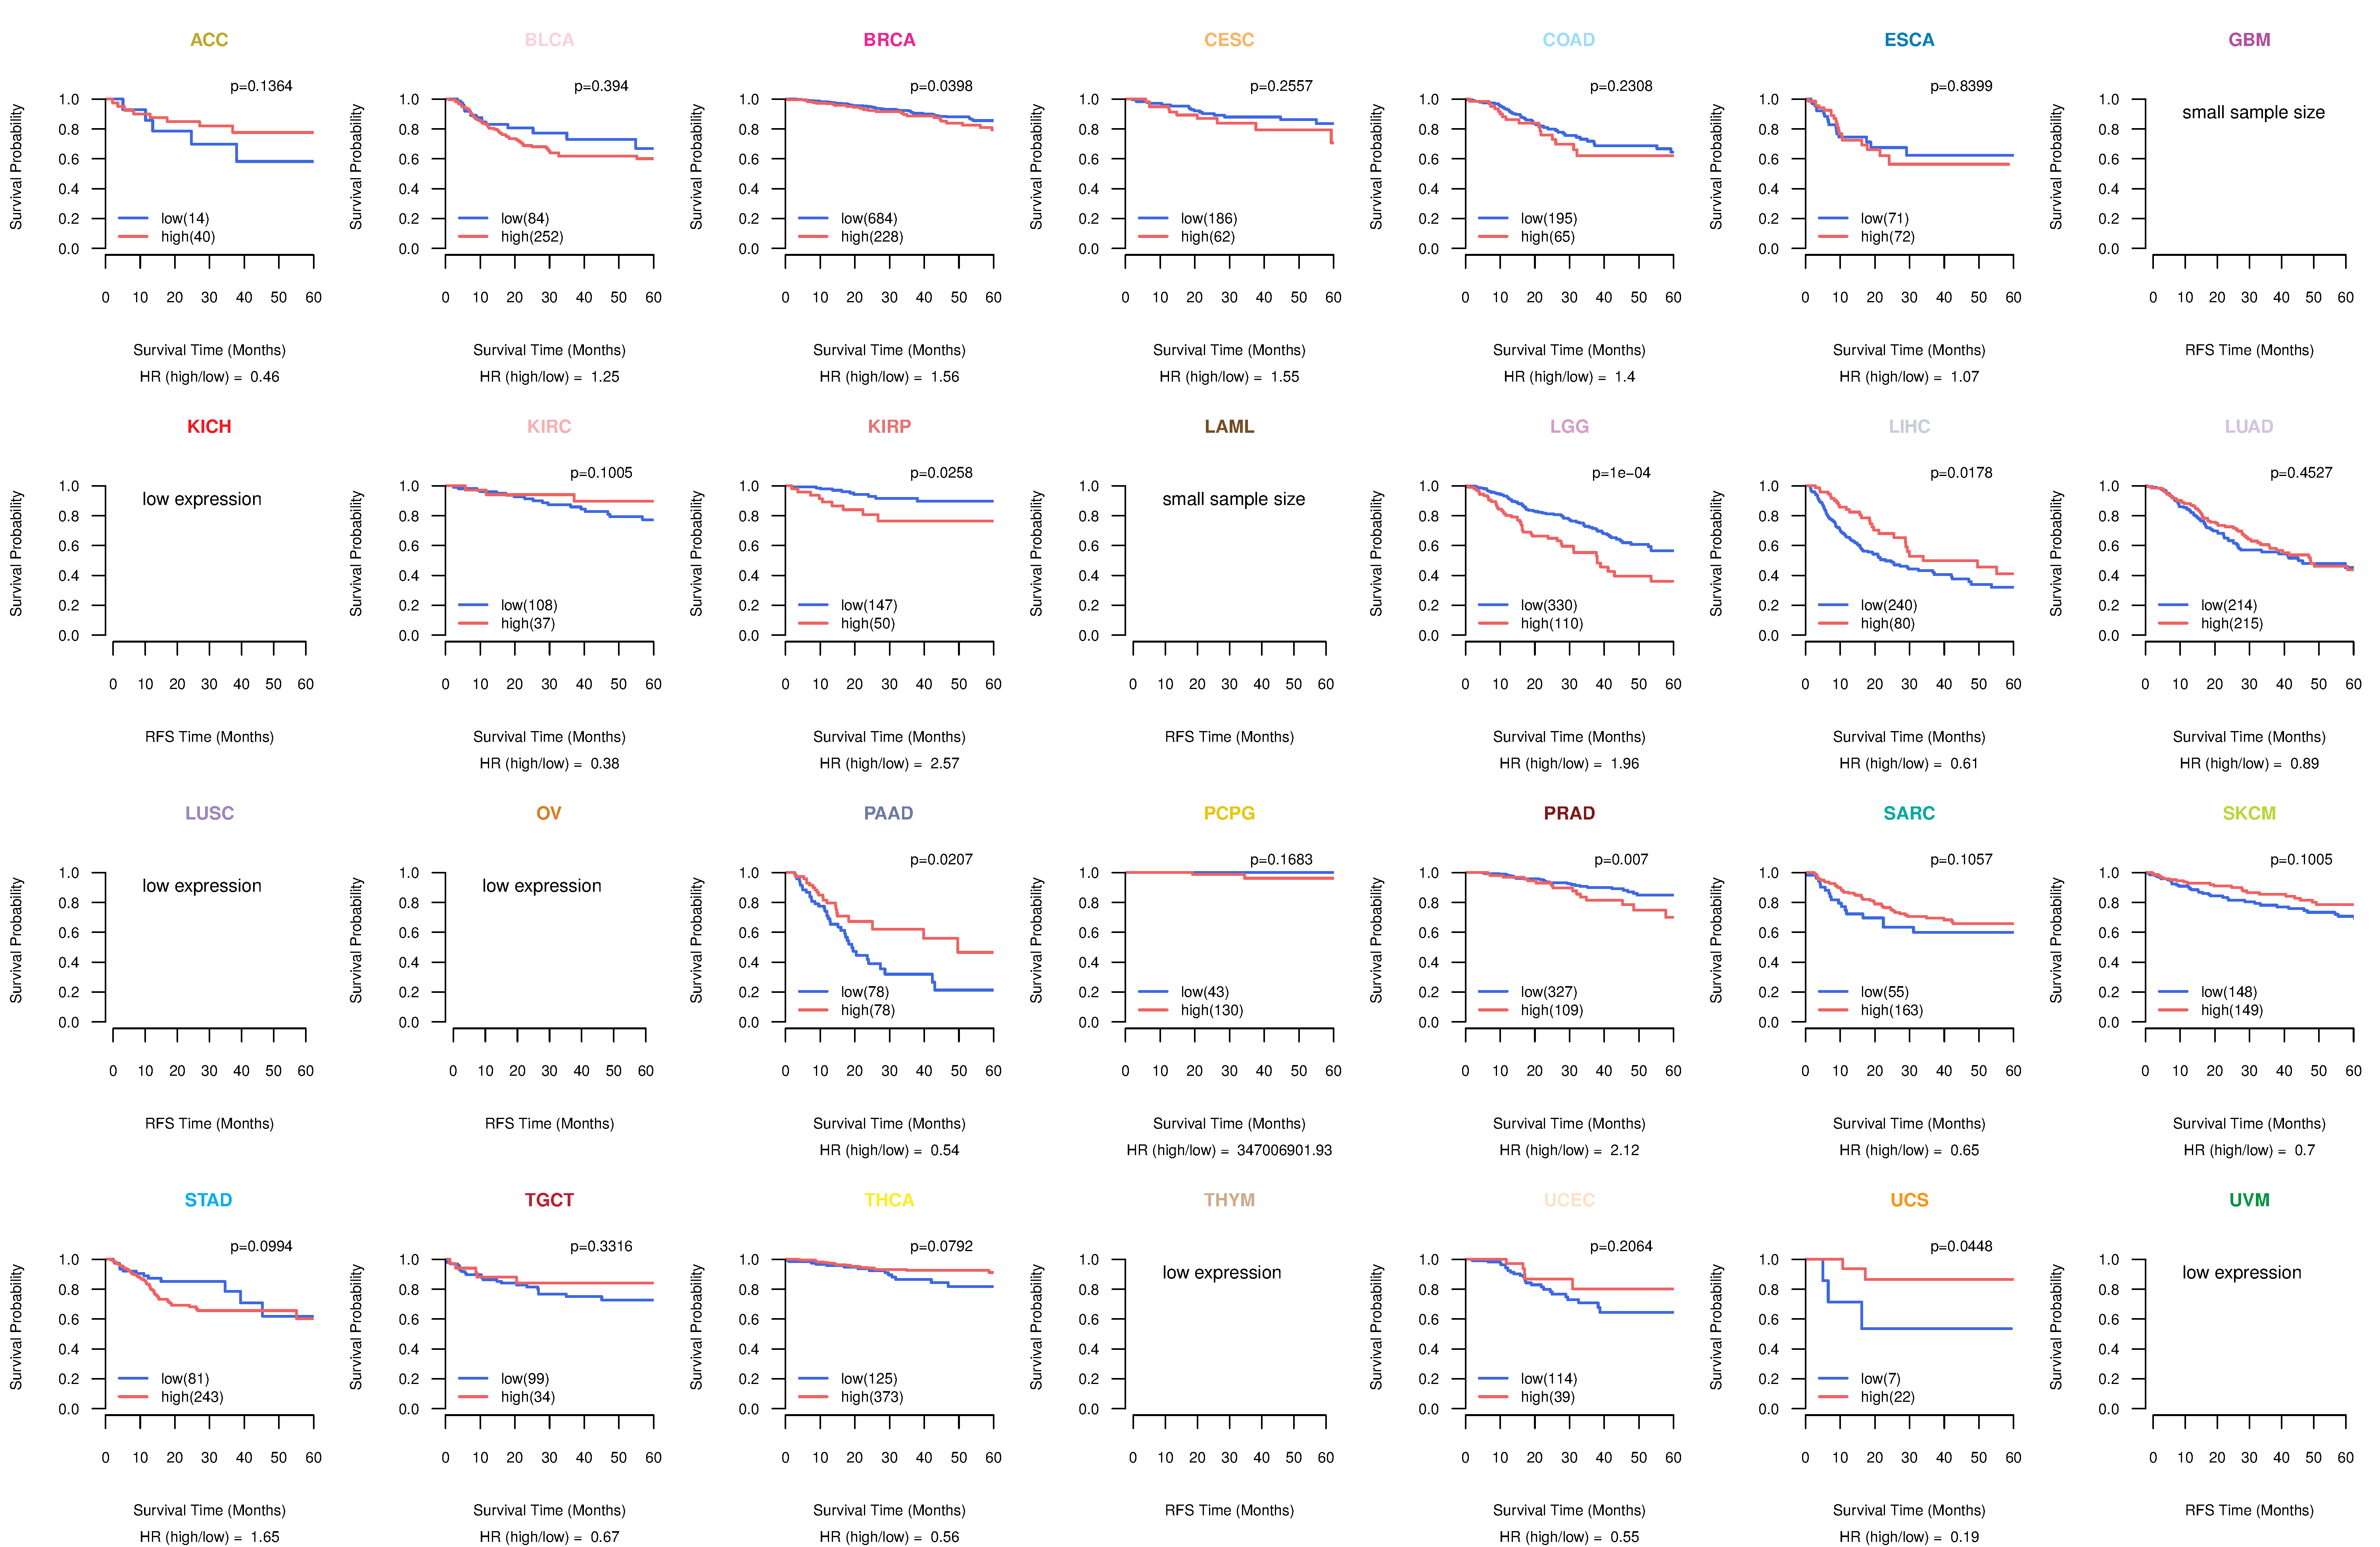
| Kaplan-Meier plots with logrank test of relapse free survival (RFS) using 28 cancer types (TCGA IlluminaHiSeq_RNASeqV2, pan-cancer normalized log2(norm_counts+1) data, version 2016-08-16) (TCGA clinicalMatrix, phenotype data, version 2016-04-27) * Click on the image enlarge it in a new window. |
 |
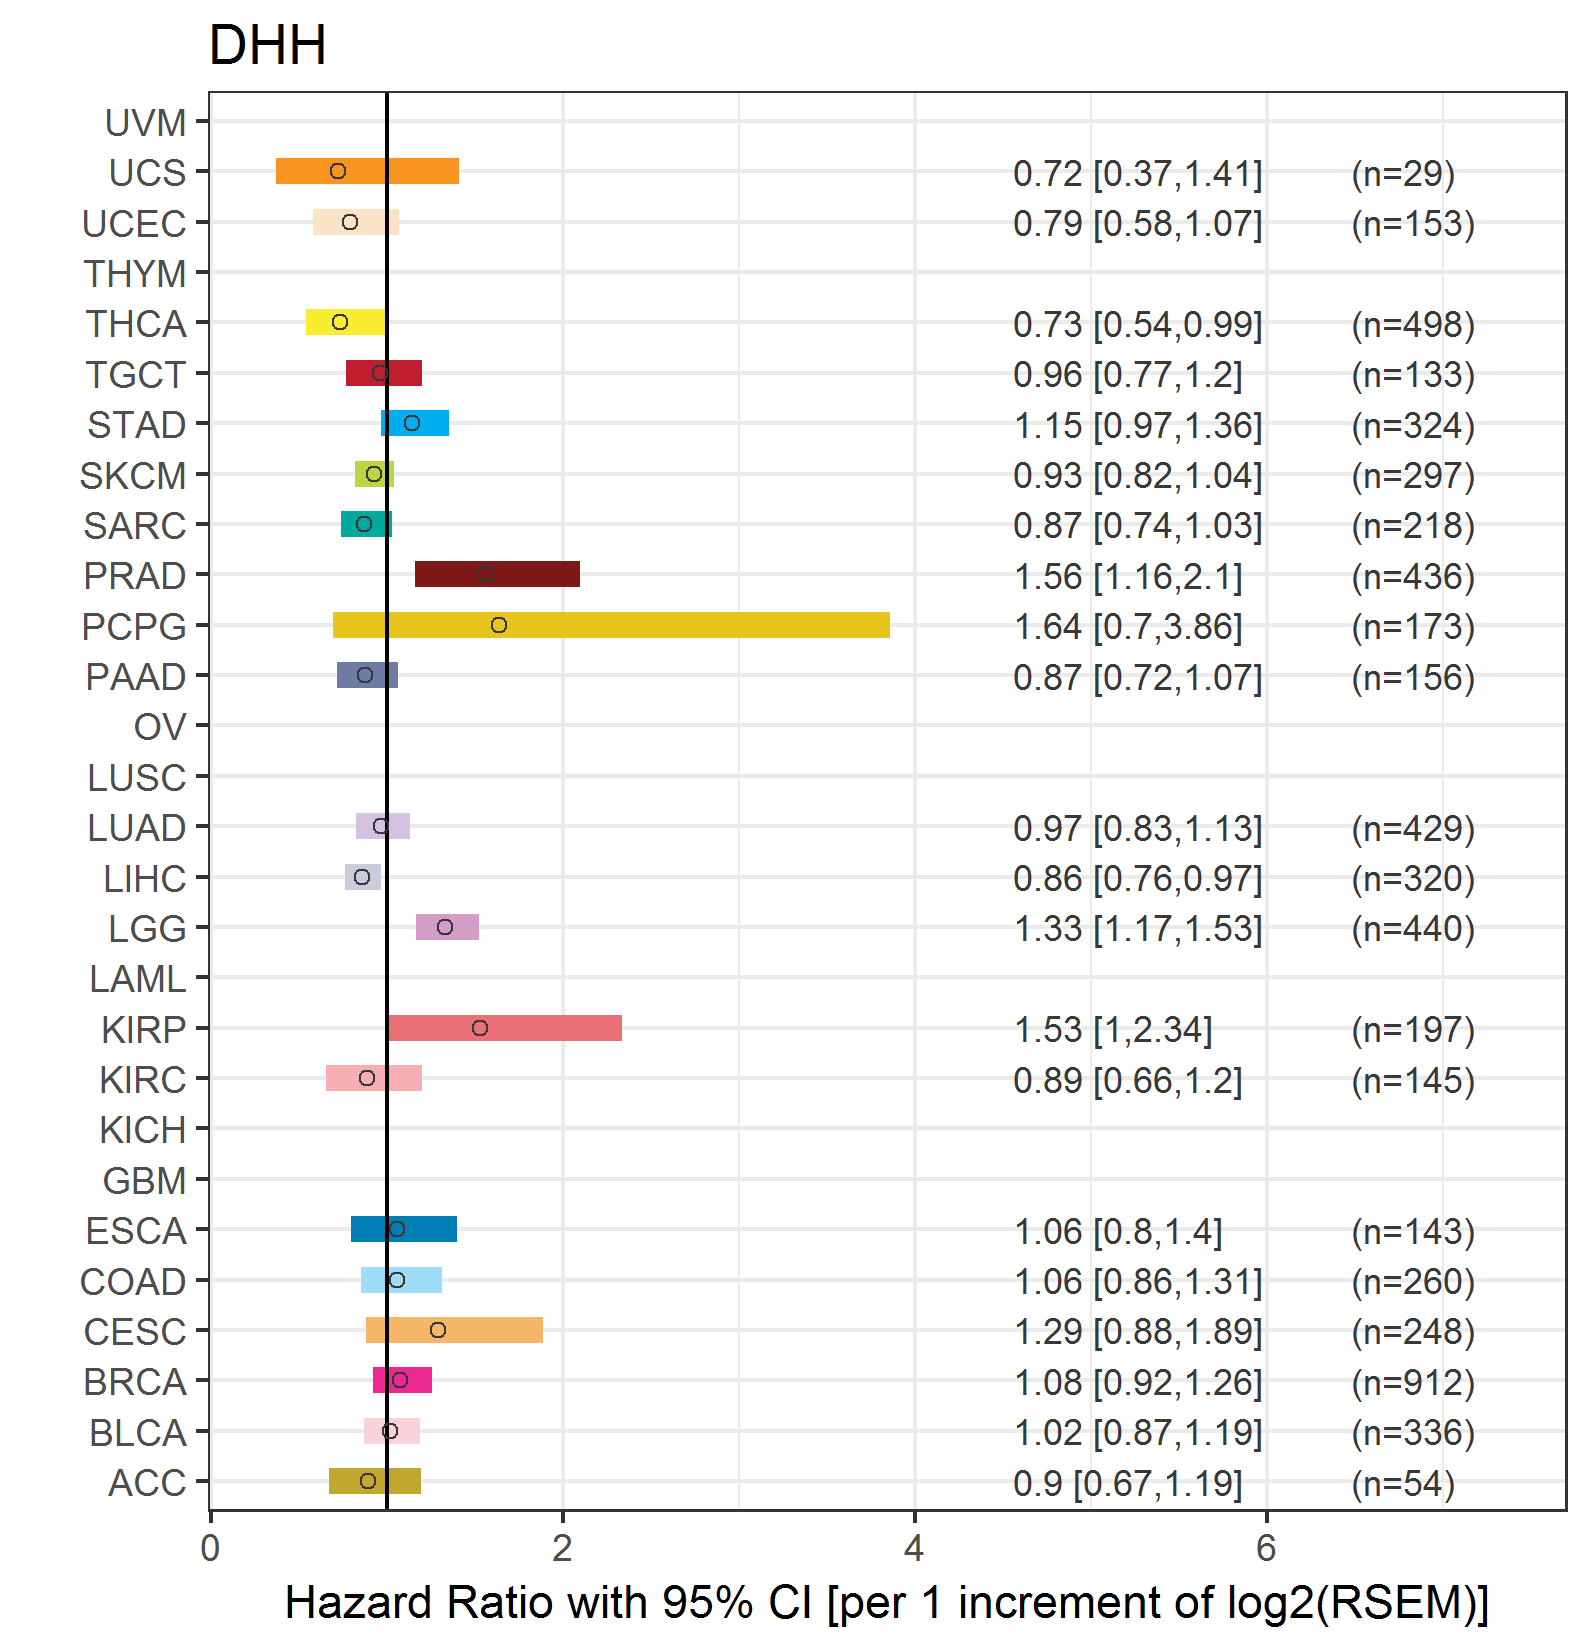
| Forest plot of Cox proportional hazard ratio (HR) and 95% CI of overall survival (OS) using 28 cancer types (TCGA IlluminaHiSeq_RNASeqV2, pan-cancer normalized log2(norm_counts+1) data, version 2016-08-16) (TCGA clinicalMatrix, phenotype data, version 2016-04-27) * Click on the image enlarge it in a new window. |
 |
| Forest plot of Cox proportional hazard ratio (HR) and 95% CI of relapse free survival (RFS) using 28 cancer types (TCGA IlluminaHiSeq_RNASeqV2, pan-cancer normalized log2(norm_counts+1) data, version 2016-08-16) (TCGA clinicalMatrix, phenotype data, version 2016-04-27) * Click on the image enlarge it in a new window. |
 |
| Top |
| TissGeneClin for DHH |
| TissGeneDrug for DHH |
| Drug information targeting TissGene (DrugBank Version 5.0.6, 2017-04-01) |
| DrugBank ID | Drug name | Drug activity | Drug type | Drug status |
| Top |
| TissGeneDisease for DHH |
| Disease information associated with TissGene (DisGeNet, 2016-06-01) |
| Disease ID | Disease name | # pubmeds | Source |
| umls:C0024623 | Malignant neoplasm of stomach | 3 | BeFree |
| umls:C0018051 | Gonadal Dysgenesis | 2 | BeFree |
| umls:C0018054 | Gonadal Dysgenesis, 46,XY | 2 | BeFree |
| umls:C0018055 | Gonadal Dysgenesis, Mixed | 2 | BeFree |
| umls:C0041408 | Turner Syndrome | 2 | BeFree |
| umls:C2936694 | Swyer Syndrome | 2 | BeFree,ORPHANET |
| umls:C0005586 | Bipolar Disorder | 1 | BeFree |
| umls:C0011847 | Diabetes | 1 | BeFree |
| umls:C0011849 | Diabetes Mellitus | 1 | BeFree |
| umls:C0027830 | neurofibroma | 1 | BeFree |
| umls:C0027831 | Neurofibromatosis 1 | 1 | BeFree |
| umls:C0031117 | Peripheral Neuropathy | 1 | BeFree |
| umls:C0036875 | Disorders of Sex Development | 1 | BeFree |
| umls:C0205945 | Sarcoma, Spindle Cell | 1 | BeFree |
| umls:C0206727 | Nerve Sheath Tumors | 1 | BeFree |
| umls:C0220621 | pediatric acute myeloblastic leukemia | 1 | BeFree |
| umls:C0235974 | Pancreatic carcinoma | 1 | BeFree |
| umls:C0346647 | Malignant neoplasm of pancreas | 1 | BeFree |
| umls:C0442874 | Neuropathy | 1 | BeFree |
| umls:C0596263 | Carcinogenesis | 1 | BeFree |
| umls:C0686619 | Secondary malignant neoplasm of lymph node | 1 | BeFree |
| umls:C0687149 | Pure gonadal dysgenesis | 1 | BeFree |
| umls:C0699791 | Stomach Carcinoma | 1 | BeFree |
| umls:C0751690 | Malignant Peripheral Nerve Sheath Tumor | 1 | BeFree |
| umls:C1856273 | 46,XY Gonadal Dysgenesis, Complete or Partial, DHH-Related | 1 | CTD_human,UNIPROT |
| umls:C2751325 | 46,Xy Gonadal Dysgenesis, Partial, With Minifascicular Neuropathy | 0 | CLINVAR,CTD_human,MGD,ORPHANET |
|
Copyright 2016-Present - The University of Texas Health Science Center at Houston (UTHealth) Web File Viewing | How to Report, Fraud, Waste and Abuse | State of Texas | Statewide Search | Texas Homeland Security | Site Policies |