 |
| |
| |
| |
| |
| |
| |
|

| TissGeneSummary for TRAPPC12 |
 Gene summary Gene summary |
| Basic gene information | Gene symbol | TRAPPC12 |
| Gene name | trafficking protein particle complex 12 | |
| Synonyms | TTC-15|TTC15 | |
| Cytomap | UCSC genome browser: 2p25.3 | |
| Type of gene | protein-coding | |
| RefGenes | NM_016030.5, | |
| Description | TPR repeat protein 15tetratricopeptide repeat domain 15tetratricopeptide repeat protein 15trafficking protein particle complex subunit 12 | |
| Modification date | 20141207 | |
| dbXrefs | MIM : 614139 | |
| HGNC : HGNC | ||
| Ensembl : ENSG00000171853 | ||
| HPRD : 15580 | ||
| Vega : OTTHUMG00000090328 | ||
| Protein | UniProt: go to UniProt's Cross Reference DB Table | |
| Expression | CleanEX: HS_TRAPPC12 | |
| BioGPS: 51112 | ||
| Pathway | NCI Pathway Interaction Database: TRAPPC12 | |
| KEGG: TRAPPC12 | ||
| REACTOME: TRAPPC12 | ||
| Pathway Commons: TRAPPC12 | ||
| Context | iHOP: TRAPPC12 | |
| ligand binding site mutation search in PubMed: TRAPPC12 | ||
| UCL Cancer Institute: TRAPPC12 | ||
| Assigned class in TissGDB* | C | |
| Included tissue-specific gene expression resources | TiGER,GTEx | |
| Specific-tissues in normal samples (assigned by TissGDB using HPA, TiGER, and GTEx) | Bone marrowTestis | |
| Cancer types related to the specific-tissues in cancer samples (assigned by TissGDB using TCGA) | LAMLTGCT | |
| Reference showing the relevant tissue of TRAPPC12 | ||
| Description by TissGene annotations | Fused withOncogene | |
| * Class A consists of genes with literature evidence and is part of the cTissGenes. Class B consists of only cTissGenes without additional evidence. The remaining genes belong to Class C. |
| Gene ontology having evidence of Inferred from Direct Assay (IDA) from Entrez |
| GO ID | GO term | PubMed ID |
| Top |
| TissGeneExp for TRAPPC12 |
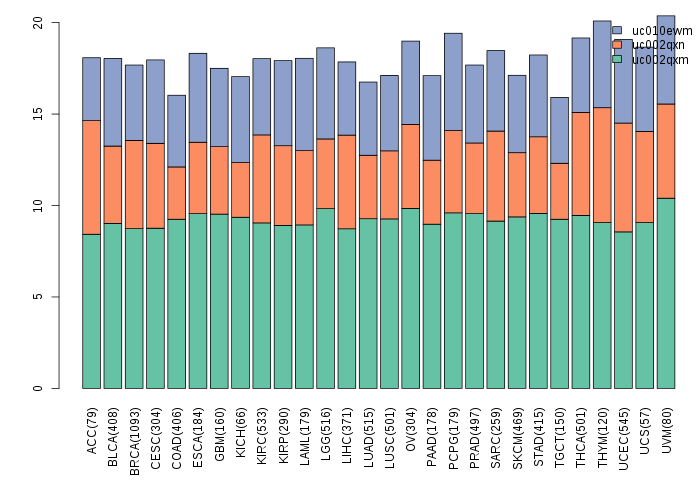
| Gene expressions across 28 cancer types (X-axis: cancer type and Y-axis: log2(norm_counts+1)) (TCGA IlluminaHiSeq_RNASeqV2, pan-cancer normalized log2(norm_counts+1) data, version 2016-08-16) |
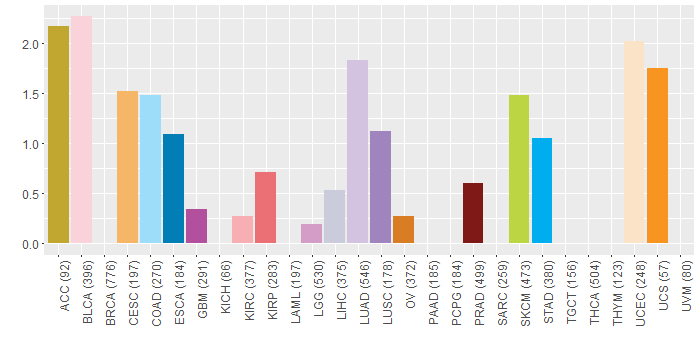
| Gene isoform expressions across 28 cancer types (X-axis: cancer type and Y-axis: log2(norm_counts+1)) (TCGA pan-cancer tcga_rsem_isoform_tpm, version 2016-09-01) |
 |
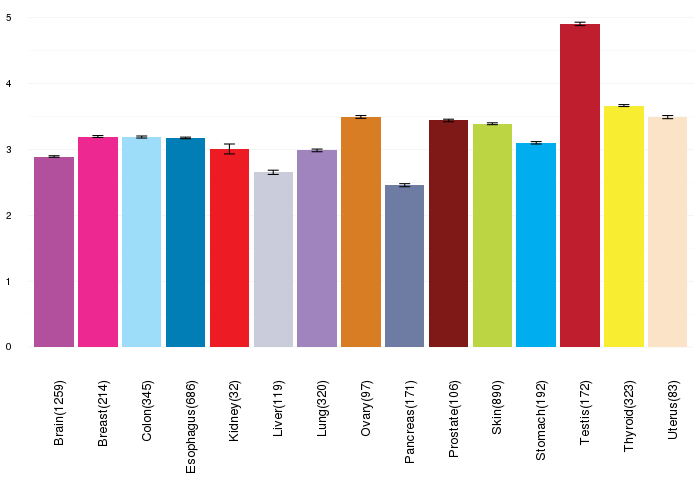
| Gene expressions across normal tissues of GTEx data (GTEx GTEx_Analysis_v6_RNA-seq_RNA-SeQCv1.1.8_gene_rpkm.gct) - Here, we shows the matched tissue types only among our 28 cancer types. |
 |
| Different expressions across 14 cancer types with more than 10 samples between matched tumors and normals (X-axis: cancer type and Y-axis: log2(norm_counts+1)) (TCGA IlluminaHiSeq_RNASeqV2, pan-cancer normalized log2(norm_counts+1) data, version 2016-08-16) |
| - Significantly differentially expressed cancer types and information. (|Fold change|>1 and FDR<0.05) |
| Cancer type | Mean(exp) in tumor | Mean(exp) in matched normal | Log2FC | P-val. | FDR |
| Top |
| TissGene-miRNA for TRAPPC12 |
| Significantly anti-correlated miRNAs of TissGene across 28 cancer types (Gene-miRNA relations from TargetScanHuman Relsease 7.1, Conserved_Site_Context_Scores.txt.zip, 06.01.2016) (TCGA IlluminaHiSeq_miRNASeq, log2(RPM+1) data, version 2016-11-21) (TCGA IlluminaHiSeq_RNASeqV2, log2(normalized_count+1) data, version 2016-08-16) (Spearman’s Rank Correlation (p-value<0.05 and coefficient<-0.25)) |
| Cancer type | miRNA id | miRNA accession | P-val. | Coeff. | # samples |
| Top |
| TissGeneMut for TRAPPC12 |
| TissGeneSNV for TRAPPC12 |
| nsSNV counts per each loci. Different colors of circles represent different cancer types. Circle size denotes number of samples. (TCGA somatic mutation (SNPs and small INDELs) data, version 2016-04-25) * Click on the image to enlarge it in a new window. |
 |
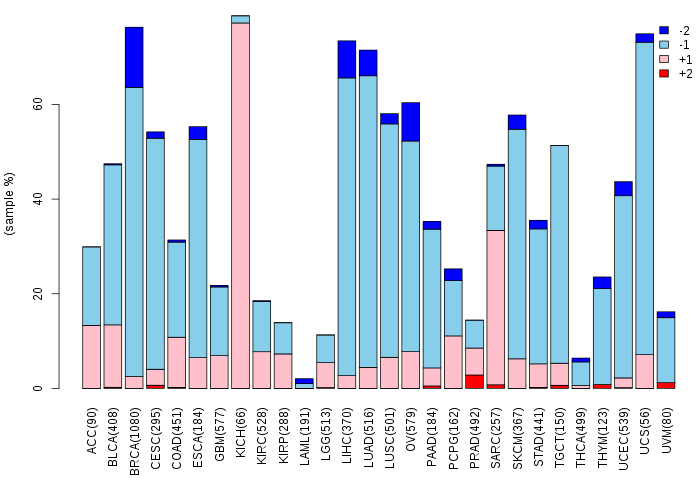
| Somatic nucleotide variants of TissGene across 28 cancer types (X-axis: cancer type and Y-axis: % of mutated samples) The numbers in parentheses are numbers of samples with mutation (nsSNVs). (TCGA somatic mutation (SNPs and small INDELs) data, version 2016-04-25) |
 |
| - nsSNVs sorted by frequency. |
| AAchange | Cancer type | # samples |
| p.R89W | PRAD | 2 |
| p.L219F | HNSC | 2 |
| p.L459F | SKCM | 1 |
| p.P293S | SKCM | 1 |
| p.Y461S | LUAD | 1 |
| p.Y574C | LIHC | 1 |
| p.R652I | GBM | 1 |
| p.S52L | CESC | 1 |
| p.A246T | LUSC | 1 |
| p.T12M | UCEC | 1 |
| p.A145P | KIRP | 1 |
| p.L438V | UCS | 1 |
| p.V693M | STAD | 1 |
| p.A22T | DLBC | 1 |
| p.D355H | HNSC | 1 |
| p.Q611X | STAD | 1 |
| p.S207G | LIHC | 1 |
| p.E378* | LUAD | 1 |
| p.E531K | BLCA | 1 |
| p.A406V | BLCA | 1 |
| p.R481G | ACC | 1 |
| p.R481C | PRAD | 1 |
| p.G415E | DLBC | 1 |
| p.L338F | HNSC | 1 |
| p.R89W | COAD | 1 |
| p.Q611H | BLCA | 1 |
| p.R402C | COAD | 1 |
| p.R538W | ESCA | 1 |
| p.R394S | ESCA | 1 |
| p.T421M | DLBC | 1 |
| p.G39D | UCEC | 1 |
| p.L311V | SKCM | 1 |
| p.E607K | CESC | 1 |
| p.E449K | LUAD | 1 |
| p.D308N | STAD | 1 |
| p.E190K | BLCA | 1 |
| p.E176* | LUAD | 1 |
| p.R402C | BLCA | 1 |
| p.R321Q | KIRC | 1 |
| p.A660D | UCEC | 1 |
| p.Y602D | BLCA | 1 |
| p.A567T | BLCA | 1 |
| p.P312S | ACC | 1 |
| p.Y463* | LGG | 1 |
| p.D375Y | LUAD | 1 |
| p.T529S | KIRP | 1 |
| p.R359C | READ | 1 |
| p.V88L | LUAD | 1 |
| p.Y549C | UCEC | 1 |
| p.S52L | SKCM | 1 |
| p.F360S | READ | 1 |
| p.R166C | UCEC | 1 |
| p.H569Y | SKCM | 1 |
| p.S474F | SKCM | 1 |
| p.I593N | COAD | 1 |
| p.L251F | SKCM | 1 |
| p.L647V | BLCA | 1 |
| p.T316A | LUSC | 1 |
| p.L563P | OV | 1 |
| p.A444V | CESC | 1 |
| p.A366S | LUAD | 1 |
| p.L498P | LUAD | 1 |
| p.A444V | LUAD | 1 |
| p.R481H | LUAD | 1 |
| p.D37E | COAD | 1 |
| p.P177S | LUAD | 1 |
| p.L613* | UCEC | 1 |
| p.D650H | BLCA | 1 |
| p.Q592R | STAD | 1 |
| Top |
| TissGeneCNV for TRAPPC12 |
| Copy number variations of TissGene across 28 cancer types (X-axis: cancer type and Y-axis: % of CNV samples) (TCGA Gistic2_CopyNumber_Gistic2_all_data_by_genes, Gistic2 copy number data, version 2016-08-16) |
 |
| Top |
| TissGeneFusions for TRAPPC12 |
| Fusion genes including TissGene (ChimerDB 3.0, 2016-12-01 and TCGA fusion Portal 2015-12-01) |
| Database | Src | Cancer type | Sample | Fusion gene | ORF | 5'-gene BP | 3'-gene BP |
| Chimerdb3.0 | ChiTaRs | NA | BF833240 | TRAPPC12-ABL2 | chr2:3447603 | chr1:179069378 | |
| Chimerdb3.0 | ChiTaRs | NA | DB042736 | TRAPPC12-FKBP5 | chr2:3463314 | chr6:35554840 | |
| Chimerdb3.0 | FusionScan | BRCA | TCGA-A7-A13D-01A | ALMS1-TRAPPC12 | Out-of-Frame | chr2:73718625 | chr2:3447549 |
| Top |
| TissGeneNet for TRAPPC12 |
| Co-expressed gene networks based on protein-protein interaction data (CePIN) (TCGA IlluminaHiSeq_RNASeqV2, pan-cancer normalized log2(norm_counts+1) data, version 2016-08-16) (PINA2 ppi data) |
| Top |
| TissGeneProg for TRAPPC12 |
| Kaplan-Meier plots with logrank tests of overall survival (OS) using 28 cancer types (TCGA IlluminaHiSeq_RNASeqV2, pan-cancer normalized log2(norm_counts+1) data, version 2016-08-16) (TCGA clinicalMatrix, phenotype data, version 2016-04-27) * Click on the image to enlarge it in a new window. |
| Kaplan-Meier plots with logrank test of relapse free survival (RFS) using 28 cancer types (TCGA IlluminaHiSeq_RNASeqV2, pan-cancer normalized log2(norm_counts+1) data, version 2016-08-16) (TCGA clinicalMatrix, phenotype data, version 2016-04-27) * Click on the image enlarge it in a new window. |
| Forest plot of Cox proportional hazard ratio (HR) and 95% CI of overall survival (OS) using 28 cancer types (TCGA IlluminaHiSeq_RNASeqV2, pan-cancer normalized log2(norm_counts+1) data, version 2016-08-16) (TCGA clinicalMatrix, phenotype data, version 2016-04-27) * Click on the image enlarge it in a new window. |
| Forest plot of Cox proportional hazard ratio (HR) and 95% CI of relapse free survival (RFS) using 28 cancer types (TCGA IlluminaHiSeq_RNASeqV2, pan-cancer normalized log2(norm_counts+1) data, version 2016-08-16) (TCGA clinicalMatrix, phenotype data, version 2016-04-27) * Click on the image enlarge it in a new window. |
| Top |
| TissGeneClin for TRAPPC12 |
| TissGeneDrug for TRAPPC12 |
| Drug information targeting TissGene (DrugBank Version 5.0.6, 2017-04-01) |
| DrugBank ID | Drug name | Drug activity | Drug type | Drug status |
| Top |
| TissGeneDisease for TRAPPC12 |
| Disease information associated with TissGene (DisGeNet, 2016-06-01) |
| Disease ID | Disease name | # pubmeds | Source |
| umls:C0040336 | Tobacco Use Disorder | 1 | GAD |
| umls:C0085400 | Neurofibrillary degeneration (morphologic abnormality) | 1 | GWASCAT |
|
Copyright 2016-Present - The University of Texas Health Science Center at Houston (UTHealth) Web File Viewing | How to Report, Fraud, Waste and Abuse | State of Texas | Statewide Search | Texas Homeland Security | Site Policies |