 |
| |
| |
| |
| |
| |
| |
|

| TissGeneSummary for HAO2 |
 Gene summary Gene summary |
| Basic gene information | Gene symbol | HAO2 |
| Gene name | hydroxyacid oxidase 2 (long chain) | |
| Synonyms | GIG16|HAOX2 | |
| Cytomap | UCSC genome browser: 1p13.3-p13.1 | |
| Type of gene | protein-coding | |
| RefGenes | NM_001005783.2, NM_016527.3, | |
| Description | (S)-2-hydroxy-acid oxidase, peroxisomalcell growth-inhibiting gene 16 proteinglycolate oxidasehydroxyacid oxidase 2long chain alpha-hydroxy acid oxidaselong-chain L-2-hydroxy acid oxidase | |
| Modification date | 20141211 | |
| dbXrefs | MIM : 605176 | |
| HGNC : HGNC | ||
| Ensembl : ENSG00000116882 | ||
| HPRD : 05532 | ||
| Vega : OTTHUMG00000012410 | ||
| Protein | UniProt: go to UniProt's Cross Reference DB Table | |
| Expression | CleanEX: HS_HAO2 | |
| BioGPS: 51179 | ||
| Pathway | NCI Pathway Interaction Database: HAO2 | |
| KEGG: HAO2 | ||
| REACTOME: HAO2 | ||
| Pathway Commons: HAO2 | ||
| Context | iHOP: HAO2 | |
| ligand binding site mutation search in PubMed: HAO2 | ||
| UCL Cancer Institute: HAO2 | ||
| Assigned class in TissGDB* | C | |
| Included tissue-specific gene expression resources | TiGER,GTEx | |
| Specific-tissues in normal samples (assigned by TissGDB using HPA, TiGER, and GTEx) | KidneyLiver | |
| Cancer types related to the specific-tissues in cancer samples (assigned by TissGDB using TCGA) | KIRC,KIRP,KICHLIHC | |
| Reference showing the relevant tissue of HAO2 | ||
| Description by TissGene annotations | TissgsKTS | |
| * Class A consists of genes with literature evidence and is part of the cTissGenes. Class B consists of only cTissGenes without additional evidence. The remaining genes belong to Class C. |
| Gene ontology having evidence of Inferred from Direct Assay (IDA) from Entrez |
| GO ID | GO term | PubMed ID | GO:0019395 | fatty acid oxidation | 10777549 | GO:0019395 | fatty acid oxidation | 10777549 |
| Top |
| TissGeneExp for HAO2 |
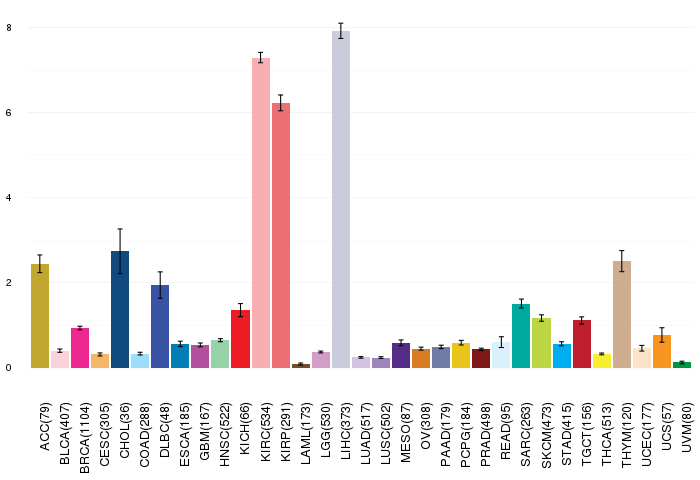
| Gene expressions across 28 cancer types (X-axis: cancer type and Y-axis: log2(norm_counts+1)) (TCGA IlluminaHiSeq_RNASeqV2, pan-cancer normalized log2(norm_counts+1) data, version 2016-08-16) |
 |
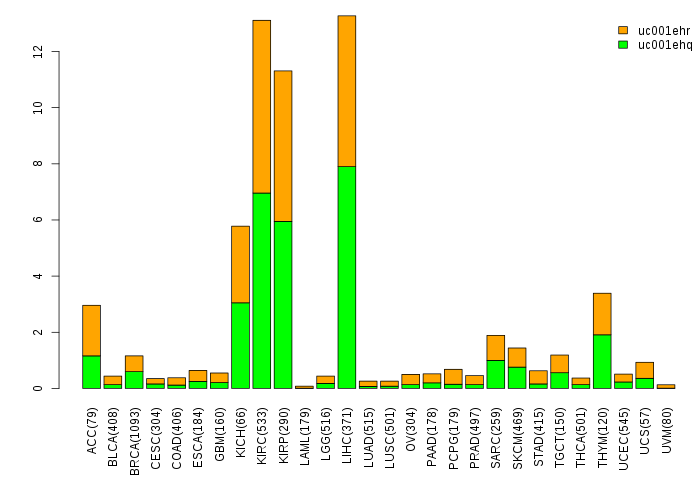
| Gene isoform expressions across 28 cancer types (X-axis: cancer type and Y-axis: log2(norm_counts+1)) (TCGA pan-cancer tcga_rsem_isoform_tpm, version 2016-09-01) |
 |
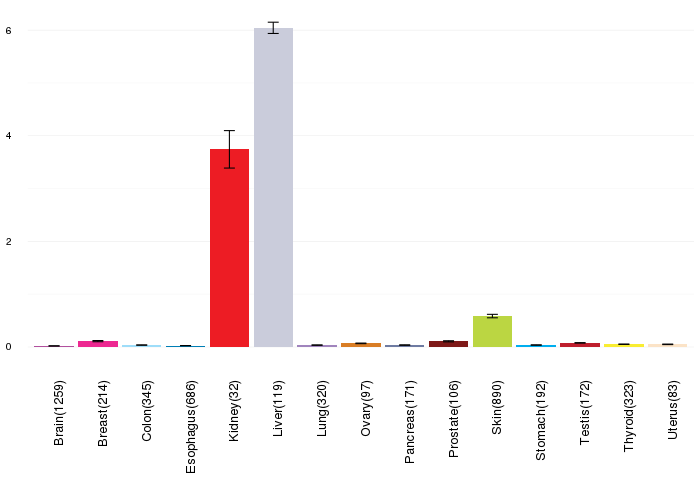
| Gene expressions across normal tissues of GTEx data (GTEx GTEx_Analysis_v6_RNA-seq_RNA-SeQCv1.1.8_gene_rpkm.gct) - Here, we shows the matched tissue types only among our 28 cancer types. |
 |
| Different expressions across 14 cancer types with more than 10 samples between matched tumors and normals (X-axis: cancer type and Y-axis: log2(norm_counts+1)) (TCGA IlluminaHiSeq_RNASeqV2, pan-cancer normalized log2(norm_counts+1) data, version 2016-08-16) |
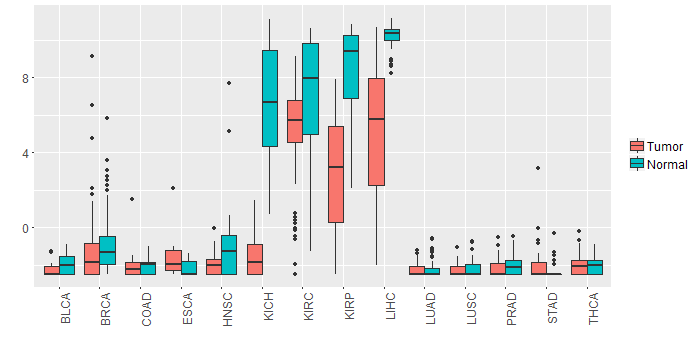 |
| - Significantly differentially expressed cancer types and information. (|Fold change|>1 and FDR<0.05) |
| Cancer type | Mean(exp) in tumor | Mean(exp) in matched normal | Log2FC | P-val. | FDR |
| KICH | -1.470502524 | 6.708621476 | -8.179124 | 3.53E-14 | 5.52E-13 |
| LIHC | 5.185617476 | 10.13781548 | -4.952198 | 1.13E-12 | 2.20E-11 |
| KIRP | 2.763675351 | 8.414509726 | -5.650834375 | 1.41E-11 | 1.89E-10 |
| HNSC | -1.987986058 | -0.965437221 | -1.022548837 | 0.00227 | 0.006874159 |
| KIRC | 5.159121532 | 7.088452088 | -1.929330556 | 9.98E-05 | 0.000210002 |
| Top |
| TissGene-miRNA for HAO2 |
| Significantly anti-correlated miRNAs of TissGene across 28 cancer types (Gene-miRNA relations from TargetScanHuman Relsease 7.1, Conserved_Site_Context_Scores.txt.zip, 06.01.2016) (TCGA IlluminaHiSeq_miRNASeq, log2(RPM+1) data, version 2016-11-21) (TCGA IlluminaHiSeq_RNASeqV2, log2(normalized_count+1) data, version 2016-08-16) (Spearman’s Rank Correlation (p-value<0.05 and coefficient<-0.25)) |
| Cancer type | miRNA id | miRNA accession | P-val. | Coeff. | # samples |
| Top |
| TissGeneMut for HAO2 |
| TissGeneSNV for HAO2 |
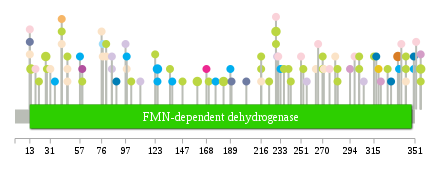
| nsSNV counts per each loci. Different colors of circles represent different cancer types. Circle size denotes number of samples. (TCGA somatic mutation (SNPs and small INDELs) data, version 2016-04-25) * Click on the image to enlarge it in a new window. |
 |
 |
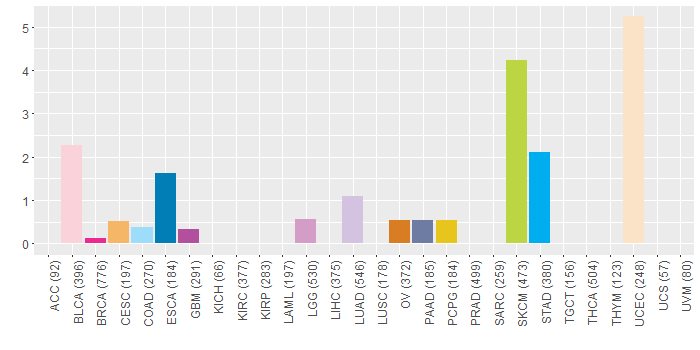
| Somatic nucleotide variants of TissGene across 28 cancer types (X-axis: cancer type and Y-axis: % of mutated samples) The numbers in parentheses are numbers of samples with mutation (nsSNVs). (TCGA somatic mutation (SNPs and small INDELs) data, version 2016-04-25) |
 |
| - nsSNVs sorted by frequency. |
| AAchange | Cancer type | # samples |
| p.R229* | SKCM | 2 |
| p.R170Q | READ | 2 |
| p.R356* | SKCM | 2 |
| p.R336W | OV | 2 |
| p.S160F | SKCM | 2 |
| p.R125X | STAD | 2 |
| p.R14Q | SKCM | 2 |
| p.R183Q | SKCM | 2 |
| p.R27Q | SKCM | 2 |
| p.R281Q | READ | 1 |
| p.R125Q | READ | 1 |
| p.P315S | SKCM | 1 |
| p.E102K | SKCM | 1 |
| p.R356Q | SKCM | 1 |
| p.D298Y | BLCA | 1 |
| p.P231L | BLCA | 1 |
| p.R46C | SKCM | 1 |
| p.R125* | STAD | 1 |
| p.R46C | UCEC | 1 |
| p.L216F | SKCM | 1 |
| p.R350M | ESCA | 1 |
| p.R216X | SKCM | 1 |
| p.G136S | SKCM | 1 |
| p.G306A | LUAD | 1 |
| p.R343X | SKCM | 1 |
| p.G236E | SKCM | 1 |
| p.R229Q | BLCA | 1 |
| p.Q149* | HNSC | 1 |
| p.A352S | BLCA | 1 |
| p.A98V | UCEC | 1 |
| p.P85T | LUAD | 1 |
| p.Q110R | LUAD | 1 |
| p.F80S | UCEC | 1 |
| p.D168N | BRCA | 1 |
| p.Q97R | LUAD | 1 |
| p.R216Q | UCEC | 1 |
| p.K271N | UCEC | 1 |
| p.P85S | LUAD | 1 |
| p.G270E | SKCM | 1 |
| p.R343* | UCEC | 1 |
| p.V256A | LUAD | 1 |
| p.A203V | PAAD | 1 |
| p.E89X | ESCA | 1 |
| p.G41E | SKCM | 1 |
| p.A233T | STAD | 1 |
| p.G283E | SKCM | 1 |
| p.D59Y | GBM | 1 |
| p.R356* | LGG | 1 |
| p.N189T | STAD | 1 |
| p.G270R | SKCM | 1 |
| p.E276Q | BLCA | 1 |
| p.R294* | LGG | 1 |
| p.A98V | STAD | 1 |
| p.E317D | ESCA | 1 |
| p.Q136* | HNSC | 1 |
| p.V264M | UCEC | 1 |
| p.D242N | SKCM | 1 |
| p.R138* | STAD | 1 |
| p.A41S | UCEC | 1 |
| p.S337L | STAD | 1 |
| p.G319S | PCPG | 1 |
| p.G223E | SKCM | 1 |
| p.A321V | LGG | 1 |
| p.R59C | SKCM | 1 |
| p.C18S | BLCA | 1 |
| p.G283R | SKCM | 1 |
| p.A190V | PAAD | 1 |
| p.R170Q | SKCM | 1 |
| p.E330D | ESCA | 1 |
| p.E13D | PAAD | 1 |
| p.V251I | BLCA | 1 |
| p.A76T | UCEC | 1 |
| p.S350L | STAD | 1 |
| p.D31G | UCEC | 1 |
| p.S147F | SKCM | 1 |
| p.N176T | STAD | 1 |
| p.G253S | SKCM | 1 |
| p.G28E | SKCM | 1 |
| p.R46H | UCEC | 1 |
| p.R343Q | SKCM | 1 |
| p.A339S | BLCA | 1 |
| p.G41A | CESC | 1 |
| p.G327D | SKCM | 1 |
| p.E266K | BLCA | 1 |
| p.E57A | STAD | 1 |
| p.P77S | UCEC | 1 |
| p.G240S | SKCM | 1 |
| p.G123S | SKCM | 1 |
| p.D21N | SKCM | 1 |
| p.E80V | SKCM | 1 |
| p.A13V | BLCA | 1 |
| p.P77L | COAD | 1 |
| p.D229N | SKCM | 1 |
| p.R35Q | STAD | 1 |
| p.L230F | LUAD | 1 |
| p.A302V | SKCM | 1 |
| p.R281Q | UCEC | 1 |
| p.A13V | UCEC | 1 |
| p.P302S | SKCM | 1 |
| Top |
| TissGeneCNV for HAO2 |
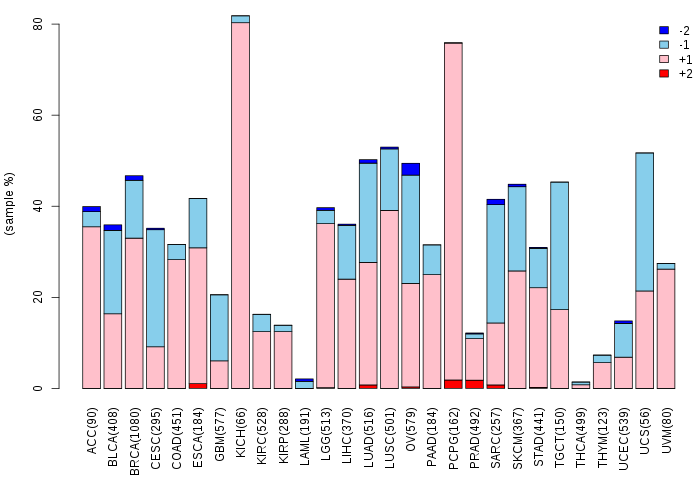
| Copy number variations of TissGene across 28 cancer types (X-axis: cancer type and Y-axis: % of CNV samples) (TCGA Gistic2_CopyNumber_Gistic2_all_data_by_genes, Gistic2 copy number data, version 2016-08-16) |
 |
| Top |
| TissGeneFusions for HAO2 |
| Fusion genes including TissGene (ChimerDB 3.0, 2016-12-01 and TCGA fusion Portal 2015-12-01) |
| Database | Src | Cancer type | Sample | Fusion gene | ORF | 5'-gene BP | 3'-gene BP |
| Chimerdb3.0 | ChiTaRs | NA | BI759383 | HAO2-HAO2 | chr1:119941320 | chr1:119934732 | |
| Chimerdb3.0 | ChiTaRs | NA | AI110601 | RECQL-HAO2 | chr12:21654546 | chr1:119928261 |
| Top |
| TissGeneNet for HAO2 |
| Co-expressed gene networks based on protein-protein interaction data (CePIN) (TCGA IlluminaHiSeq_RNASeqV2, pan-cancer normalized log2(norm_counts+1) data, version 2016-08-16) (PINA2 ppi data) |
| Top |
| TissGeneProg for HAO2 |
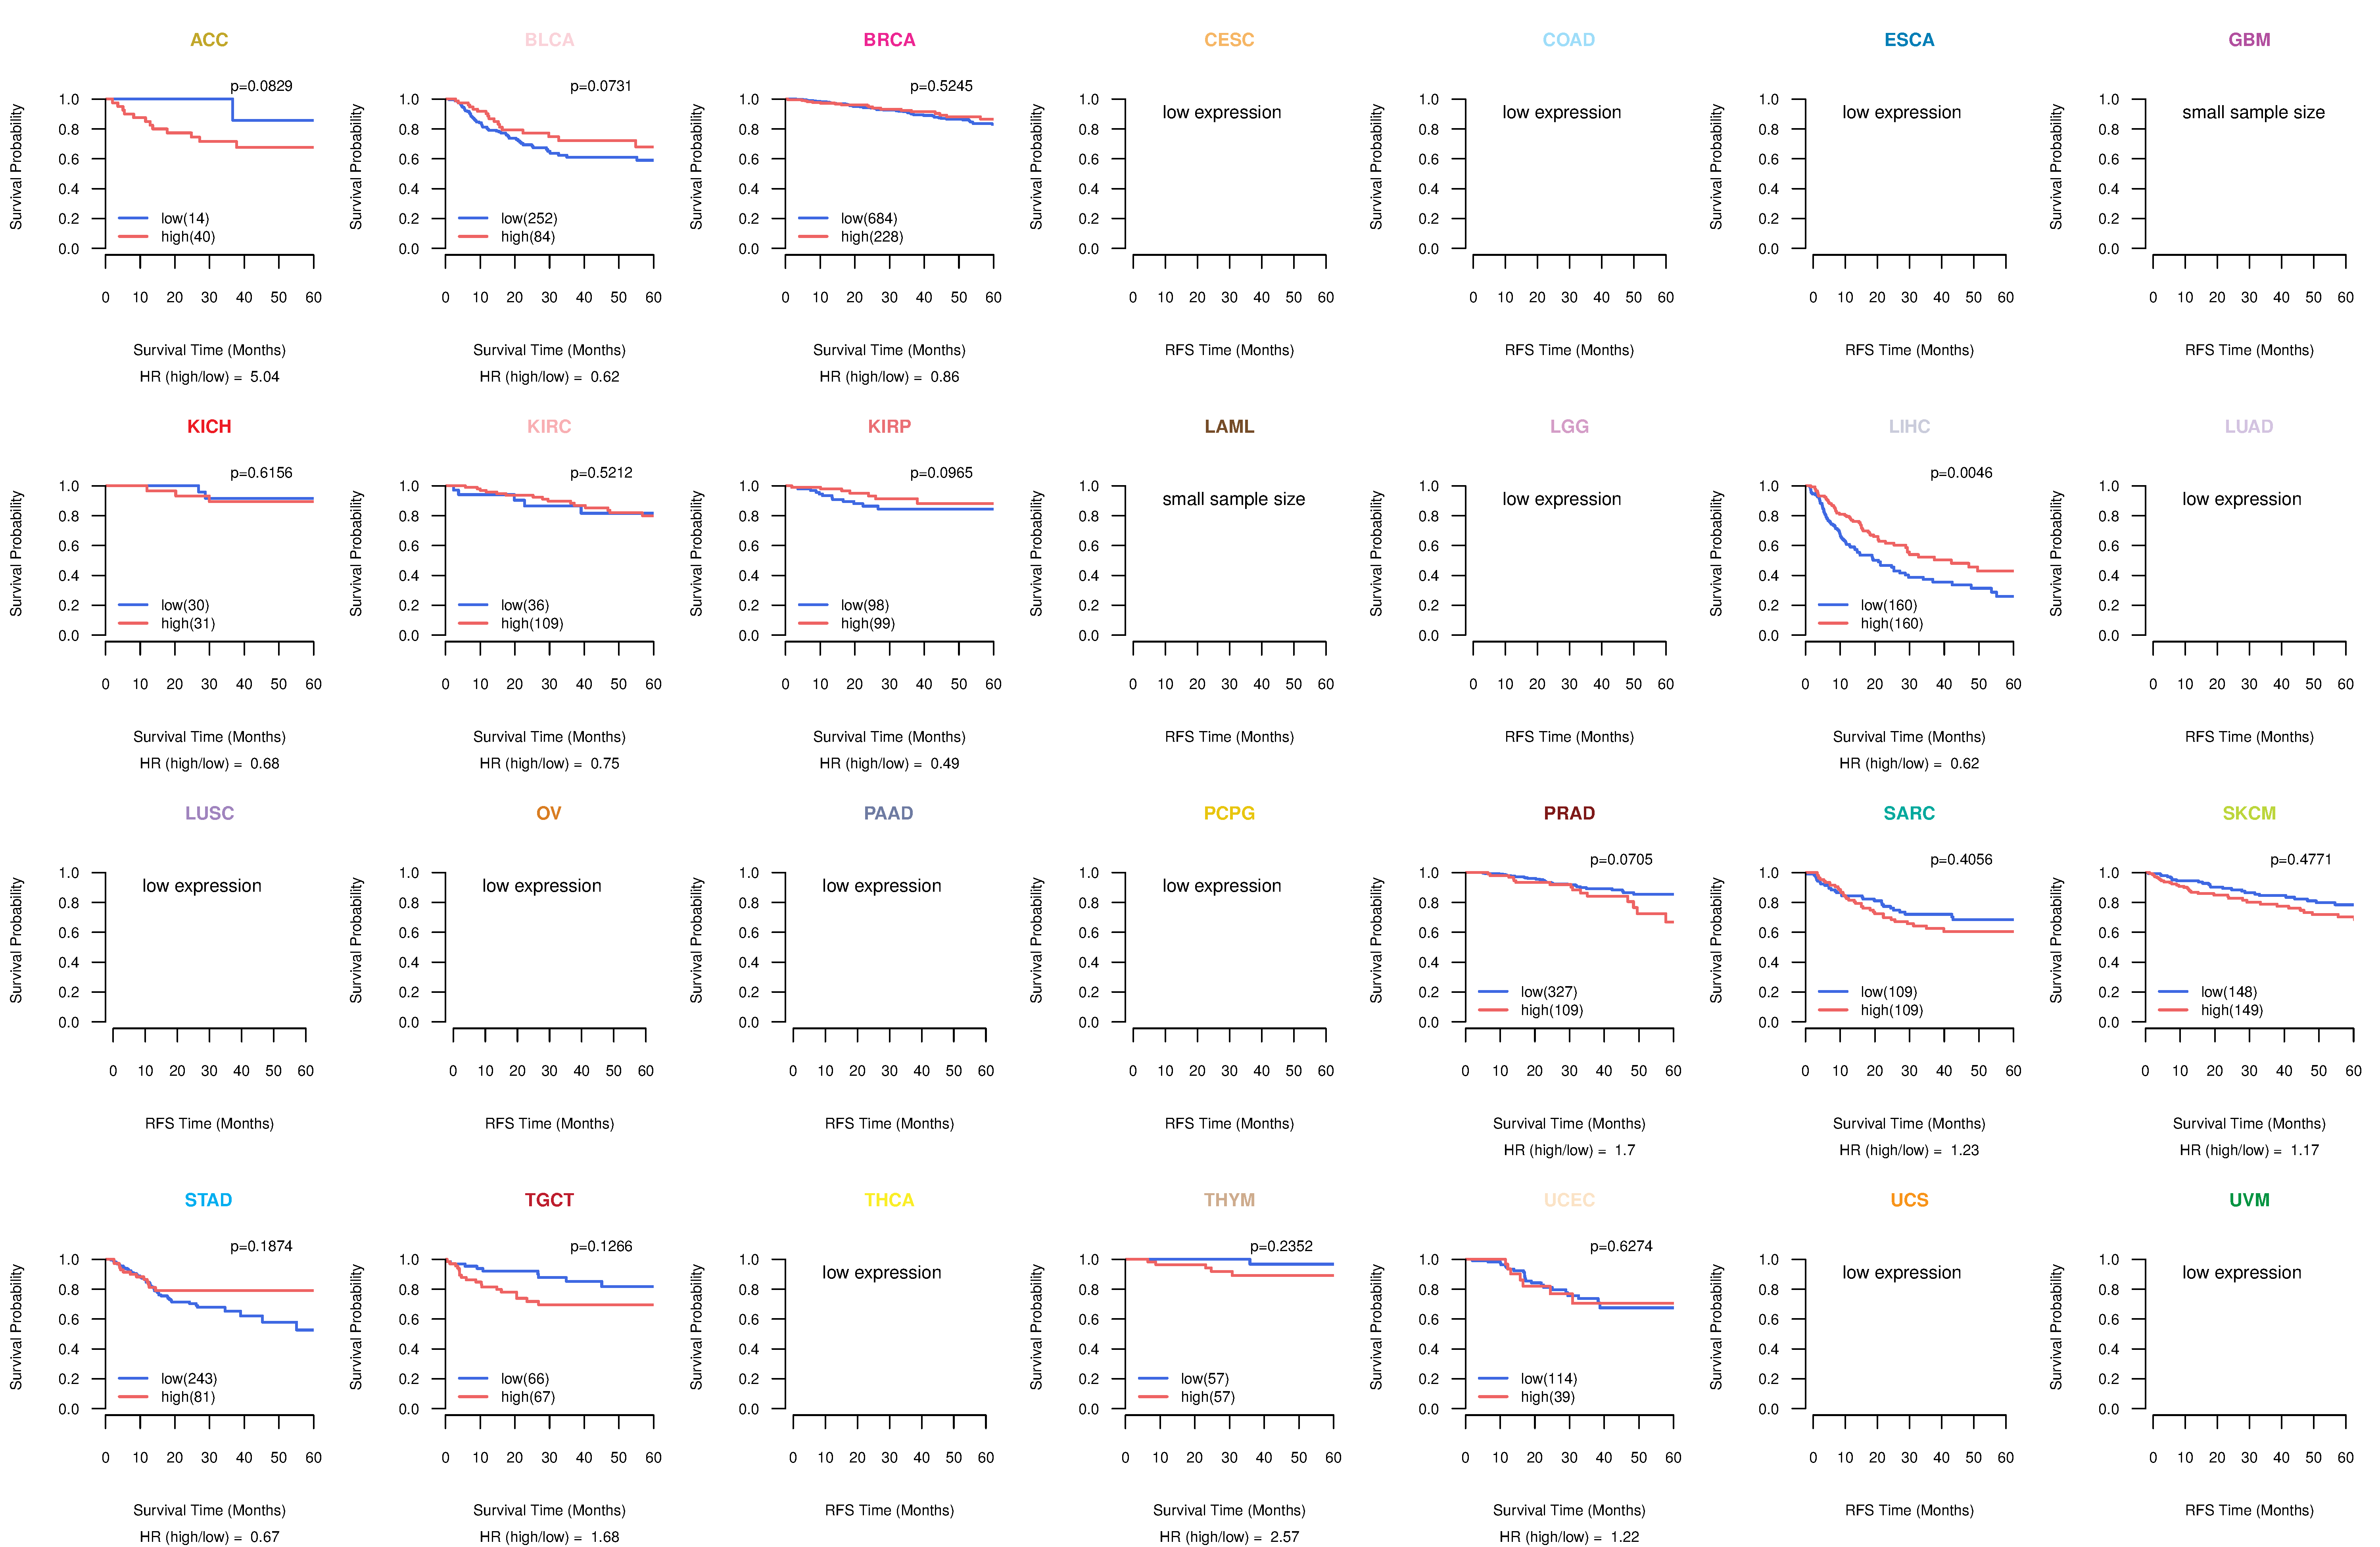
| Kaplan-Meier plots with logrank tests of overall survival (OS) using 28 cancer types (TCGA IlluminaHiSeq_RNASeqV2, pan-cancer normalized log2(norm_counts+1) data, version 2016-08-16) (TCGA clinicalMatrix, phenotype data, version 2016-04-27) * Click on the image to enlarge it in a new window. |
 |
| Kaplan-Meier plots with logrank test of relapse free survival (RFS) using 28 cancer types (TCGA IlluminaHiSeq_RNASeqV2, pan-cancer normalized log2(norm_counts+1) data, version 2016-08-16) (TCGA clinicalMatrix, phenotype data, version 2016-04-27) * Click on the image enlarge it in a new window. |
 |
| Forest plot of Cox proportional hazard ratio (HR) and 95% CI of overall survival (OS) using 28 cancer types (TCGA IlluminaHiSeq_RNASeqV2, pan-cancer normalized log2(norm_counts+1) data, version 2016-08-16) (TCGA clinicalMatrix, phenotype data, version 2016-04-27) * Click on the image enlarge it in a new window. |
 |
| Forest plot of Cox proportional hazard ratio (HR) and 95% CI of relapse free survival (RFS) using 28 cancer types (TCGA IlluminaHiSeq_RNASeqV2, pan-cancer normalized log2(norm_counts+1) data, version 2016-08-16) (TCGA clinicalMatrix, phenotype data, version 2016-04-27) * Click on the image enlarge it in a new window. |
 |
| Top |
| TissGeneClin for HAO2 |
| TissGeneDrug for HAO2 |
| Drug information targeting TissGene (DrugBank Version 5.0.6, 2017-04-01) |
| DrugBank ID | Drug name | Drug activity | Drug type | Drug status |
| Top |
| TissGeneDisease for HAO2 |
| Disease information associated with TissGene (DisGeNet, 2016-06-01) |
| Disease ID | Disease name | # pubmeds | Source |
| umls:C0005684 | Malignant neoplasm of urinary bladder | 1 | GAD |
| umls:C0020500 | Hyperoxaluria | 1 | BeFree |
| umls:C0023893 | Liver Cirrhosis, Experimental | 1 | CTD_human |
| umls:C0268164 | Primary hyperoxaluria, type I | 1 | BeFree |
|
Copyright 2016-Present - The University of Texas Health Science Center at Houston (UTHealth) Web File Viewing | How to Report, Fraud, Waste and Abuse | State of Texas | Statewide Search | Texas Homeland Security | Site Policies |