 |
| |
| |
| |
| |
| |
| |
|

| TissGeneSummary for CLEC1B |
 Gene summary Gene summary |
| Basic gene information | Gene symbol | CLEC1B |
| Gene name | C-type lectin domain family 1, member B | |
| Synonyms | 1810061I13Rik|CLEC2|CLEC2B|PRO1384|QDED721 | |
| Cytomap | UCSC genome browser: 12p13.2 | |
| Type of gene | protein-coding | |
| RefGenes | NM_001099431.1, NM_016509.3, | |
| Description | C-type lectin domain family 1 member BC-type lectin-like receptor 2C-type lectin-like receptor-2CLEC-2 | |
| Modification date | 20141207 | |
| dbXrefs | MIM : 606783 | |
| HGNC : HGNC | ||
| Ensembl : ENSG00000165682 | ||
| HPRD : 09490 | ||
| Vega : OTTHUMG00000168502 | ||
| Protein | UniProt: go to UniProt's Cross Reference DB Table | |
| Expression | CleanEX: HS_CLEC1B | |
| BioGPS: 51266 | ||
| Pathway | NCI Pathway Interaction Database: CLEC1B | |
| KEGG: CLEC1B | ||
| REACTOME: CLEC1B | ||
| Pathway Commons: CLEC1B | ||
| Context | iHOP: CLEC1B | |
| ligand binding site mutation search in PubMed: CLEC1B | ||
| UCL Cancer Institute: CLEC1B | ||
| Assigned class in TissGDB* | C | |
| Included tissue-specific gene expression resources | HPA,GTEx | |
| Specific-tissues in normal samples (assigned by TissGDB using HPA, TiGER, and GTEx) | Liver | |
| Cancer types related to the specific-tissues in cancer samples (assigned by TissGDB using TCGA) | LIHC | |
| Reference showing the relevant tissue of CLEC1B | ||
| Description by TissGene annotations | ||
| * Class A consists of genes with literature evidence and is part of the cTissGenes. Class B consists of only cTissGenes without additional evidence. The remaining genes belong to Class C. |
| Gene ontology having evidence of Inferred from Direct Assay (IDA) from Entrez |
| GO ID | GO term | PubMed ID |
| Top |
| TissGeneExp for CLEC1B |
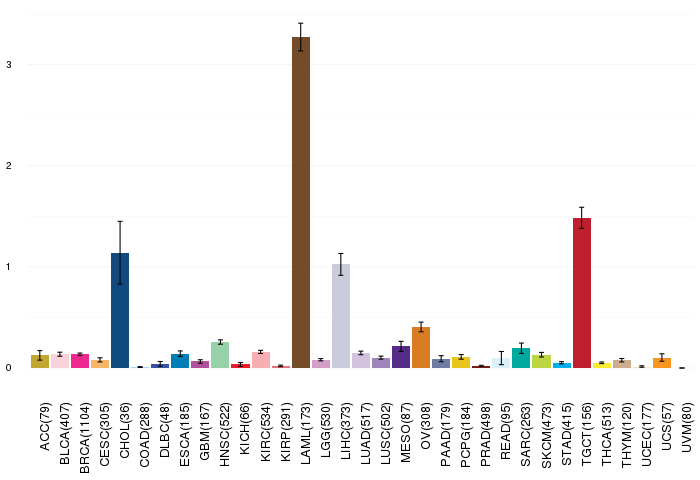
| Gene expressions across 28 cancer types (X-axis: cancer type and Y-axis: log2(norm_counts+1)) (TCGA IlluminaHiSeq_RNASeqV2, pan-cancer normalized log2(norm_counts+1) data, version 2016-08-16) |
 |
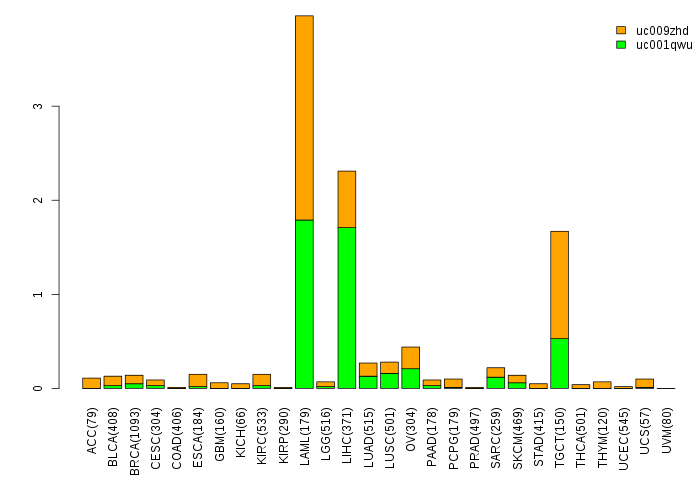
| Gene isoform expressions across 28 cancer types (X-axis: cancer type and Y-axis: log2(norm_counts+1)) (TCGA pan-cancer tcga_rsem_isoform_tpm, version 2016-09-01) |
 |
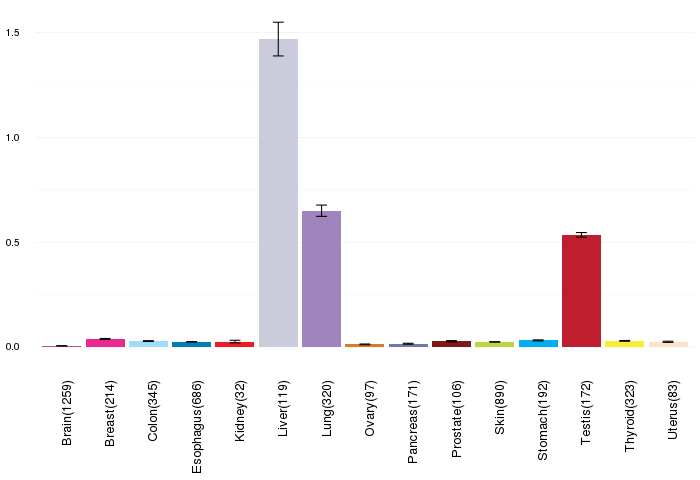
| Gene expressions across normal tissues of GTEx data (GTEx GTEx_Analysis_v6_RNA-seq_RNA-SeQCv1.1.8_gene_rpkm.gct) - Here, we shows the matched tissue types only among our 28 cancer types. |
 |
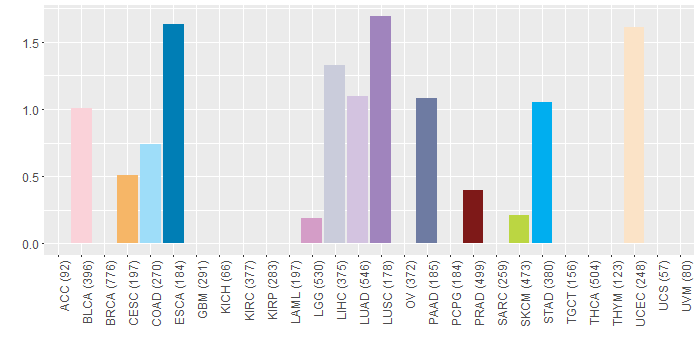
| Different expressions across 14 cancer types with more than 10 samples between matched tumors and normals (X-axis: cancer type and Y-axis: log2(norm_counts+1)) (TCGA IlluminaHiSeq_RNASeqV2, pan-cancer normalized log2(norm_counts+1) data, version 2016-08-16) |
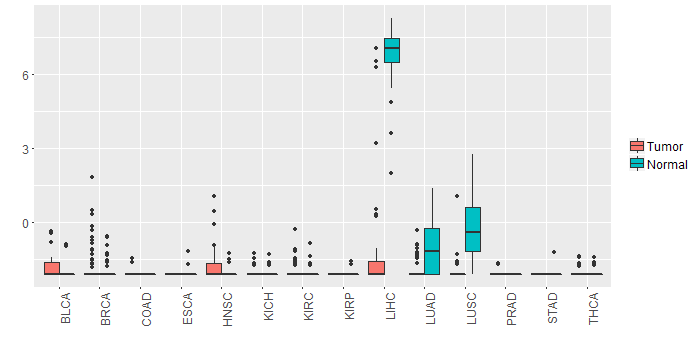 |
| - Significantly differentially expressed cancer types and information. (|Fold change|>1 and FDR<0.05) |
| Cancer type | Mean(exp) in tumor | Mean(exp) in matched normal | Log2FC | P-val. | FDR |
| LUSC | -1.967307159 | -0.334858139 | -1.63244902 | 7.82E-13 | 3.65E-12 |
| LIHC | -1.227250218 | 6.770505782 | -7.997756 | 6.90E-35 | 1.53E-31 |
| Top |
| TissGene-miRNA for CLEC1B |
| Significantly anti-correlated miRNAs of TissGene across 28 cancer types (Gene-miRNA relations from TargetScanHuman Relsease 7.1, Conserved_Site_Context_Scores.txt.zip, 06.01.2016) (TCGA IlluminaHiSeq_miRNASeq, log2(RPM+1) data, version 2016-11-21) (TCGA IlluminaHiSeq_RNASeqV2, log2(normalized_count+1) data, version 2016-08-16) (Spearman’s Rank Correlation (p-value<0.05 and coefficient<-0.25)) |
| Cancer type | miRNA id | miRNA accession | P-val. | Coeff. | # samples |
| Top |
| TissGeneMut for CLEC1B |
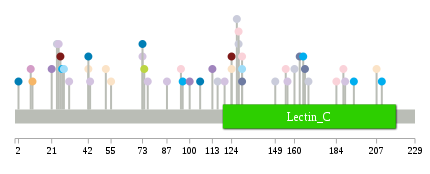
| TissGeneSNV for CLEC1B |
| nsSNV counts per each loci. Different colors of circles represent different cancer types. Circle size denotes number of samples. (TCGA somatic mutation (SNPs and small INDELs) data, version 2016-04-25) * Click on the image to enlarge it in a new window. |
 |
 |
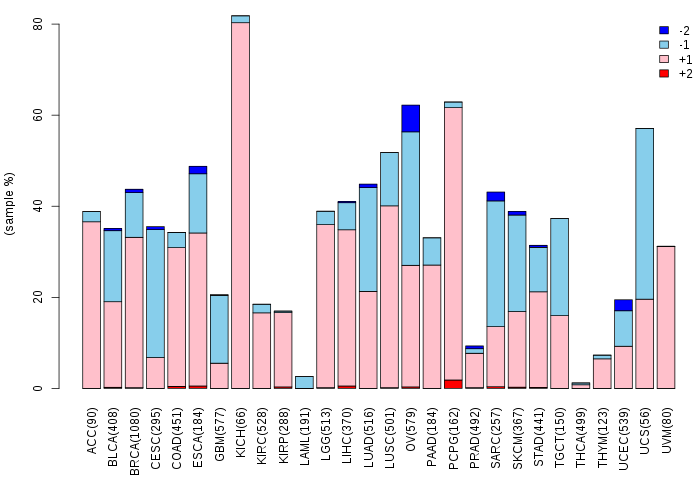
| Somatic nucleotide variants of TissGene across 28 cancer types (X-axis: cancer type and Y-axis: % of mutated samples) The numbers in parentheses are numbers of samples with mutation (nsSNVs). (TCGA somatic mutation (SNPs and small INDELs) data, version 2016-04-25) |
 |
| - nsSNVs sorted by frequency. |
| AAchange | Cancer type | # samples |
| p.C113S | LUSC | 1 |
| p.L76F | LUAD | 1 |
| p.N210S | STAD | 1 |
| p.Q128E | LIHC | 1 |
| p.S100I | LUSC | 1 |
| p.S27A | STAD | 1 |
| p.N87K | LUAD | 1 |
| p.Q128* | BLCA | 1 |
| p.E168G | LIHC | 1 |
| p.K169N | HNSC | 1 |
| p.L10S | CESC | 1 |
| p.W106R | ESCA | 1 |
| p.D155H | BLCA | 1 |
| p.I116F | LIHC | 1 |
| p.V42M | ESCA | 1 |
| p.R26H | PRAD | 1 |
| p.G156R | LUAD | 1 |
| p.R74K | SKCM | 1 |
| p.T9P | LGG | 1 |
| p.R31G | LUAD | 1 |
| p.W73L | LUAD | 1 |
| p.G160X | LIHC | 1 |
| p.R130L | PAAD | 1 |
| p.D124G | UCEC | 1 |
| p.F52L | UCEC | 1 |
| p.R74I | READ | 1 |
| p.N194K | STAD | 1 |
| p.S21Y | LUSC | 1 |
| p.L43F | LUAD | 1 |
| p.Q2X | ESCA | 1 |
| p.R130H | BLCA | 1 |
| p.I149F | LIHC | 1 |
| p.G189R | LUAD | 1 |
| p.K165M | STAD | 1 |
| p.S24Y | LIHC | 1 |
| p.N120K | LUAD | 1 |
| p.S55Y | UCEC | 1 |
| p.F207L | UCEC | 1 |
| p.Q95* | BLCA | 1 |
| p.A25E | LUAD | 1 |
| p.R130C | COAD | 1 |
| p.G127* | LIHC | 1 |
| p.H166R | PAAD | 1 |
| p.V42M | UCEC | 1 |
| p.R163L | PAAD | 1 |
| p.R124C | PRAD | 1 |
| p.G96S | STAD | 1 |
| p.W73R | ESCA | 1 |
| p.E184D | BLCA | 1 |
| p.S28F | COAD | 1 |
| p.D188H | BLCA | 1 |
| Top |
| TissGeneCNV for CLEC1B |
| Copy number variations of TissGene across 28 cancer types (X-axis: cancer type and Y-axis: % of CNV samples) (TCGA Gistic2_CopyNumber_Gistic2_all_data_by_genes, Gistic2 copy number data, version 2016-08-16) |
 |
| Top |
| TissGeneFusions for CLEC1B |
| Fusion genes including TissGene (ChimerDB 3.0, 2016-12-01 and TCGA fusion Portal 2015-12-01) |
| Database | Src | Cancer type | Sample | Fusion gene | ORF | 5'-gene BP | 3'-gene BP |
| Top |
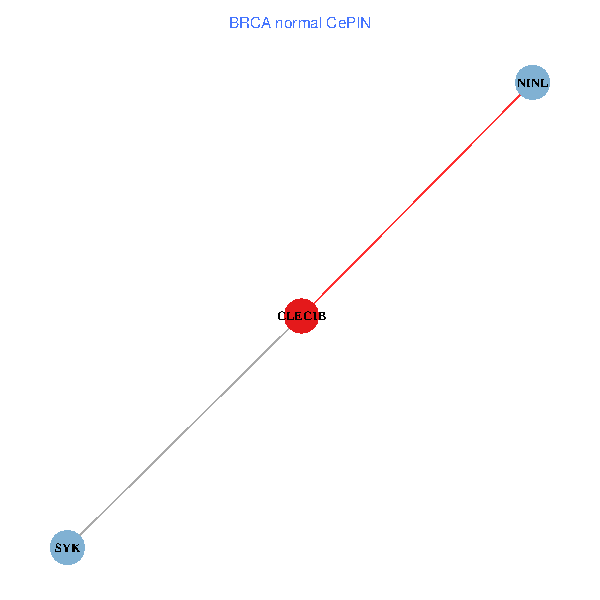
| TissGeneNet for CLEC1B |
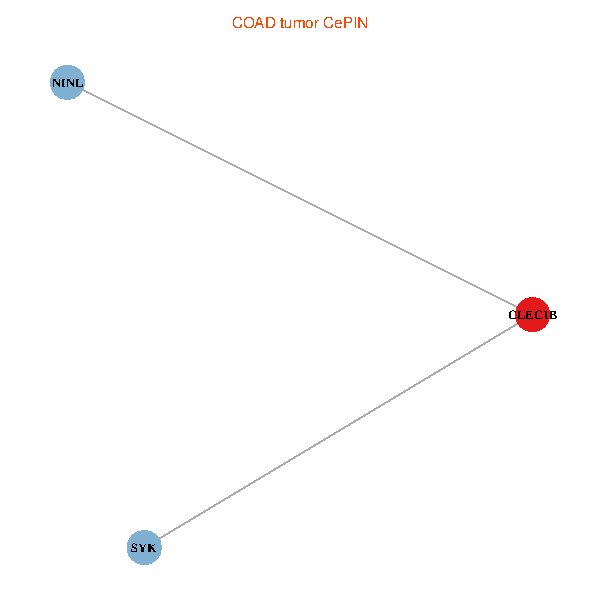
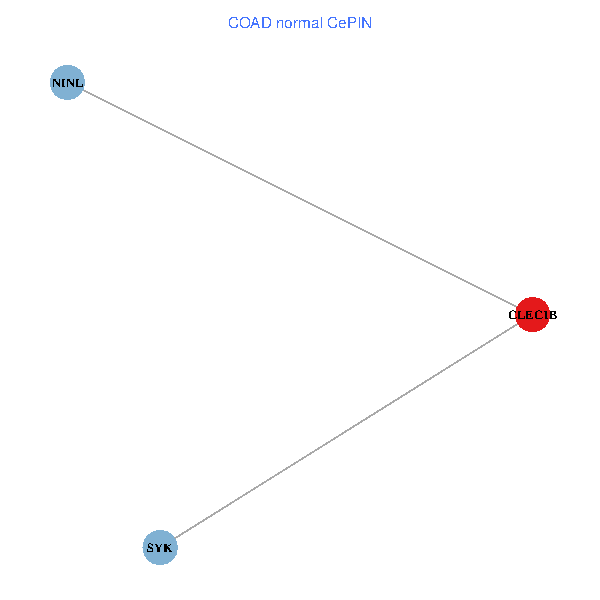
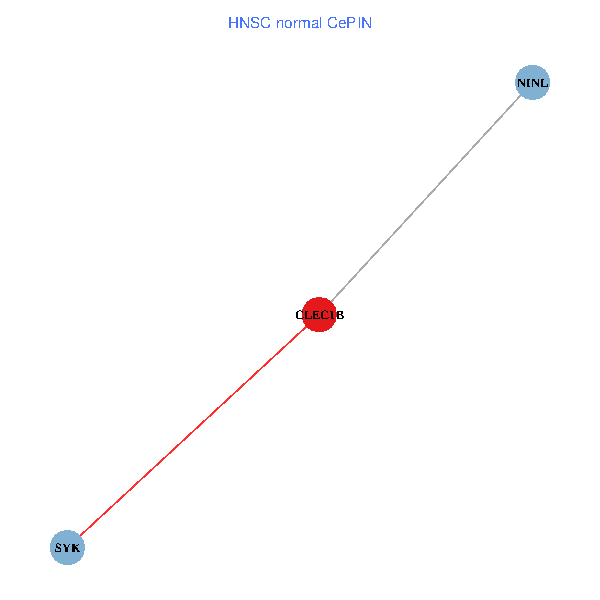
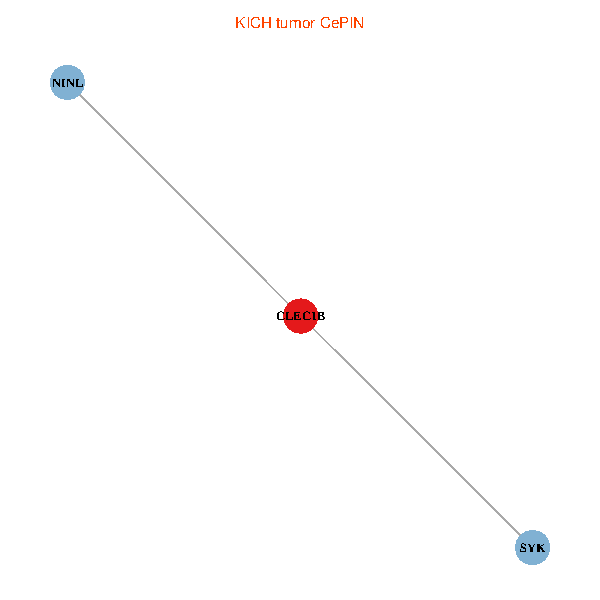
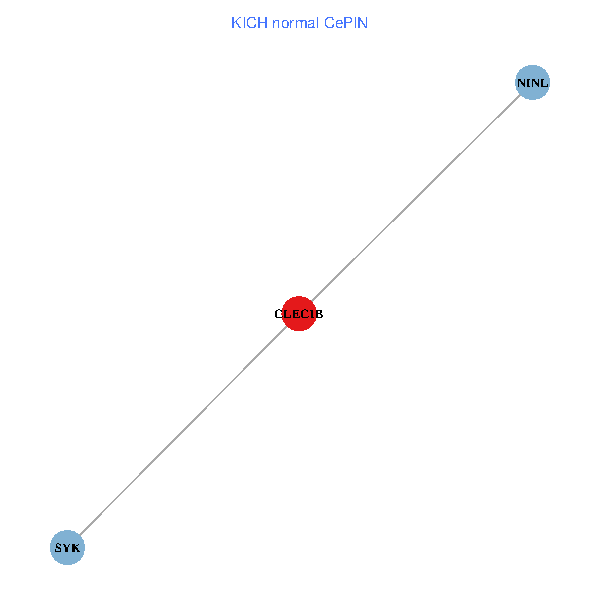
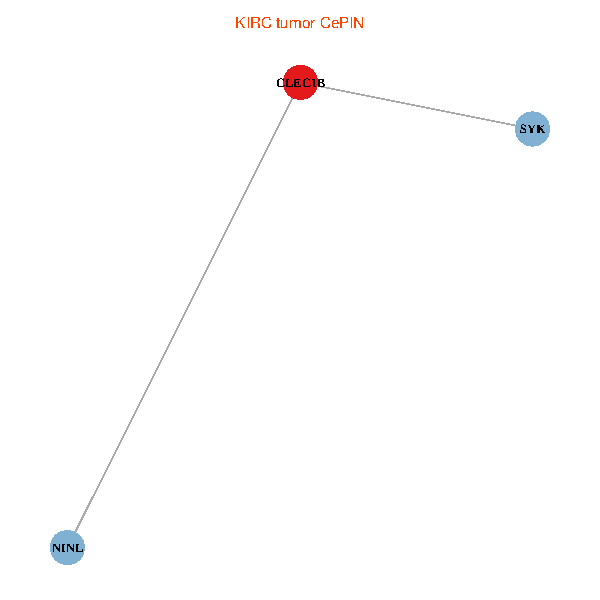
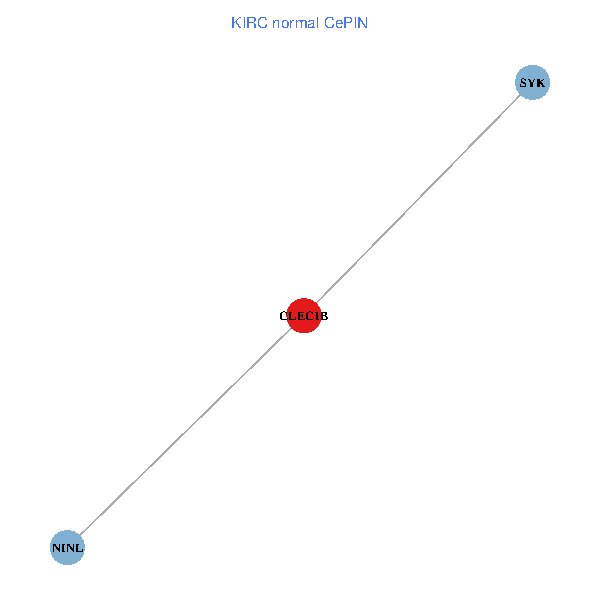
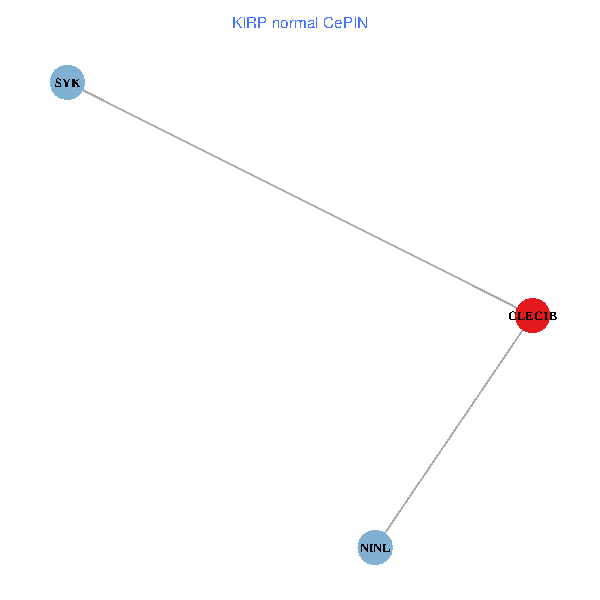
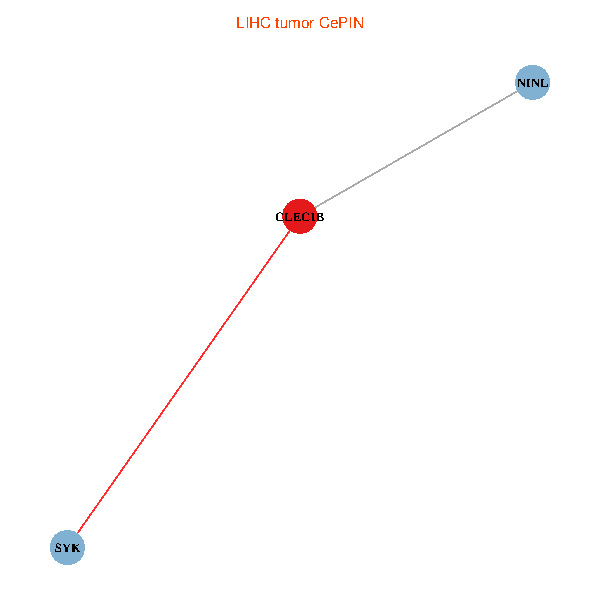
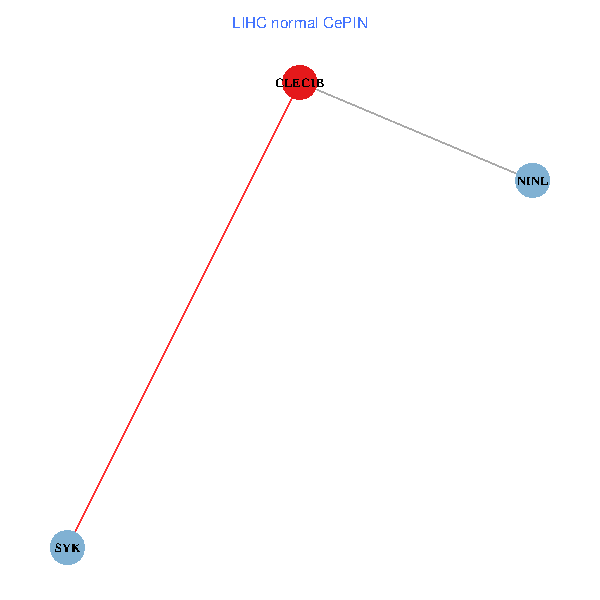
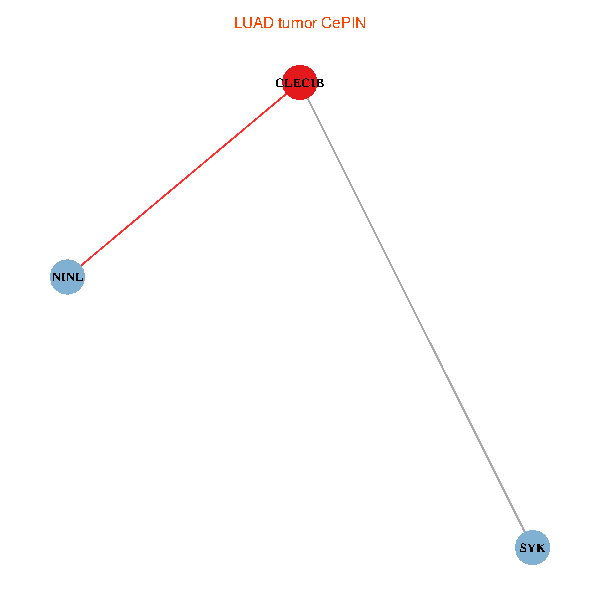
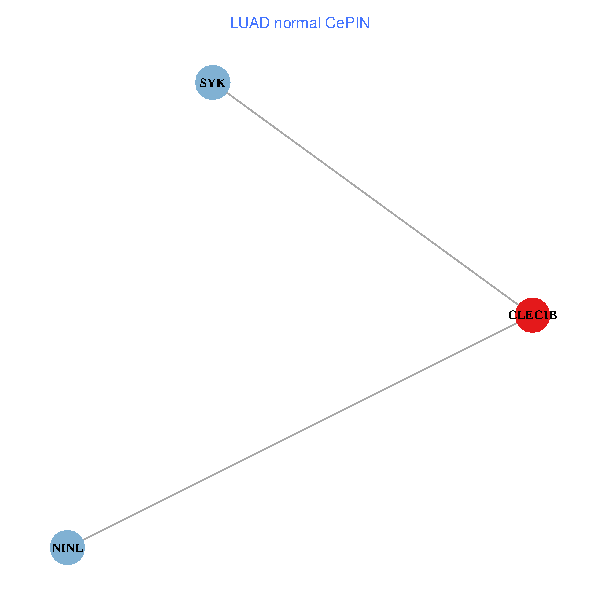
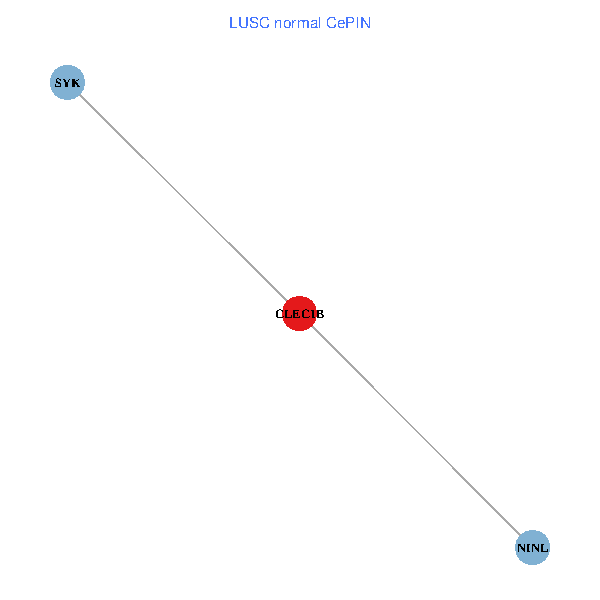
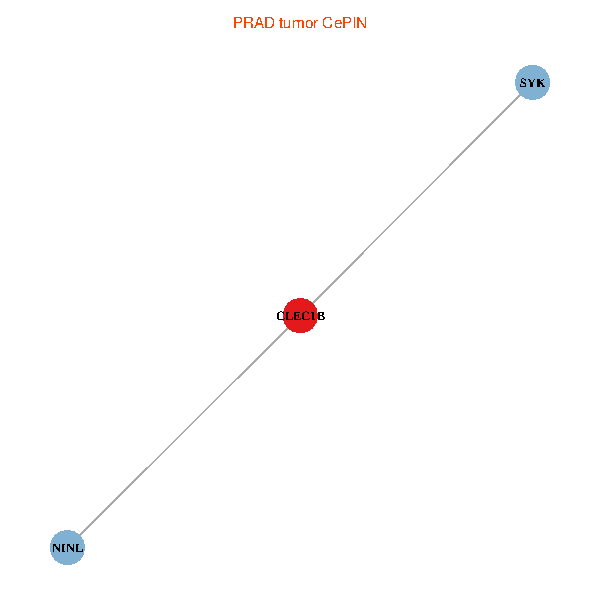
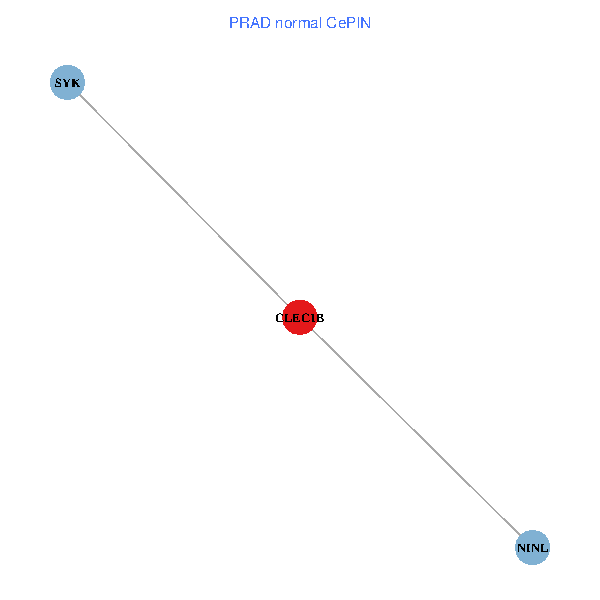
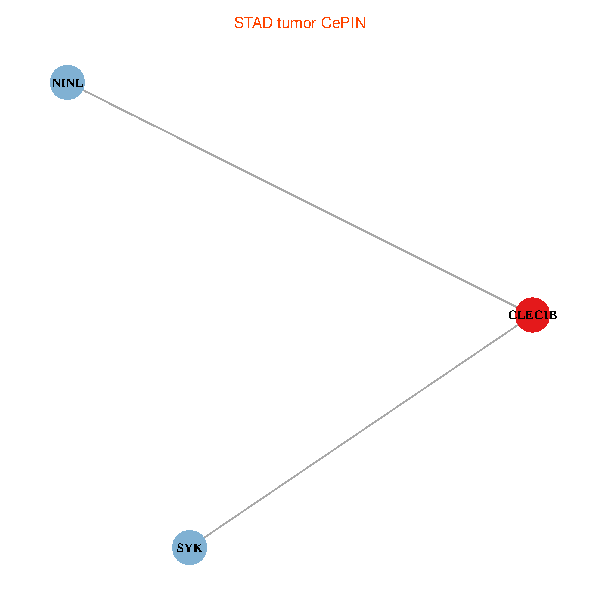
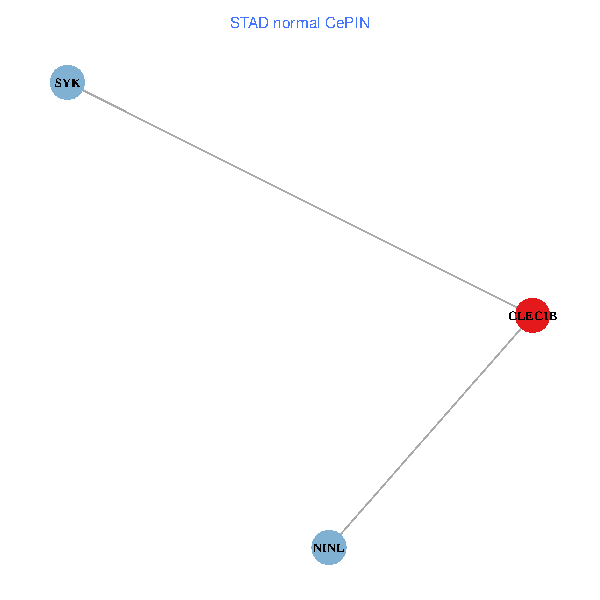
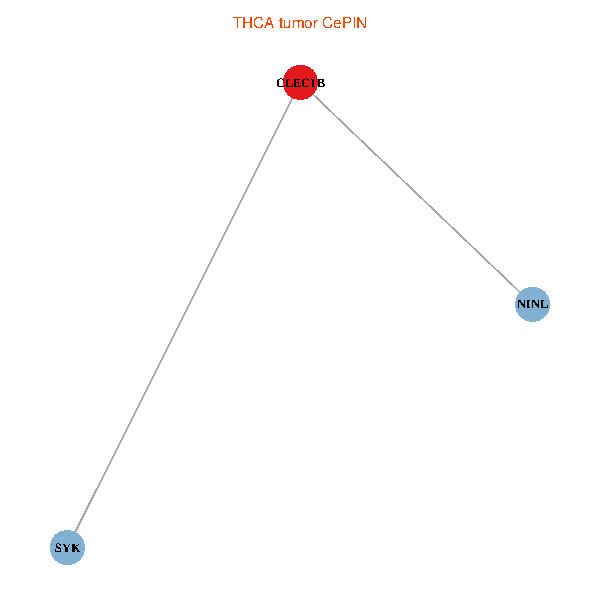
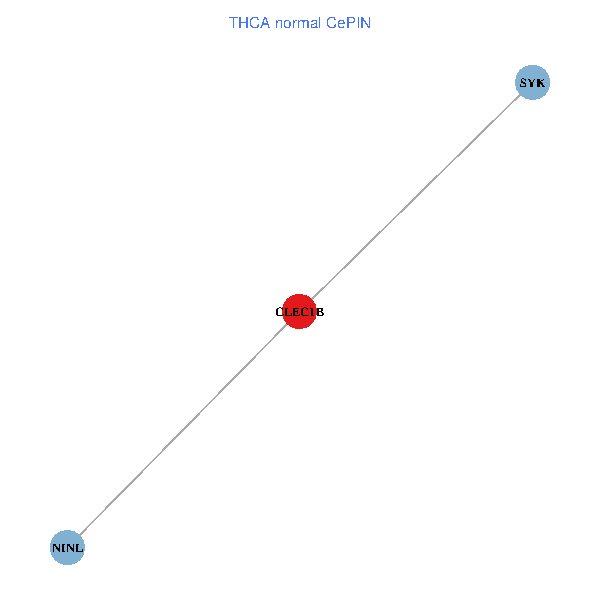
| Co-expressed gene networks based on protein-protein interaction data (CePIN) (TCGA IlluminaHiSeq_RNASeqV2, pan-cancer normalized log2(norm_counts+1) data, version 2016-08-16) (PINA2 ppi data) |
| BRCA (tumor) | BRCA (normal) |
| CLEC1B, SYK, NINL (tumor) | CLEC1B, SYK, NINL (normal) |
 |  |
| COAD (tumor) | COAD (normal) |
| CLEC1B, SYK, NINL (tumor) | CLEC1B, SYK, NINL (normal) |
 |  |
| HNSC (tumor) | HNSC (normal) |
| CLEC1B, SYK, NINL (tumor) | CLEC1B, SYK, NINL (normal) |
 |  |
| KICH (tumor) | KICH (normal) |
| CLEC1B, SYK, NINL (tumor) | CLEC1B, SYK, NINL (normal) |
 |  |
| KIRC (tumor) | KIRC (normal) |
| CLEC1B, SYK, NINL (tumor) | CLEC1B, SYK, NINL (normal) |
 |  |
| KIRP (tumor) | KIRP (normal) |
| CLEC1B, SYK, NINL (tumor) | CLEC1B, SYK, NINL (normal) |
 |  |
| LIHC (tumor) | LIHC (normal) |
| CLEC1B, SYK, NINL (tumor) | CLEC1B, SYK, NINL (normal) |
 |  |
| LUAD (tumor) | LUAD (normal) |
| CLEC1B, SYK, NINL (tumor) | CLEC1B, SYK, NINL (normal) |
 |  |
| LUSC (tumor) | LUSC (normal) |
| CLEC1B, SYK, NINL (tumor) | CLEC1B, SYK, NINL (normal) |
 |  |
| PRAD (tumor) | PRAD (normal) |
| CLEC1B, SYK, NINL (tumor) | CLEC1B, SYK, NINL (normal) |
 |  |
| STAD (tumor) | STAD (normal) |
| CLEC1B, SYK, NINL (tumor) | CLEC1B, SYK, NINL (normal) |
 |  |
| THCA (tumor) | THCA (normal) |
| CLEC1B, SYK, NINL (tumor) | CLEC1B, SYK, NINL (normal) |
 |  |
| Top |
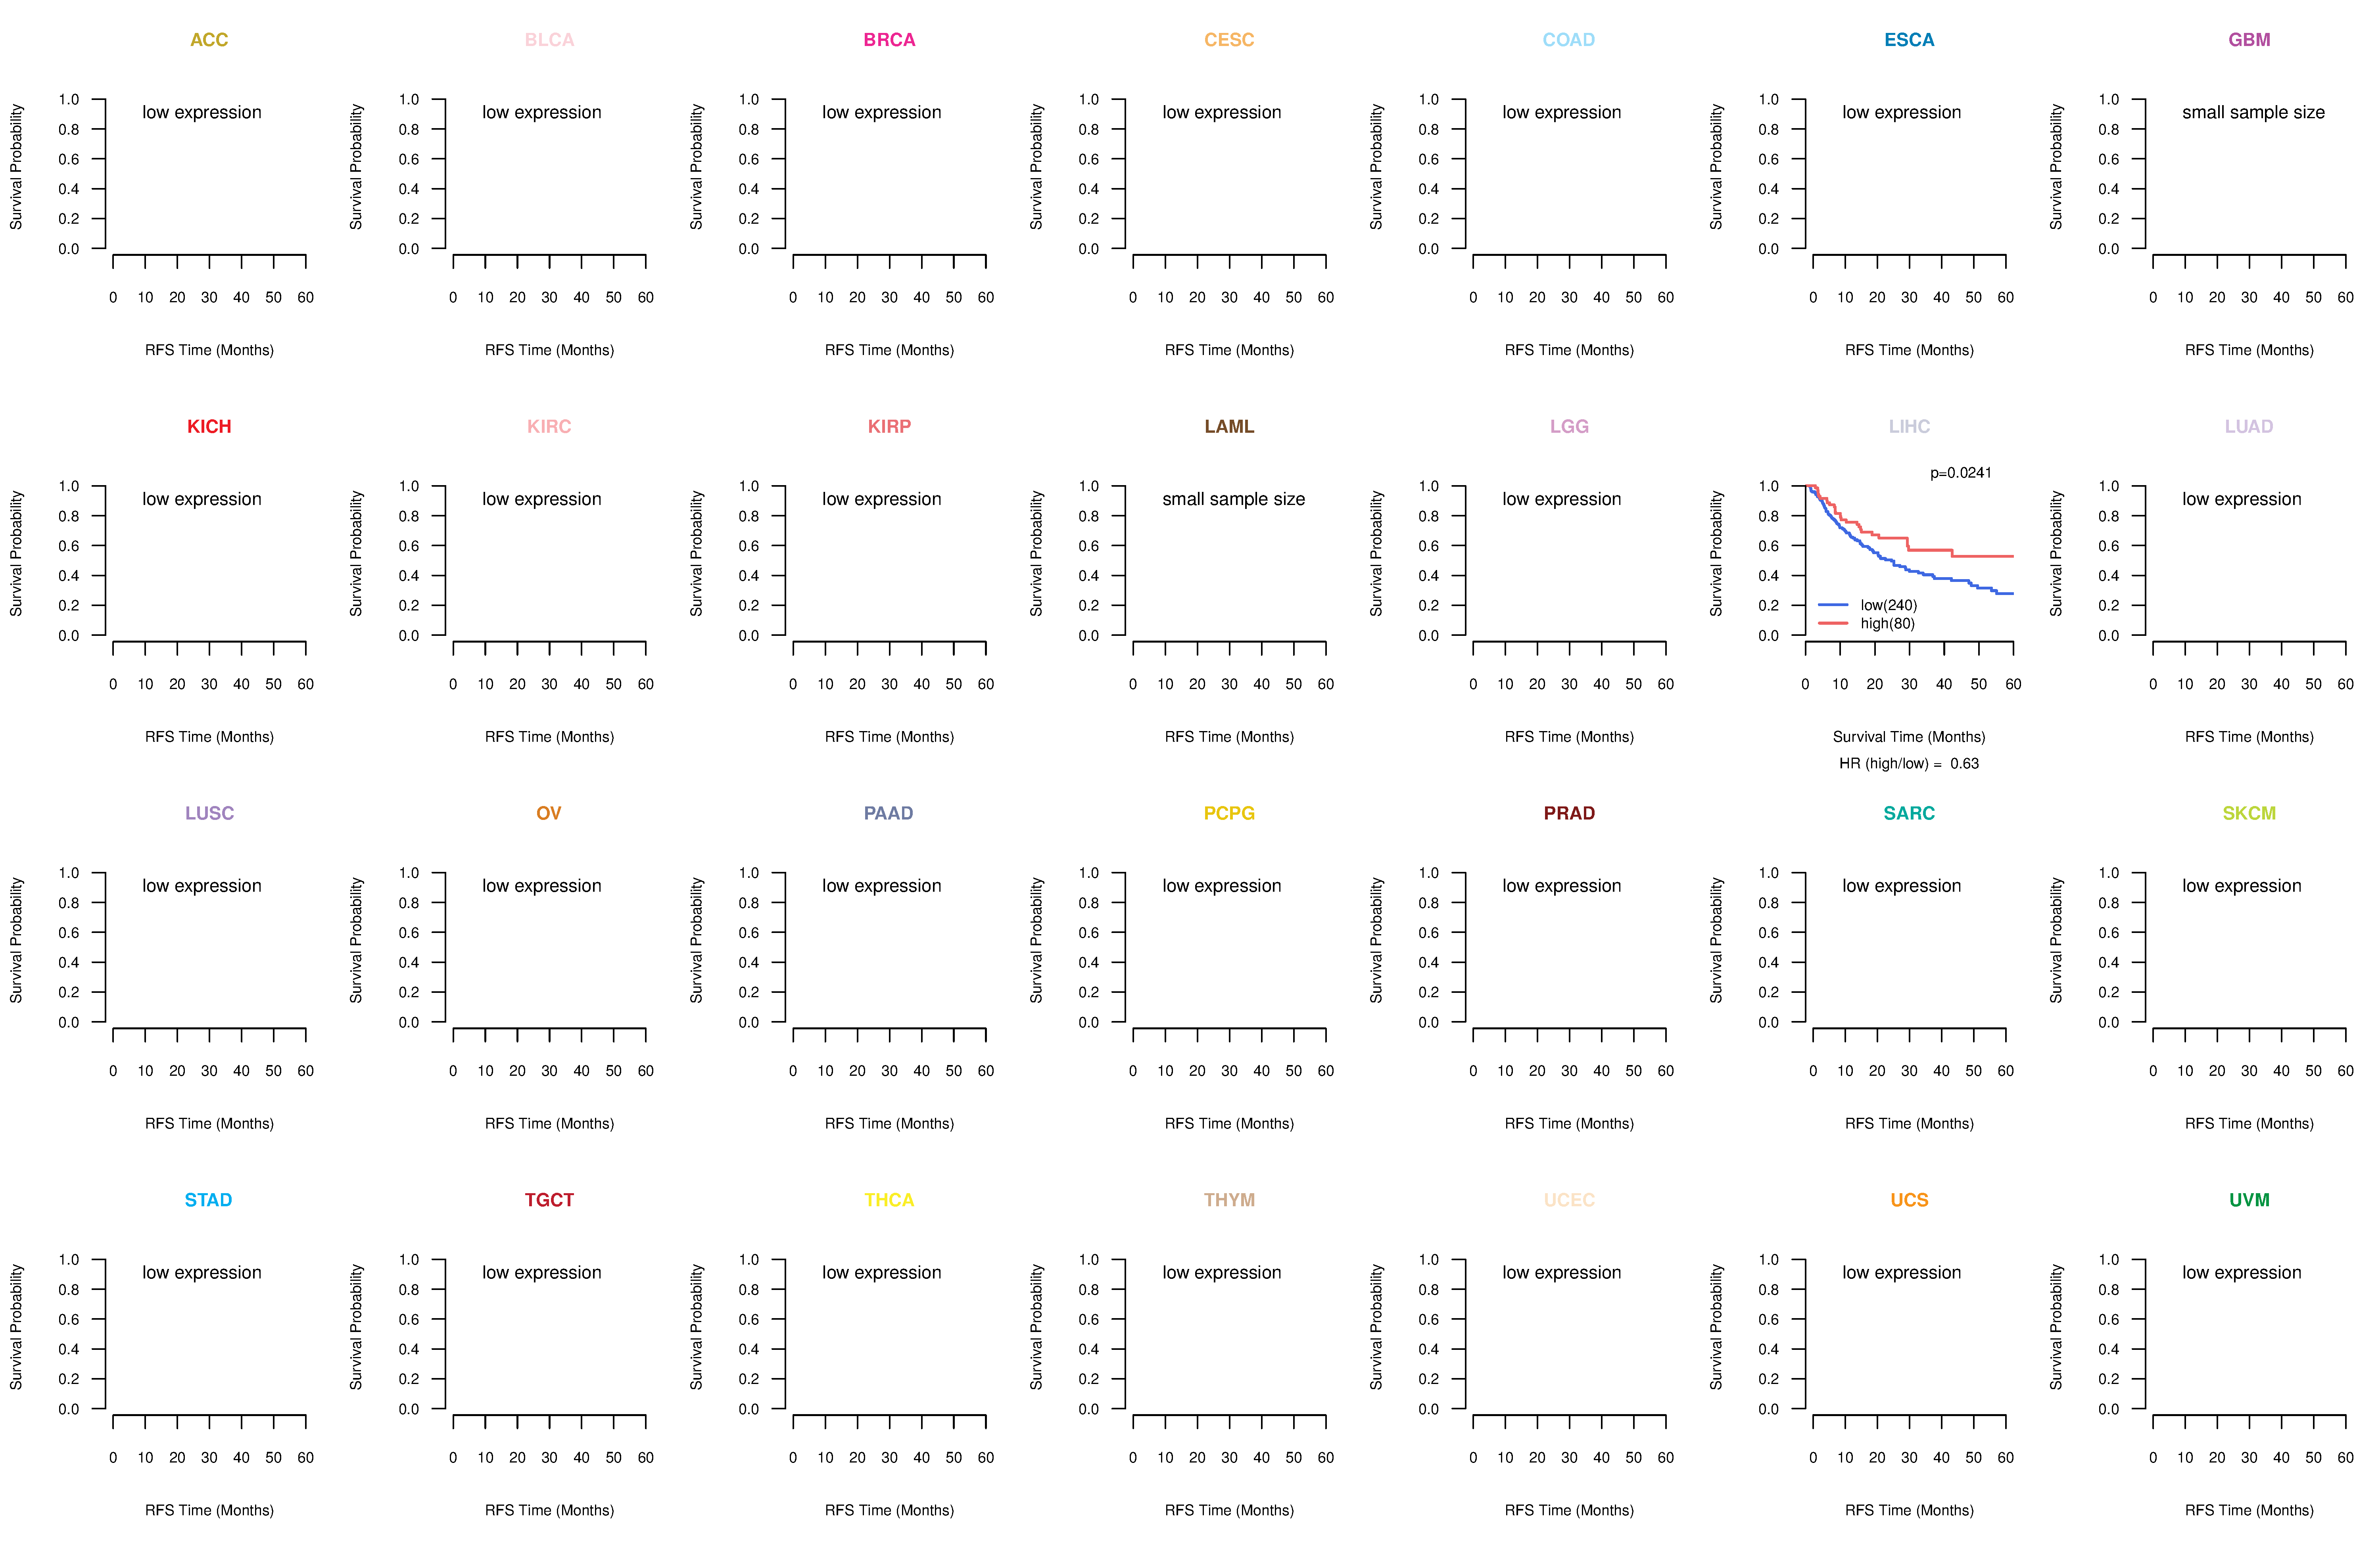
| TissGeneProg for CLEC1B |
| Kaplan-Meier plots with logrank tests of overall survival (OS) using 28 cancer types (TCGA IlluminaHiSeq_RNASeqV2, pan-cancer normalized log2(norm_counts+1) data, version 2016-08-16) (TCGA clinicalMatrix, phenotype data, version 2016-04-27) * Click on the image to enlarge it in a new window. |
 |
| Kaplan-Meier plots with logrank test of relapse free survival (RFS) using 28 cancer types (TCGA IlluminaHiSeq_RNASeqV2, pan-cancer normalized log2(norm_counts+1) data, version 2016-08-16) (TCGA clinicalMatrix, phenotype data, version 2016-04-27) * Click on the image enlarge it in a new window. |
 |
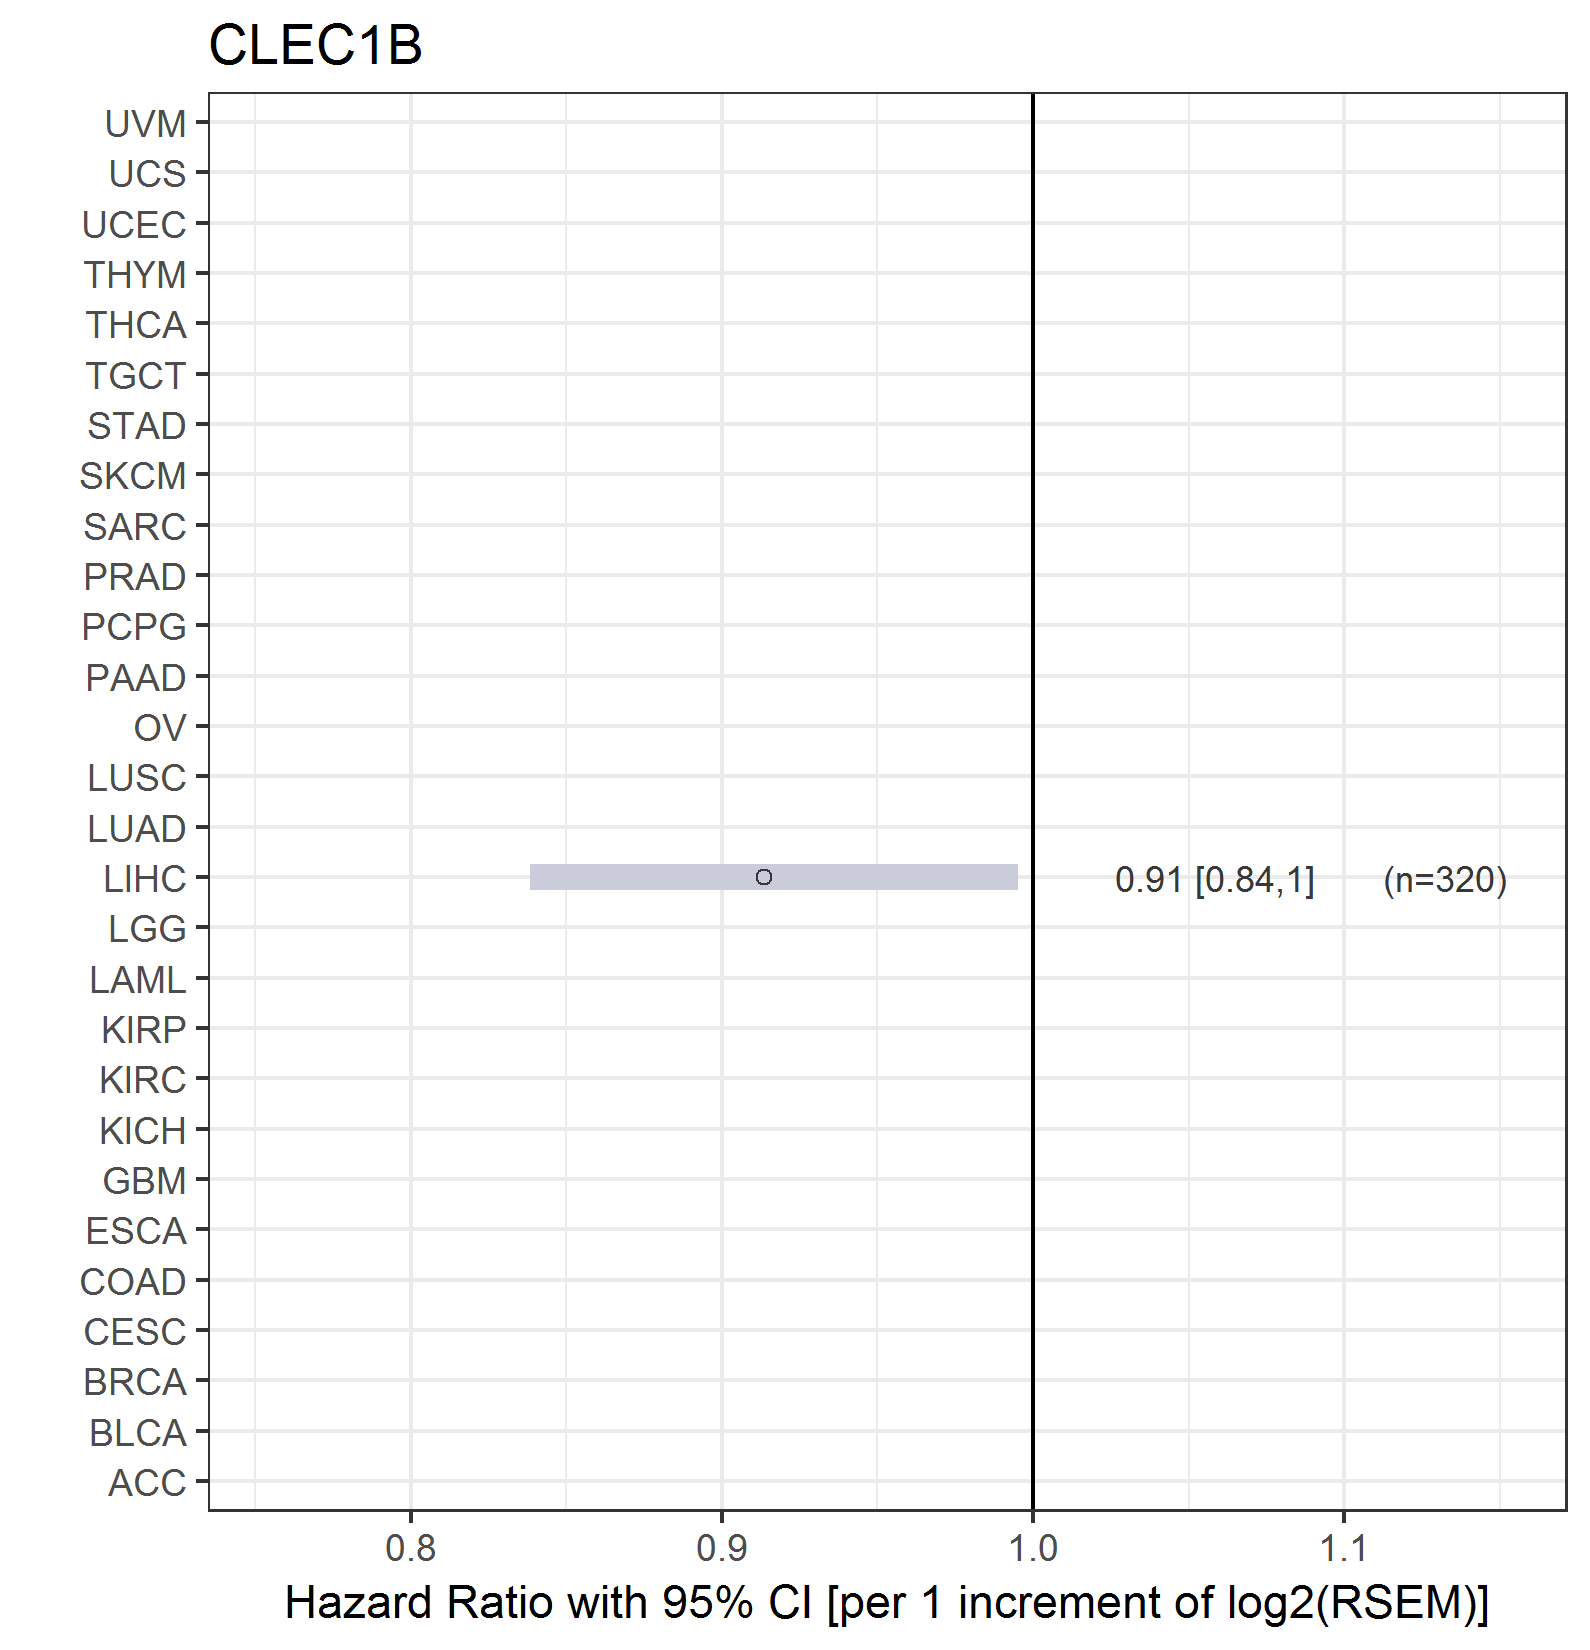
| Forest plot of Cox proportional hazard ratio (HR) and 95% CI of overall survival (OS) using 28 cancer types (TCGA IlluminaHiSeq_RNASeqV2, pan-cancer normalized log2(norm_counts+1) data, version 2016-08-16) (TCGA clinicalMatrix, phenotype data, version 2016-04-27) * Click on the image enlarge it in a new window. |
 |
| Forest plot of Cox proportional hazard ratio (HR) and 95% CI of relapse free survival (RFS) using 28 cancer types (TCGA IlluminaHiSeq_RNASeqV2, pan-cancer normalized log2(norm_counts+1) data, version 2016-08-16) (TCGA clinicalMatrix, phenotype data, version 2016-04-27) * Click on the image enlarge it in a new window. |
 |
| Top |
| TissGeneClin for CLEC1B |
| TissGeneDrug for CLEC1B |
| Drug information targeting TissGene (DrugBank Version 5.0.6, 2017-04-01) |
| DrugBank ID | Drug name | Drug activity | Drug type | Drug status |
| Top |
| TissGeneDisease for CLEC1B |
| Disease information associated with TissGene (DisGeNet, 2016-06-01) |
| Disease ID | Disease name | # pubmeds | Source |
| umls:C0027627 | Neoplasm Metastasis | 3 | BeFree,LHGDN |
| umls:C0003873 | Rheumatoid Arthritis | 2 | BeFree,GAD |
| umls:C0001925 | Albuminuria | 1 | GAD |
| umls:C0005779 | Blood Coagulation Disorders | 1 | BeFree |
| umls:C0010346 | Crohn Disease | 1 | GAD |
| umls:C0011854 | Diabetes Mellitus, Insulin-Dependent | 1 | GAD |
| umls:C0011860 | Diabetes Mellitus, Non-Insulin-Dependent | 1 | GAD |
| umls:C0020538 | Hypertensive disease | 1 | GAD |
| umls:C1956346 | Coronary Artery Disease | 1 | GAD |
|
Copyright 2016-Present - The University of Texas Health Science Center at Houston (UTHealth) Web File Viewing | How to Report, Fraud, Waste and Abuse | State of Texas | Statewide Search | Texas Homeland Security | Site Policies |