 |
| |
| |
| |
| |
| |
| |
|

| TissGeneSummary for HPCAL4 |
 Gene summary Gene summary |
| Basic gene information | Gene symbol | HPCAL4 |
| Gene name | hippocalcin like 4 | |
| Synonyms | HLP4 | |
| Cytomap | UCSC genome browser: 1p34.2 | |
| Type of gene | protein-coding | |
| RefGenes | NM_001282396.1, NM_001282397.1,NM_016257.3, | |
| Description | hippocalcin-like protein 4 | |
| Modification date | 20141207 | |
| dbXrefs | HGNC : HGNC | |
| Ensembl : ENSG00000116983 | ||
| HPRD : 17113 | ||
| Vega : OTTHUMG00000009246 | ||
| Protein | UniProt: go to UniProt's Cross Reference DB Table | |
| Expression | CleanEX: HS_HPCAL4 | |
| BioGPS: 51440 | ||
| Pathway | NCI Pathway Interaction Database: HPCAL4 | |
| KEGG: HPCAL4 | ||
| REACTOME: HPCAL4 | ||
| Pathway Commons: HPCAL4 | ||
| Context | iHOP: HPCAL4 | |
| ligand binding site mutation search in PubMed: HPCAL4 | ||
| UCL Cancer Institute: HPCAL4 | ||
| Assigned class in TissGDB* | C | |
| Included tissue-specific gene expression resources | HPA,TiGER | |
| Specific-tissues in normal samples (assigned by TissGDB using HPA, TiGER, and GTEx) | Brain | |
| Cancer types related to the specific-tissues in cancer samples (assigned by TissGDB using TCGA) | GBM,LGG | |
| Reference showing the relevant tissue of HPCAL4 | ||
| Description by TissGene annotations | Have significant anti-correlated miRNA | |
| * Class A consists of genes with literature evidence and is part of the cTissGenes. Class B consists of only cTissGenes without additional evidence. The remaining genes belong to Class C. |
| Gene ontology having evidence of Inferred from Direct Assay (IDA) from Entrez |
| GO ID | GO term | PubMed ID |
| Top |
| TissGeneExp for HPCAL4 |
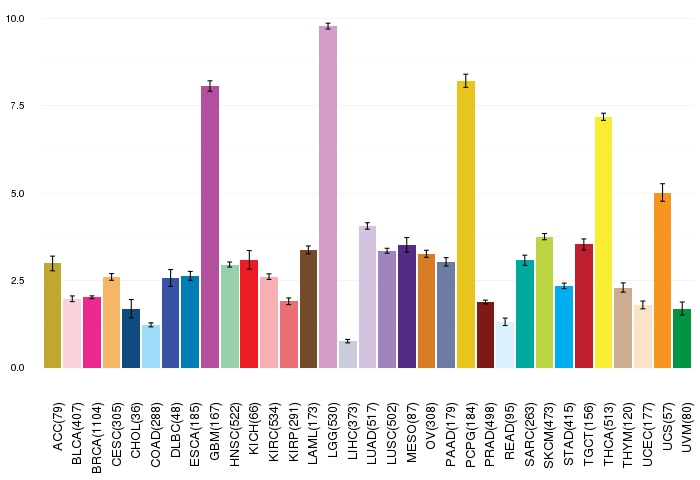
| Gene expressions across 28 cancer types (X-axis: cancer type and Y-axis: log2(norm_counts+1)) (TCGA IlluminaHiSeq_RNASeqV2, pan-cancer normalized log2(norm_counts+1) data, version 2016-08-16) |
 |
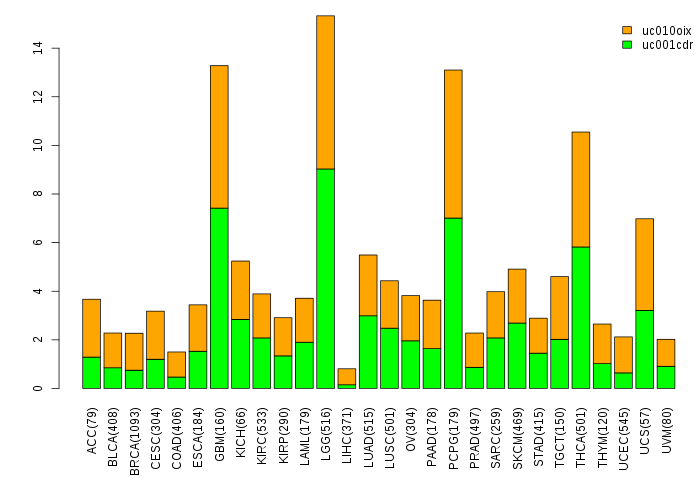
| Gene isoform expressions across 28 cancer types (X-axis: cancer type and Y-axis: log2(norm_counts+1)) (TCGA pan-cancer tcga_rsem_isoform_tpm, version 2016-09-01) |
 |
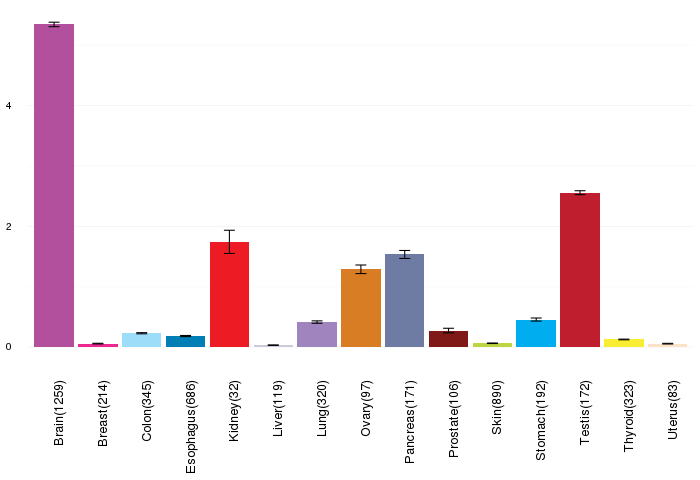
| Gene expressions across normal tissues of GTEx data (GTEx GTEx_Analysis_v6_RNA-seq_RNA-SeQCv1.1.8_gene_rpkm.gct) - Here, we shows the matched tissue types only among our 28 cancer types. |
 |
| Different expressions across 14 cancer types with more than 10 samples between matched tumors and normals (X-axis: cancer type and Y-axis: log2(norm_counts+1)) (TCGA IlluminaHiSeq_RNASeqV2, pan-cancer normalized log2(norm_counts+1) data, version 2016-08-16) |
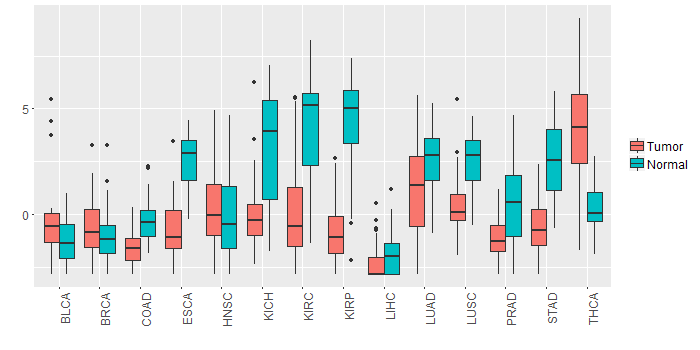 |
| - Significantly differentially expressed cancer types and information. (|Fold change|>1 and FDR<0.05) |
| Cancer type | Mean(exp) in tumor | Mean(exp) in matched normal | Log2FC | P-val. | FDR |
| PRAD | -1.132541444 | 0.533912402 | -1.666453846 | 7.87E-08 | 7.57E-07 |
| THCA | 4.061154808 | 0.324666672 | 3.736488136 | 3.22E-17 | 6.20E-16 |
| KICH | 0.169577249 | 3.277209249 | -3.107632 | 1.52E-05 | 4.62E-05 |
| COAD | -1.612347213 | -0.285877982 | -1.326469231 | 6.65E-06 | 3.16E-05 |
| STAD | -0.512299376 | 2.575956874 | -3.08825625 | 2.03E-10 | 2.28E-08 |
| KIRP | -0.872483751 | 4.189397499 | -5.06188125 | 9.38E-14 | 1.86E-12 |
| LUSC | 0.399784386 | 2.495233405 | -2.09544902 | 2.77E-12 | 1.24E-11 |
| KIRC | 0.015005137 | 4.020728749 | -4.005723611 | 1.78E-18 | 1.22E-17 |
| ESCA | -0.535876933 | 2.463104885 | -2.998981818 | 0.000471 | 0.008952067 |
| LUAD | 1.231377455 | 2.581811938 | -1.350434483 | 9.34E-05 | 0.000238064 |
| Top |
| TissGene-miRNA for HPCAL4 |
| Significantly anti-correlated miRNAs of TissGene across 28 cancer types (Gene-miRNA relations from TargetScanHuman Relsease 7.1, Conserved_Site_Context_Scores.txt.zip, 06.01.2016) (TCGA IlluminaHiSeq_miRNASeq, log2(RPM+1) data, version 2016-11-21) (TCGA IlluminaHiSeq_RNASeqV2, log2(normalized_count+1) data, version 2016-08-16) (Spearman’s Rank Correlation (p-value<0.05 and coefficient<-0.25)) |
| Cancer type | miRNA id | miRNA accession | P-val. | Coeff. | # samples |
| LUAD | hsa-miR-335-5p | MIMAT0000765 | 0.0019 | -0.4 | 60 |
| Top |
| TissGeneMut for HPCAL4 |
| TissGeneSNV for HPCAL4 |
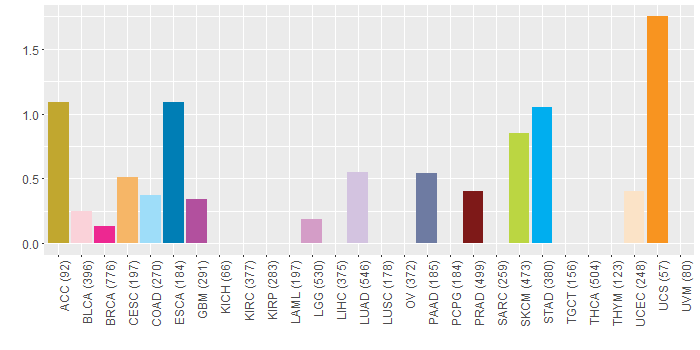
| nsSNV counts per each loci. Different colors of circles represent different cancer types. Circle size denotes number of samples. (TCGA somatic mutation (SNPs and small INDELs) data, version 2016-04-25) * Click on the image to enlarge it in a new window. |
 |
 |
| Somatic nucleotide variants of TissGene across 28 cancer types (X-axis: cancer type and Y-axis: % of mutated samples) The numbers in parentheses are numbers of samples with mutation (nsSNVs). (TCGA somatic mutation (SNPs and small INDELs) data, version 2016-04-25) |
 |
| - nsSNVs sorted by frequency. |
| AAchange | Cancer type | # samples |
| p.S23R | ESCA | 2 |
| p.R139H | SKCM | 1 |
| p.A65T | GBM | 1 |
| p.G112S | COAD | 1 |
| p.L183F | LUAD | 1 |
| p.S23R | BRCA | 1 |
| p.Q149K | LUAD | 1 |
| p.Y52F | BLCA | 1 |
| p.T146M | ESCA | 1 |
| p.D37N | SKCM | 1 |
| p.I86N | PRAD | 1 |
| p.A104D | PRAD | 1 |
| p.F69I | SKCM | 1 |
| p.A174V | SKCM | 1 |
| p.V135M | UCS | 1 |
| p.G95S | STAD | 1 |
| p.V135M | LUAD | 1 |
| p.D109N | CESC | 1 |
| p.G41S | PAAD | 1 |
| p.M121I | STAD | 1 |
| p.A61T | STAD | 1 |
| p.G144R | UCEC | 1 |
| p.G144R | ACC | 1 |
| p.R139H | LGG | 1 |
| p.A65V | STAD | 1 |
| Top |
| TissGeneCNV for HPCAL4 |
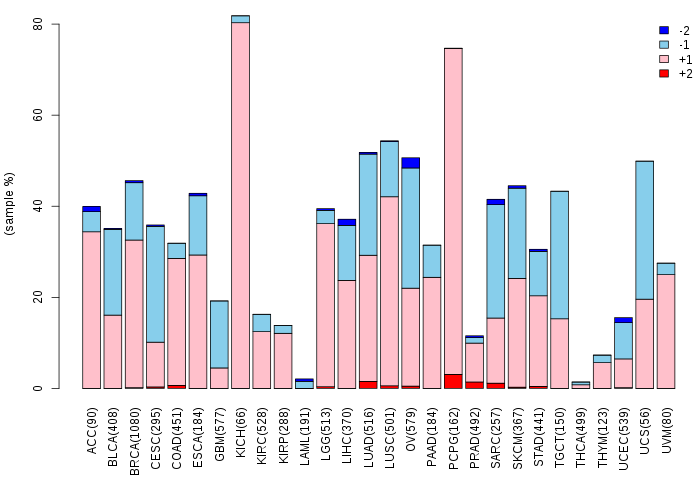
| Copy number variations of TissGene across 28 cancer types (X-axis: cancer type and Y-axis: % of CNV samples) (TCGA Gistic2_CopyNumber_Gistic2_all_data_by_genes, Gistic2 copy number data, version 2016-08-16) |
 |
| Top |
| TissGeneFusions for HPCAL4 |
| Fusion genes including TissGene (ChimerDB 3.0, 2016-12-01 and TCGA fusion Portal 2015-12-01) |
| Database | Src | Cancer type | Sample | Fusion gene | ORF | 5'-gene BP | 3'-gene BP |
| Chimerdb3.0 | ChiTaRs | NA | DA136945 | HPCAL4-UBC | chr1:40157061 | chr12:125398055 | |
| Chimerdb3.0 | ChiTaRs | NA | H19757 | MED1-HPCAL4 | chr17:37565638 | chr1:40144653 | |
| Chimerdb3.0 | ChiTaRs | NA | H21133 | MED1-HPCAL4 | chr17:37565638 | chr1:40144655 | |
| Chimerdb3.0 | FusionScan | UCS | TCGA-NF-A4WX-01A | SF3A3-HPCAL4 | CDS-5'UTR | chr1:38425791 | chr1:40150283 |
| Top |
| TissGeneNet for HPCAL4 |
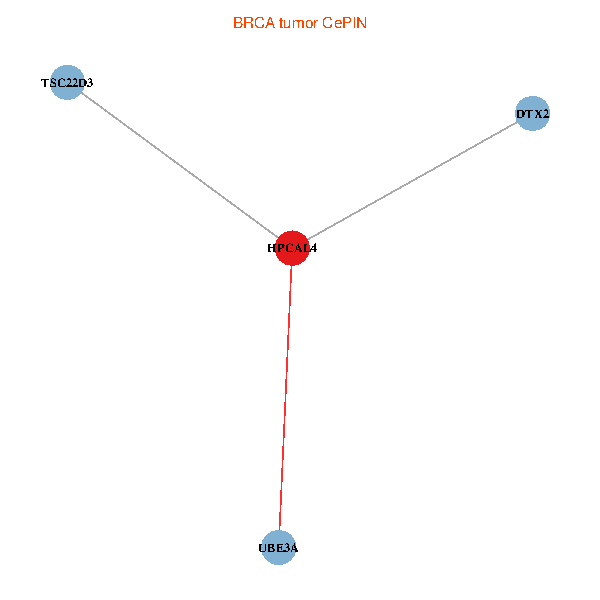
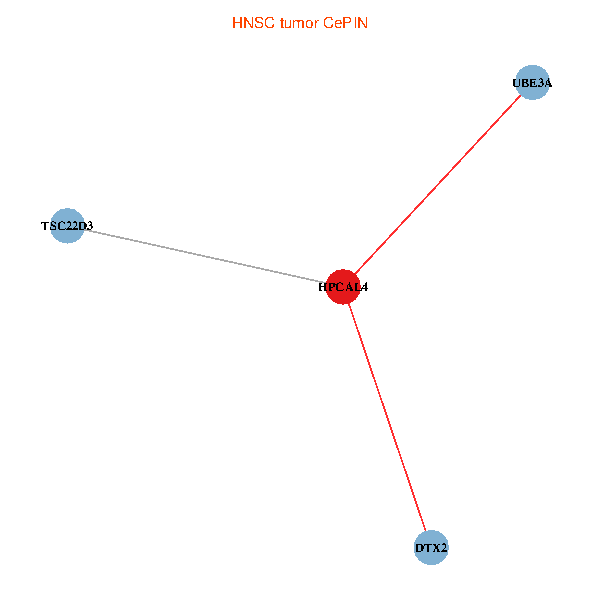
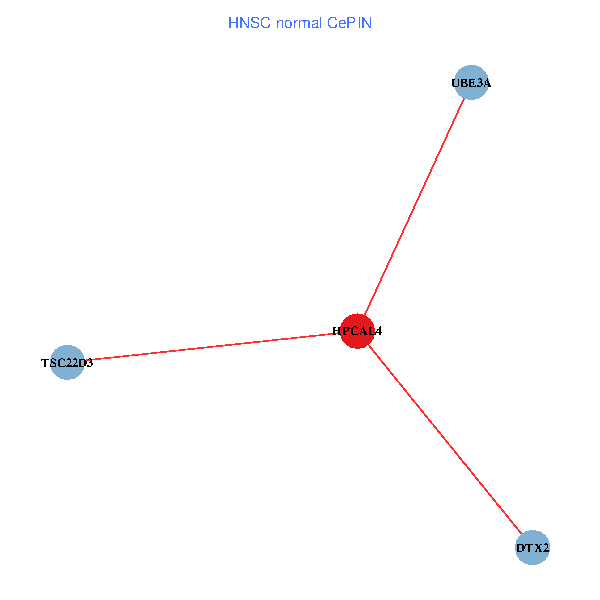
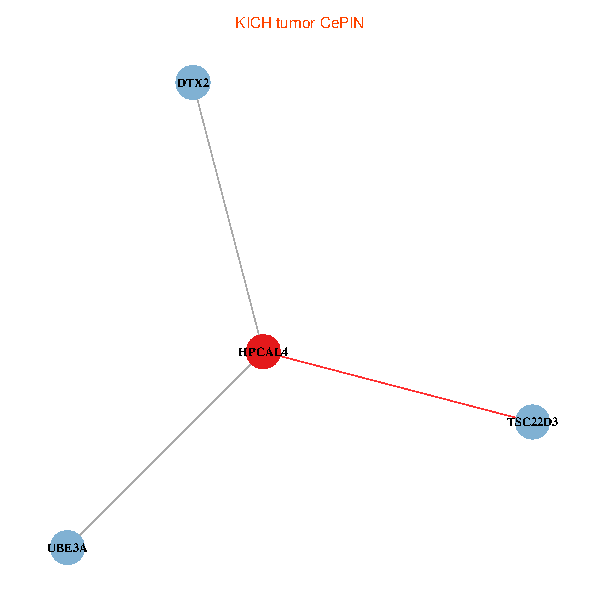
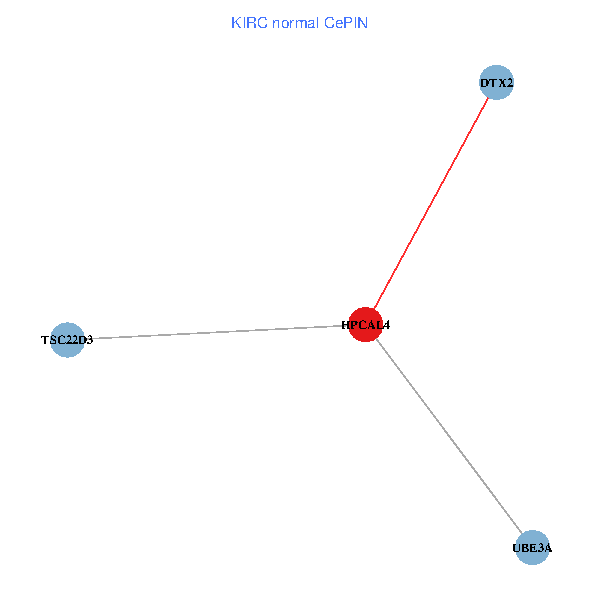
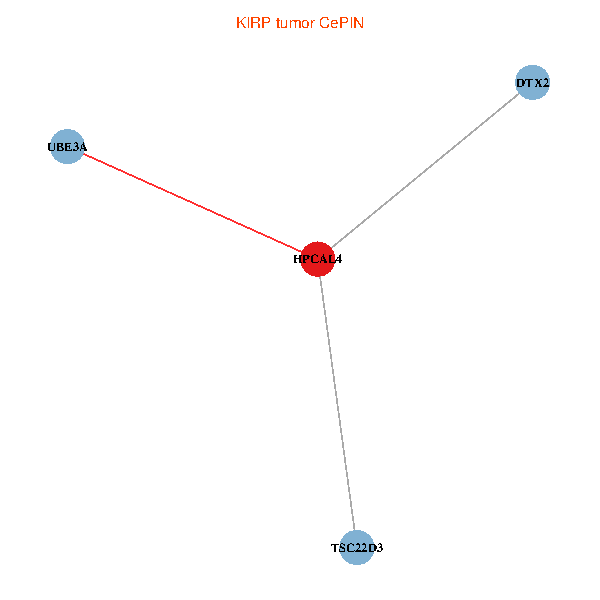
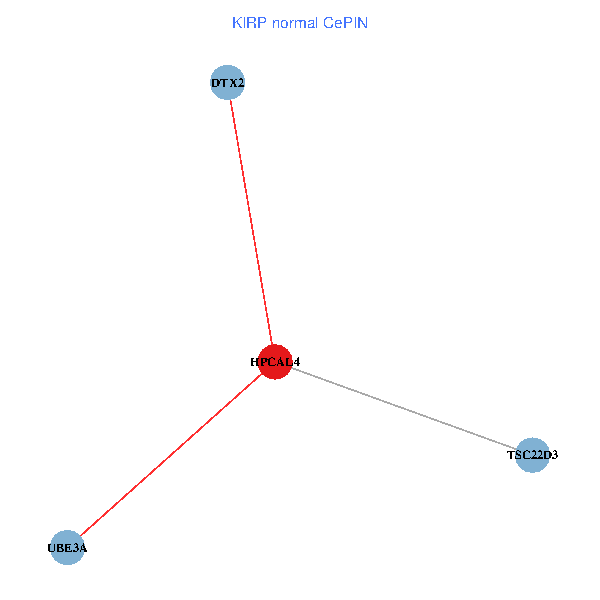
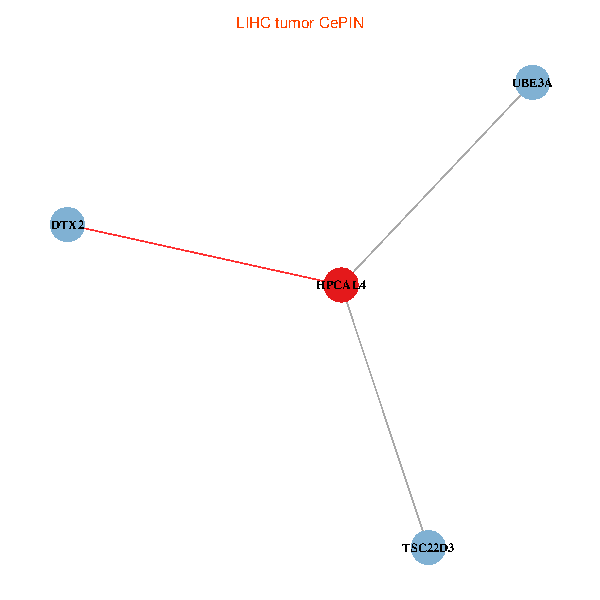
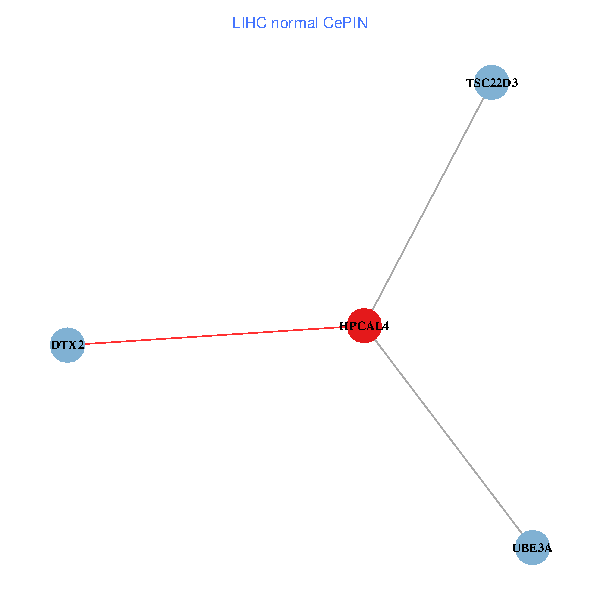
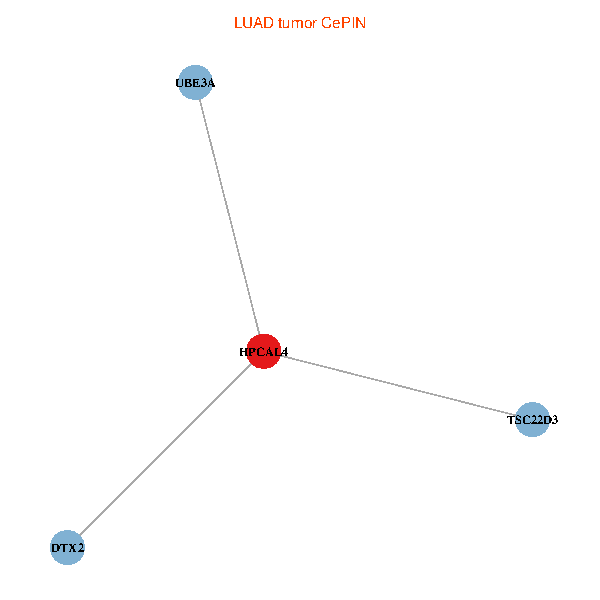
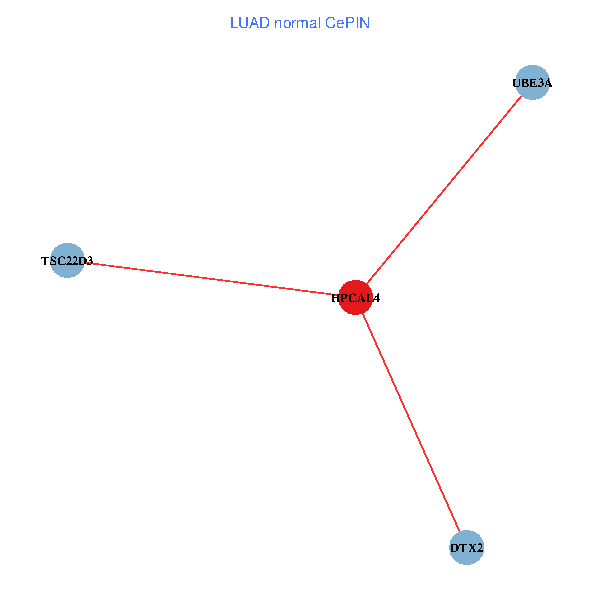
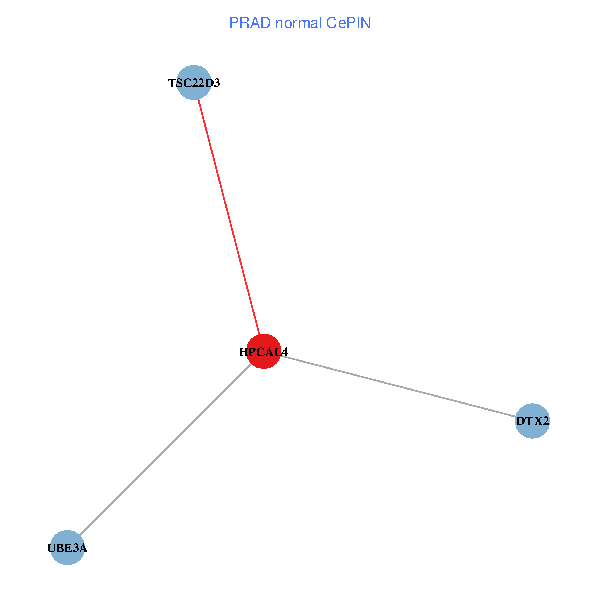
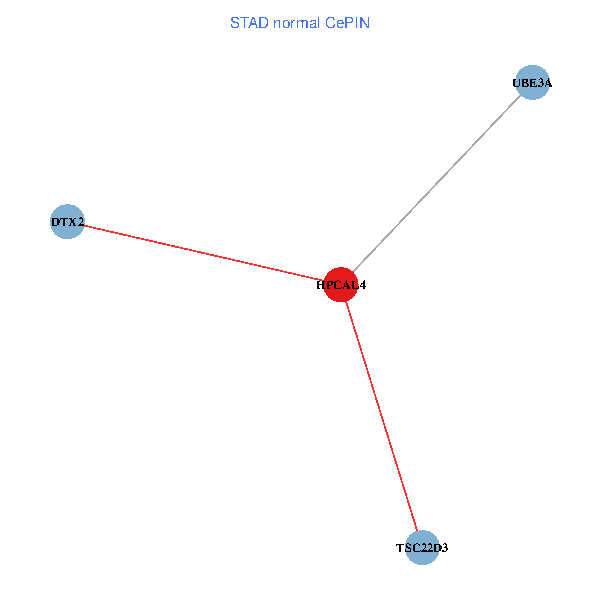
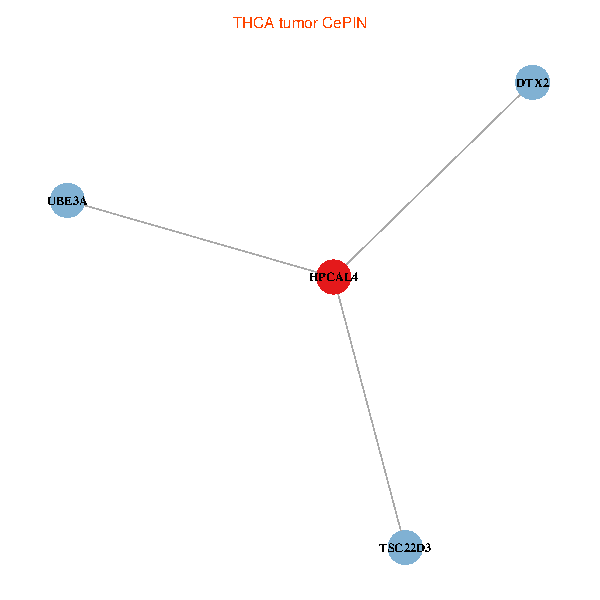
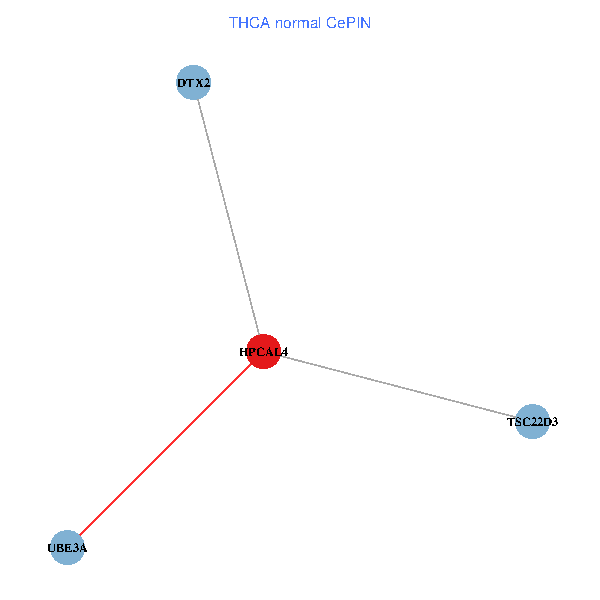
| Co-expressed gene networks based on protein-protein interaction data (CePIN) (TCGA IlluminaHiSeq_RNASeqV2, pan-cancer normalized log2(norm_counts+1) data, version 2016-08-16) (PINA2 ppi data) |
| BRCA (tumor) | BRCA (normal) |
| HPCAL4, DTX2, UBE3A, TSC22D3 (tumor) | HPCAL4, DTX2, UBE3A, TSC22D3 (normal) |
 |  |
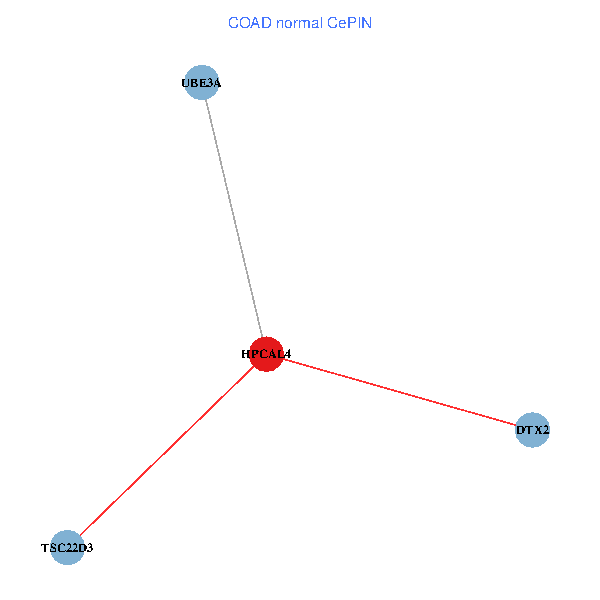
| COAD (tumor) | COAD (normal) |
| HPCAL4, DTX2, UBE3A, TSC22D3 (tumor) | HPCAL4, DTX2, UBE3A, TSC22D3 (normal) |
 |  |
| HNSC (tumor) | HNSC (normal) |
| HPCAL4, DTX2, UBE3A, TSC22D3 (tumor) | HPCAL4, DTX2, UBE3A, TSC22D3 (normal) |
 |  |
| KICH (tumor) | KICH (normal) |
| HPCAL4, DTX2, UBE3A, TSC22D3 (tumor) | HPCAL4, DTX2, UBE3A, TSC22D3 (normal) |
 |  |
| KIRC (tumor) | KIRC (normal) |
| HPCAL4, DTX2, UBE3A, TSC22D3 (tumor) | HPCAL4, DTX2, UBE3A, TSC22D3 (normal) |
 |  |
| KIRP (tumor) | KIRP (normal) |
| HPCAL4, DTX2, UBE3A, TSC22D3 (tumor) | HPCAL4, DTX2, UBE3A, TSC22D3 (normal) |
 |  |
| LIHC (tumor) | LIHC (normal) |
| HPCAL4, DTX2, UBE3A, TSC22D3 (tumor) | HPCAL4, DTX2, UBE3A, TSC22D3 (normal) |
 |  |
| LUAD (tumor) | LUAD (normal) |
| HPCAL4, DTX2, UBE3A, TSC22D3 (tumor) | HPCAL4, DTX2, UBE3A, TSC22D3 (normal) |
 |  |
| LUSC (tumor) | LUSC (normal) |
| HPCAL4, DTX2, UBE3A, TSC22D3 (tumor) | HPCAL4, DTX2, UBE3A, TSC22D3 (normal) |
 |  |
| PRAD (tumor) | PRAD (normal) |
| HPCAL4, DTX2, UBE3A, TSC22D3 (tumor) | HPCAL4, DTX2, UBE3A, TSC22D3 (normal) |
 |  |
| STAD (tumor) | STAD (normal) |
| HPCAL4, DTX2, UBE3A, TSC22D3 (tumor) | HPCAL4, DTX2, UBE3A, TSC22D3 (normal) |
 |  |
| THCA (tumor) | THCA (normal) |
| HPCAL4, DTX2, UBE3A, TSC22D3 (tumor) | HPCAL4, DTX2, UBE3A, TSC22D3 (normal) |
 |  |
| Top |
| TissGeneProg for HPCAL4 |
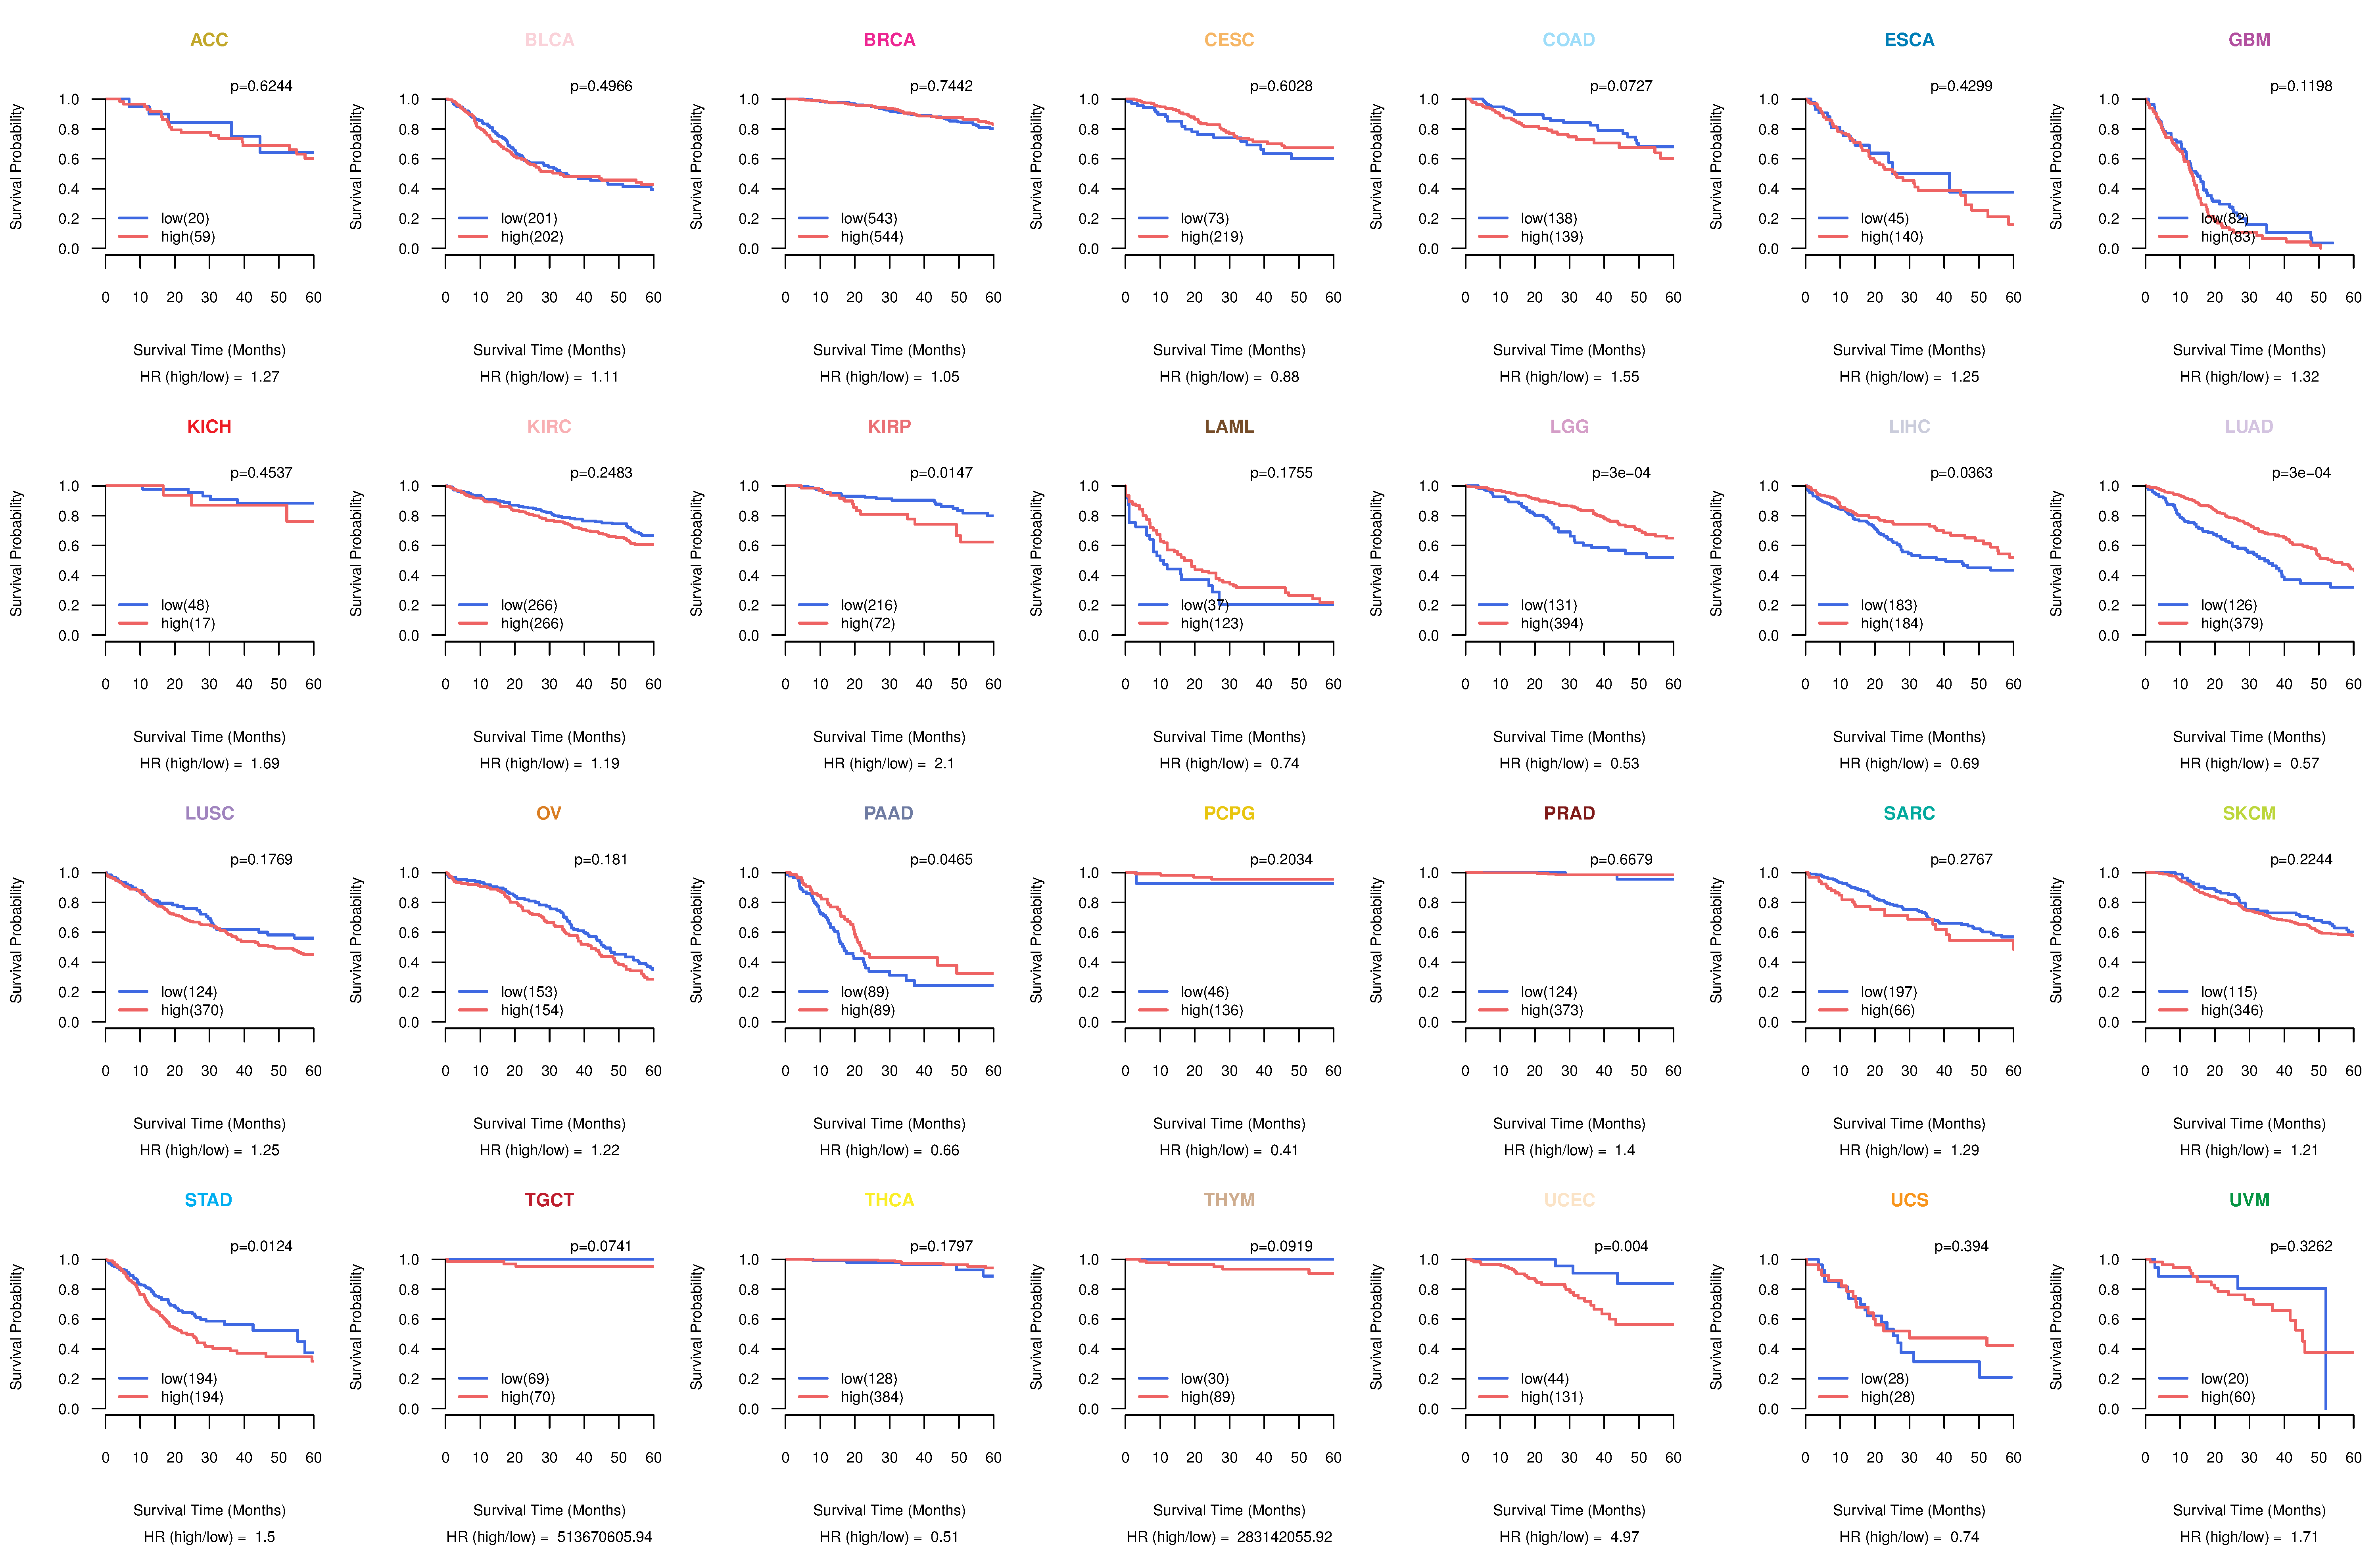
| Kaplan-Meier plots with logrank tests of overall survival (OS) using 28 cancer types (TCGA IlluminaHiSeq_RNASeqV2, pan-cancer normalized log2(norm_counts+1) data, version 2016-08-16) (TCGA clinicalMatrix, phenotype data, version 2016-04-27) * Click on the image to enlarge it in a new window. |
 |
| Kaplan-Meier plots with logrank test of relapse free survival (RFS) using 28 cancer types (TCGA IlluminaHiSeq_RNASeqV2, pan-cancer normalized log2(norm_counts+1) data, version 2016-08-16) (TCGA clinicalMatrix, phenotype data, version 2016-04-27) * Click on the image enlarge it in a new window. |
 |
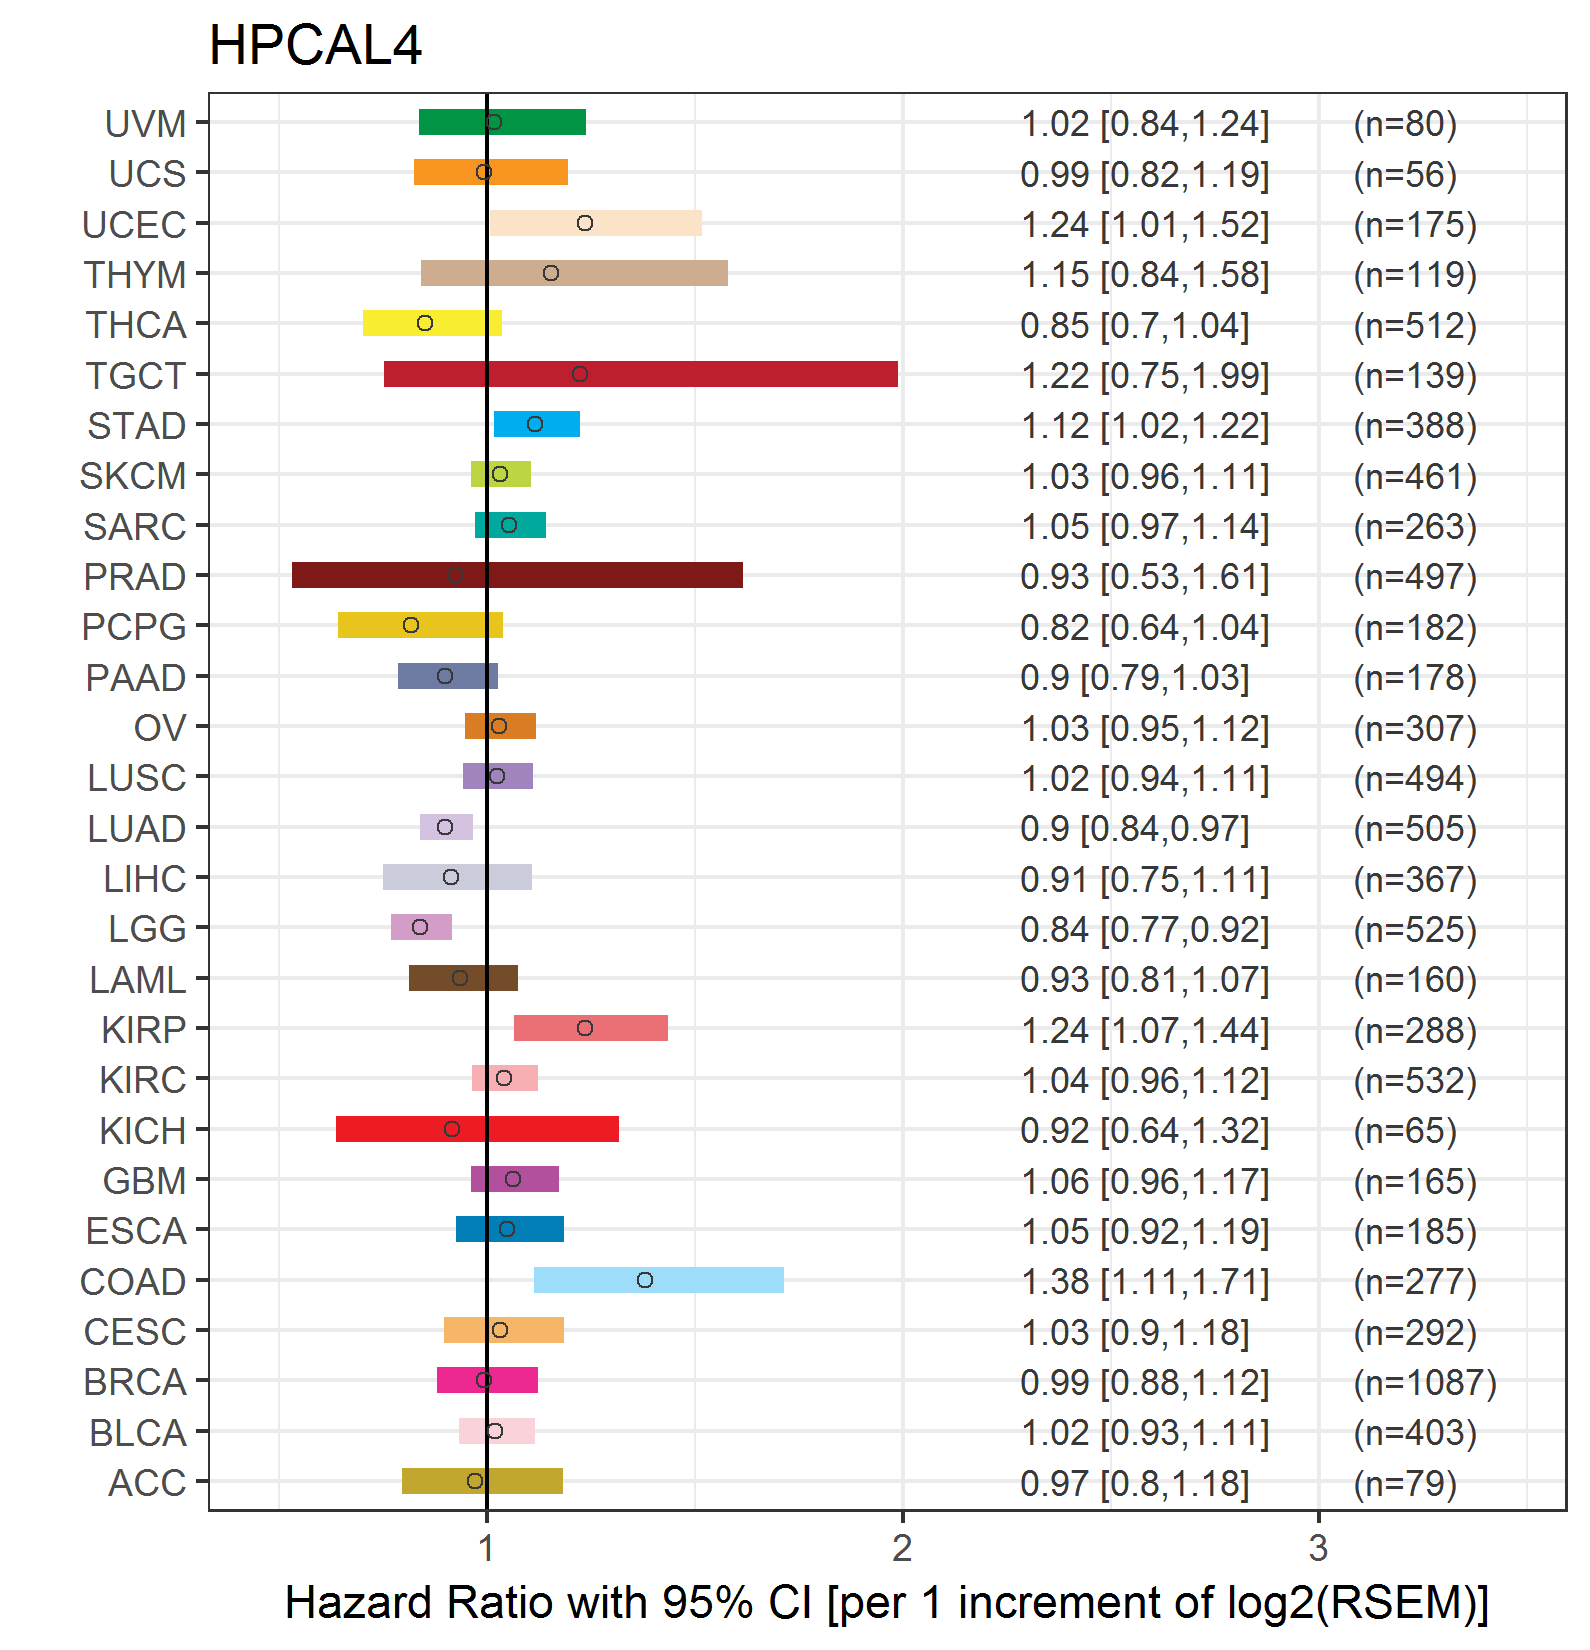
| Forest plot of Cox proportional hazard ratio (HR) and 95% CI of overall survival (OS) using 28 cancer types (TCGA IlluminaHiSeq_RNASeqV2, pan-cancer normalized log2(norm_counts+1) data, version 2016-08-16) (TCGA clinicalMatrix, phenotype data, version 2016-04-27) * Click on the image enlarge it in a new window. |
 |
| Forest plot of Cox proportional hazard ratio (HR) and 95% CI of relapse free survival (RFS) using 28 cancer types (TCGA IlluminaHiSeq_RNASeqV2, pan-cancer normalized log2(norm_counts+1) data, version 2016-08-16) (TCGA clinicalMatrix, phenotype data, version 2016-04-27) * Click on the image enlarge it in a new window. |
 |
| Top |
| TissGeneClin for HPCAL4 |
| TissGeneDrug for HPCAL4 |
| Drug information targeting TissGene (DrugBank Version 5.0.6, 2017-04-01) |
| DrugBank ID | Drug name | Drug activity | Drug type | Drug status |
| Top |
| TissGeneDisease for HPCAL4 |
| Disease information associated with TissGene (DisGeNet, 2016-06-01) |
| Disease ID | Disease name | # pubmeds | Source |
| umls:C0040336 | Tobacco Use Disorder | 1 | GAD |
|
Copyright 2016-Present - The University of Texas Health Science Center at Houston (UTHealth) Web File Viewing | How to Report, Fraud, Waste and Abuse | State of Texas | Statewide Search | Texas Homeland Security | Site Policies |