 |
| |
| |
| |
| |
| |
| |
|

| TissGeneSummary for STYXL1 |
 Gene summary Gene summary |
| Basic gene information | Gene symbol | STYXL1 |
| Gene name | serine/threonine/tyrosine interacting-like 1 | |
| Synonyms | DUSP24|MK-STYX | |
| Cytomap | UCSC genome browser: 7q11.23 | |
| Type of gene | protein-coding | |
| RefGenes | NM_016086.2, | |
| Description | dual specificity phosphatase 24 (putative)dual specificity phosphatase inhibitor MK-STYXdual specificity protein phosphatase 24map kinase phosphatase-like protein MK-STYXserine/threonine/tyrosine-interacting-like protein 1 | |
| Modification date | 20141207 | |
| dbXrefs | HGNC : HGNC | |
| Ensembl : ENSG00000127952 | ||
| HPRD : 13256 | ||
| Vega : OTTHUMG00000130459 | ||
| Protein | UniProt: go to UniProt's Cross Reference DB Table | |
| Expression | CleanEX: HS_STYXL1 | |
| BioGPS: 51657 | ||
| Pathway | NCI Pathway Interaction Database: STYXL1 | |
| KEGG: STYXL1 | ||
| REACTOME: STYXL1 | ||
| Pathway Commons: STYXL1 | ||
| Context | iHOP: STYXL1 | |
| ligand binding site mutation search in PubMed: STYXL1 | ||
| UCL Cancer Institute: STYXL1 | ||
| Assigned class in TissGDB* | C | |
| Included tissue-specific gene expression resources | TiGER,GTEx | |
| Specific-tissues in normal samples (assigned by TissGDB using HPA, TiGER, and GTEx) | OvaryTestis | |
| Cancer types related to the specific-tissues in cancer samples (assigned by TissGDB using TCGA) | OVTGCT | |
| Reference showing the relevant tissue of STYXL1 | ||
| Description by TissGene annotations | TissgsLTS | |
| * Class A consists of genes with literature evidence and is part of the cTissGenes. Class B consists of only cTissGenes without additional evidence. The remaining genes belong to Class C. |
| Gene ontology having evidence of Inferred from Direct Assay (IDA) from Entrez |
| GO ID | GO term | PubMed ID |
| Top |
| TissGeneExp for STYXL1 |
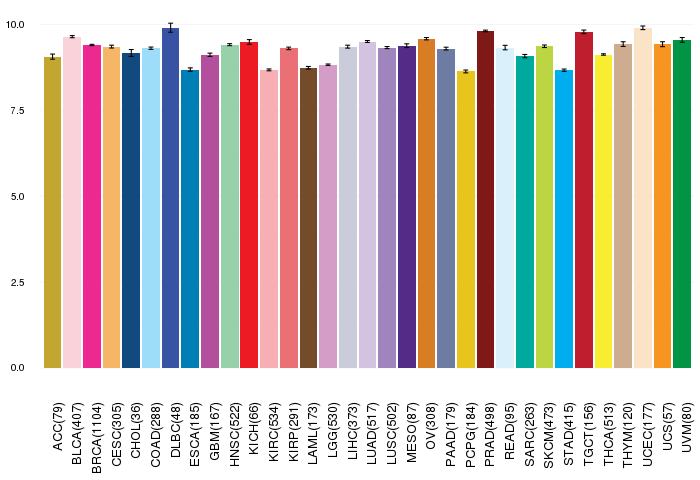
| Gene expressions across 28 cancer types (X-axis: cancer type and Y-axis: log2(norm_counts+1)) (TCGA IlluminaHiSeq_RNASeqV2, pan-cancer normalized log2(norm_counts+1) data, version 2016-08-16) |
 |
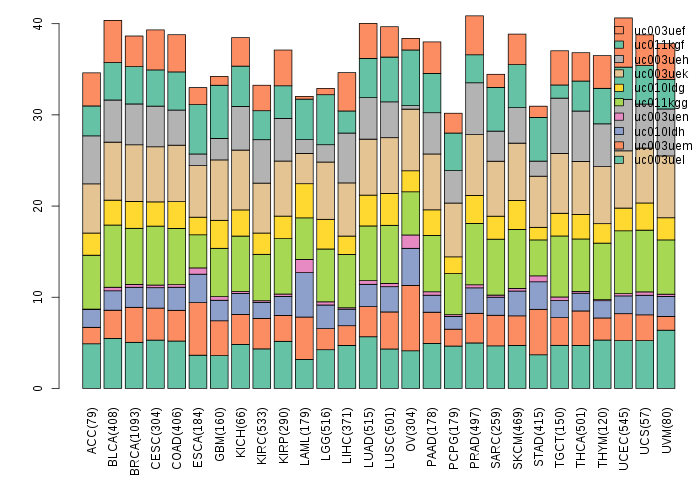
| Gene isoform expressions across 28 cancer types (X-axis: cancer type and Y-axis: log2(norm_counts+1)) (TCGA pan-cancer tcga_rsem_isoform_tpm, version 2016-09-01) |
 |
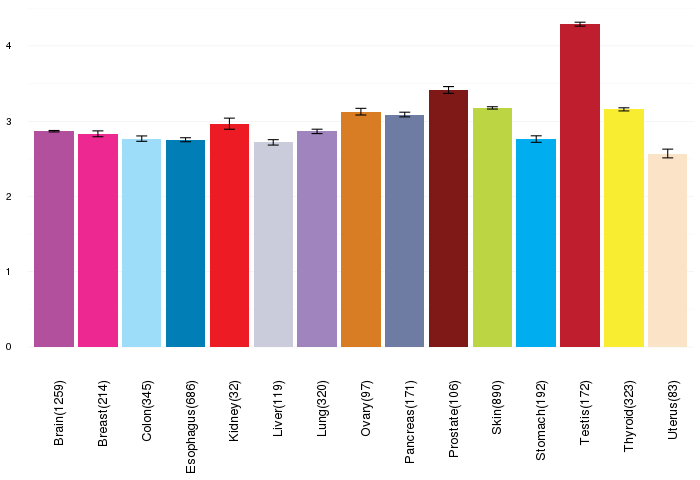
| Gene expressions across normal tissues of GTEx data (GTEx GTEx_Analysis_v6_RNA-seq_RNA-SeQCv1.1.8_gene_rpkm.gct) - Here, we shows the matched tissue types only among our 28 cancer types. |
 |
| Different expressions across 14 cancer types with more than 10 samples between matched tumors and normals (X-axis: cancer type and Y-axis: log2(norm_counts+1)) (TCGA IlluminaHiSeq_RNASeqV2, pan-cancer normalized log2(norm_counts+1) data, version 2016-08-16) |
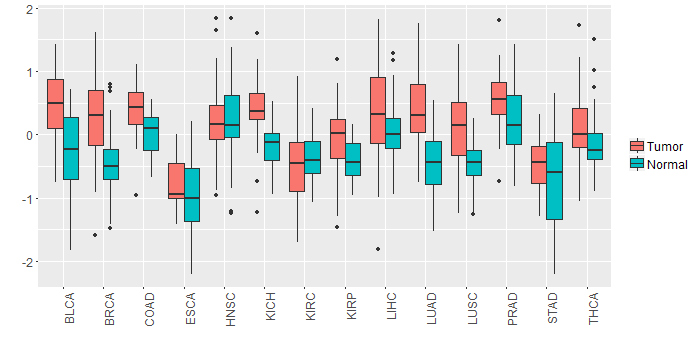 |
| - Significantly differentially expressed cancer types and information. (|Fold change|>1 and FDR<0.05) |
| Cancer type | Mean(exp) in tumor | Mean(exp) in matched normal | Log2FC | P-val. | FDR |
| Top |
| TissGene-miRNA for STYXL1 |
| Significantly anti-correlated miRNAs of TissGene across 28 cancer types (Gene-miRNA relations from TargetScanHuman Relsease 7.1, Conserved_Site_Context_Scores.txt.zip, 06.01.2016) (TCGA IlluminaHiSeq_miRNASeq, log2(RPM+1) data, version 2016-11-21) (TCGA IlluminaHiSeq_RNASeqV2, log2(normalized_count+1) data, version 2016-08-16) (Spearman’s Rank Correlation (p-value<0.05 and coefficient<-0.25)) |
| Cancer type | miRNA id | miRNA accession | P-val. | Coeff. | # samples |
| Top |
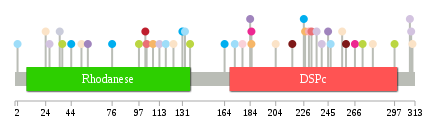
| TissGeneMut for STYXL1 |
| TissGeneSNV for STYXL1 |
| nsSNV counts per each loci. Different colors of circles represent different cancer types. Circle size denotes number of samples. (TCGA somatic mutation (SNPs and small INDELs) data, version 2016-04-25) * Click on the image to enlarge it in a new window. |
 |
 |
| Somatic nucleotide variants of TissGene across 28 cancer types (X-axis: cancer type and Y-axis: % of mutated samples) The numbers in parentheses are numbers of samples with mutation (nsSNVs). (TCGA somatic mutation (SNPs and small INDELs) data, version 2016-04-25) |
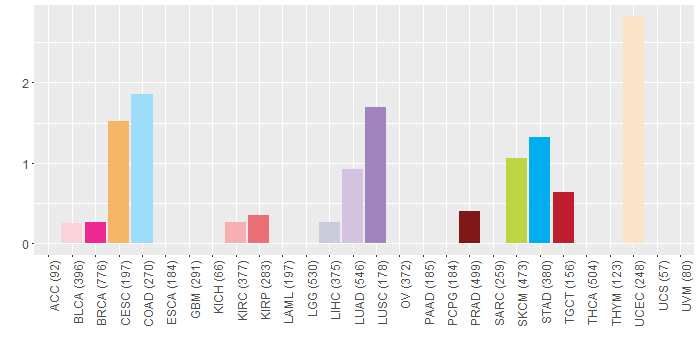 |
| - nsSNVs sorted by frequency. |
| AAchange | Cancer type | # samples |
| p.D35N | LIHC | 1 |
| p.A259S | PRAD | 1 |
| p.R118H | COAD | 1 |
| p.M309I | LUAD | 1 |
| p.T247A | COAD | 1 |
| p.Q107* | HNSC | 1 |
| p.A256T | UCEC | 1 |
| p.Y131C | STAD | 1 |
| p.S97F | SKCM | 1 |
| p.L185F | BRCA | 1 |
| p.D184N | LUSC | 1 |
| p.P311L | UCEC | 1 |
| p.P217L | PRAD | 1 |
| p.E280K | UCEC | 1 |
| p.V76L | STAD | 1 |
| p.F245Y | LUSC | 1 |
| p.D310Y | LUAD | 1 |
| p.S246Y | HNSC | 1 |
| p.D103G | KIRP | 1 |
| p.S240C | LUAD | 1 |
| p.E44K | STAD | 1 |
| p.L185F | CESC | 1 |
| p.R226C | STAD | 1 |
| p.R24G | UCEC | 1 |
| p.D27N | LUAD | 1 |
| p.T137A | SKCM | 1 |
| p.K102I | TGCT | 1 |
| p.V164M | STAD | 1 |
| p.P2T | COAD | 1 |
| p.V124I | UCEC | 1 |
| p.R52Q | UCEC | 1 |
| p.I232V | KIRP | 1 |
| p.R133C | COAD | 1 |
| p.G113D | LUAD | 1 |
| p.S272A | SKCM | 1 |
| p.E8X | READ | 1 |
| p.S108* | CESC | 1 |
| p.R226C | HNSC | 1 |
| p.E297K | SKCM | 1 |
| p.R37C | SKCM | 1 |
| p.D178H | BLCA | 1 |
| p.H227N | CESC | 1 |
| p.N57D | LUSC | 1 |
| p.H236R | LUAD | 1 |
| p.V164M | HNSC | 1 |
| p.H230Q | KIRC | 1 |
| p.E266K | BRCA | 1 |
| p.N172D | COAD | 1 |
| p.D204N | UCEC | 1 |
| Top |
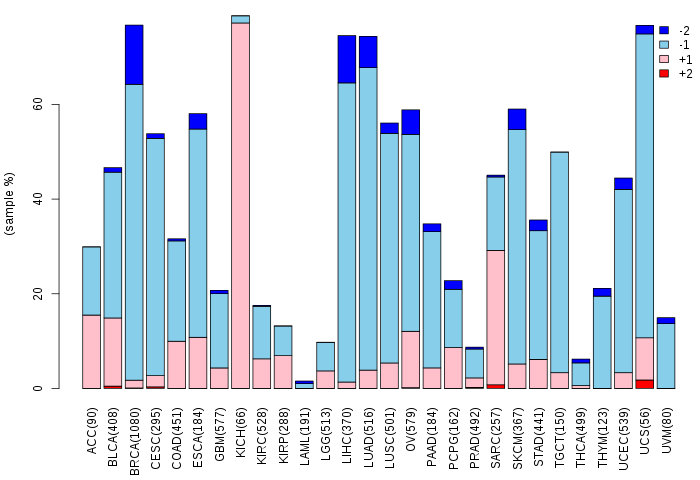
| TissGeneCNV for STYXL1 |
| Copy number variations of TissGene across 28 cancer types (X-axis: cancer type and Y-axis: % of CNV samples) (TCGA Gistic2_CopyNumber_Gistic2_all_data_by_genes, Gistic2 copy number data, version 2016-08-16) |
 |
| Top |
| TissGeneFusions for STYXL1 |
| Fusion genes including TissGene (ChimerDB 3.0, 2016-12-01 and TCGA fusion Portal 2015-12-01) |
| Database | Src | Cancer type | Sample | Fusion gene | ORF | 5'-gene BP | 3'-gene BP |
| Chimerdb3.0 | ChiTaRs | NA | BE717592 | STYXL1-PPIL2 | chr7:75634641 | chr22:22036785 | |
| Chimerdb3.0 | ChiTaRs | NA | BF902200 | CKAP4-STYXL1 | chr12:106633861 | chr7:75662465 | |
| TCGAfusionPortal | PRADA | GBM | TCGA-06-0130-01A | PION-STYXL1 | In-frame | Chr7:77006165 | Chr7:75634722 |
| Top |
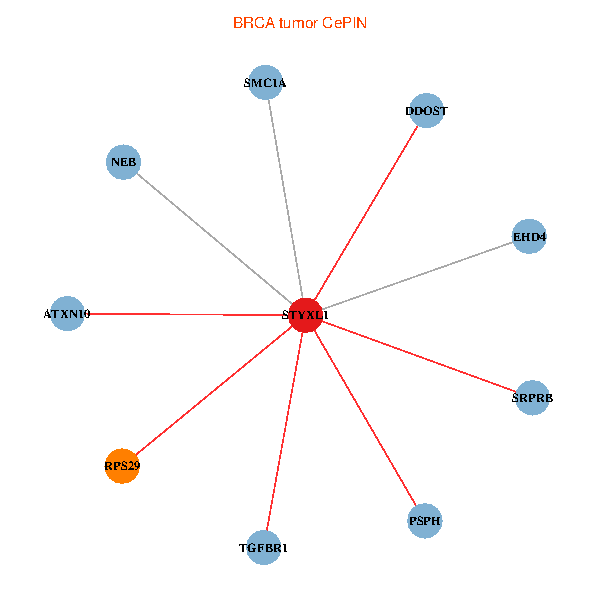
| TissGeneNet for STYXL1 |
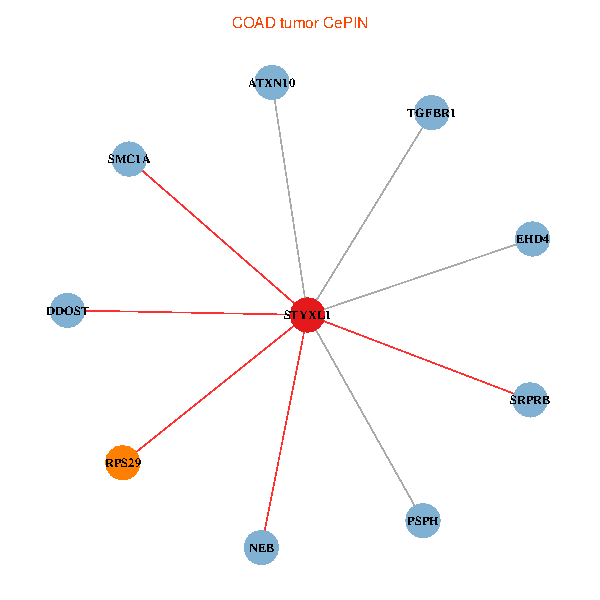
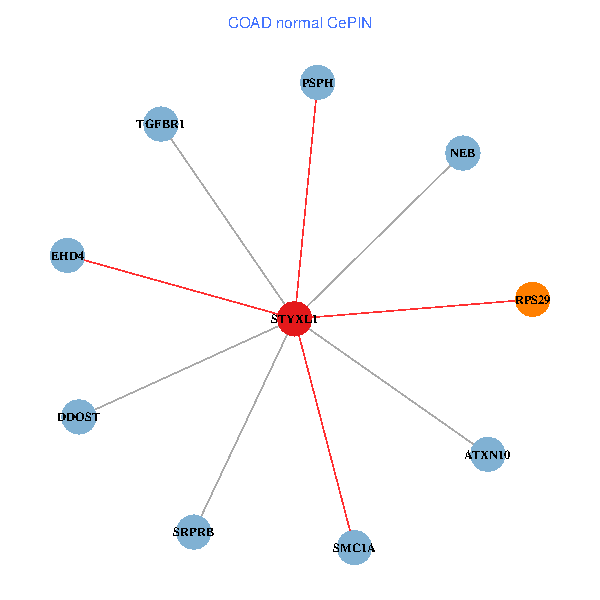
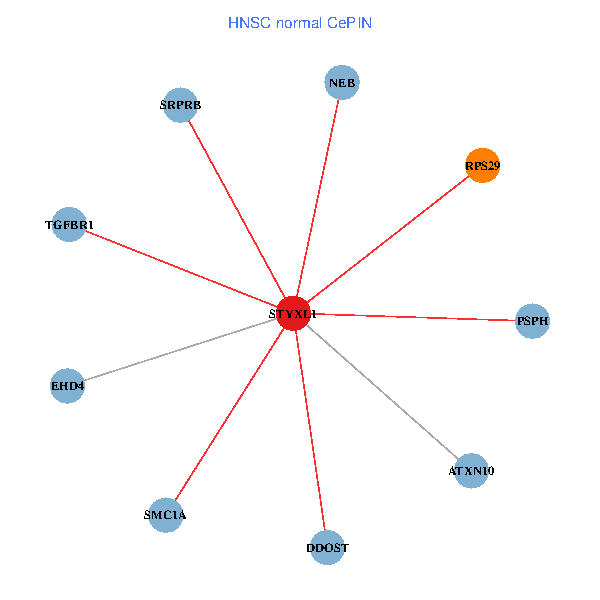
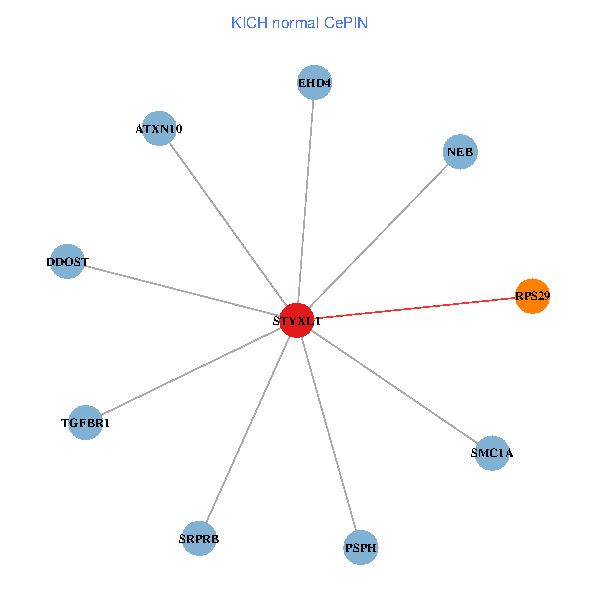
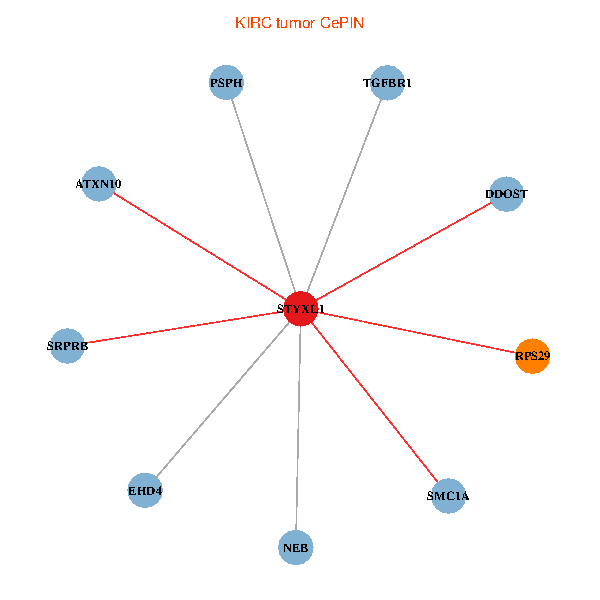
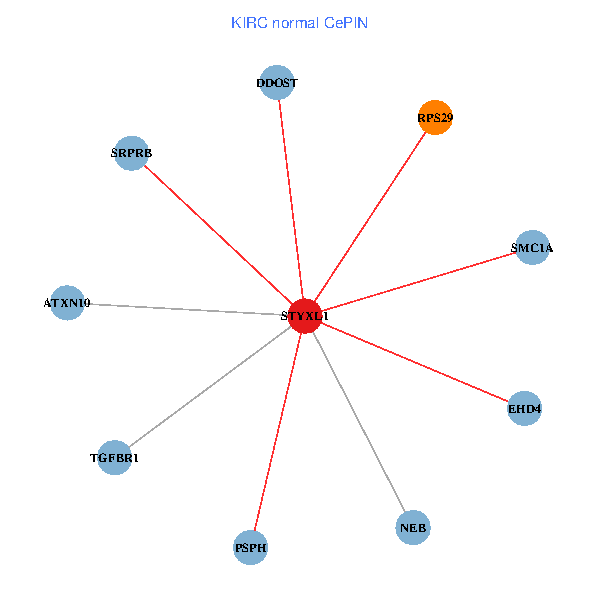
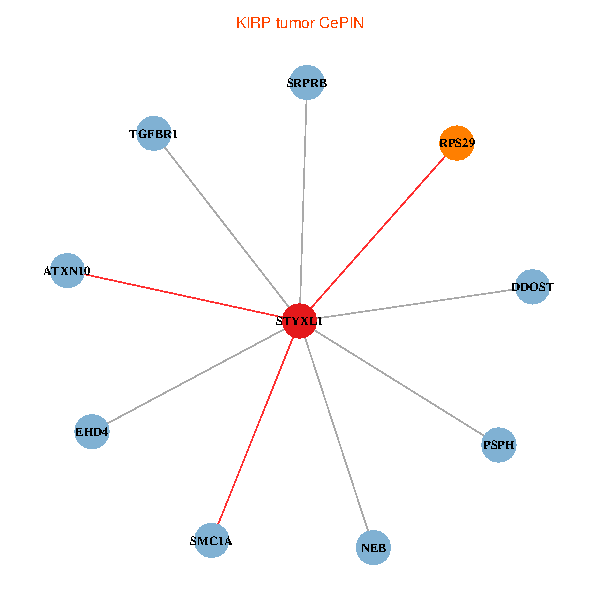
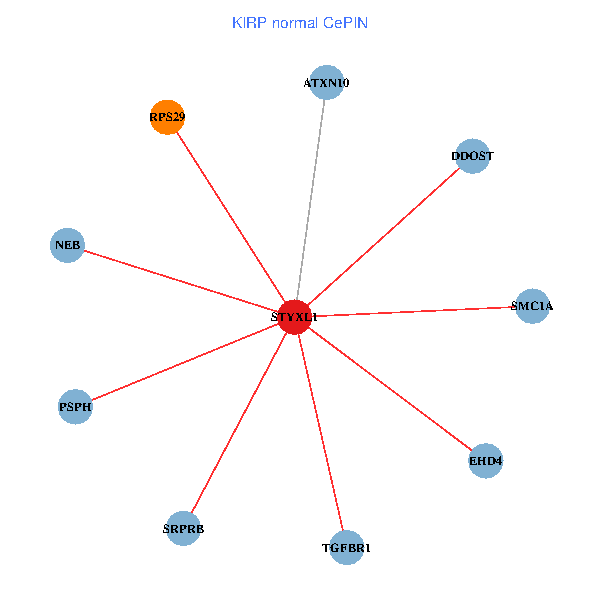
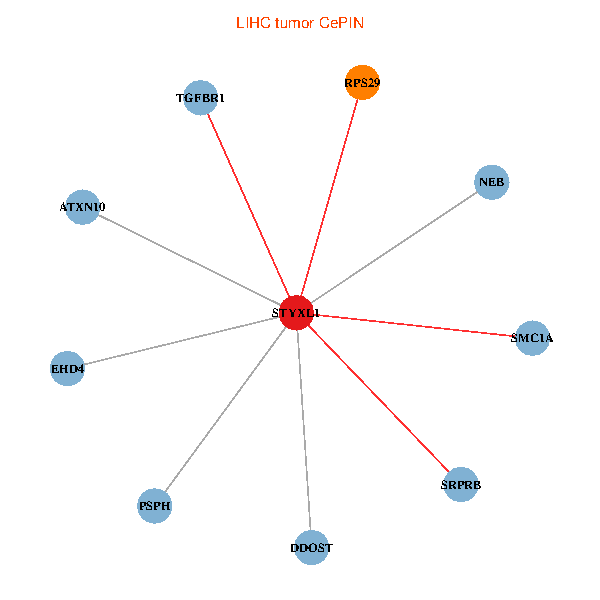
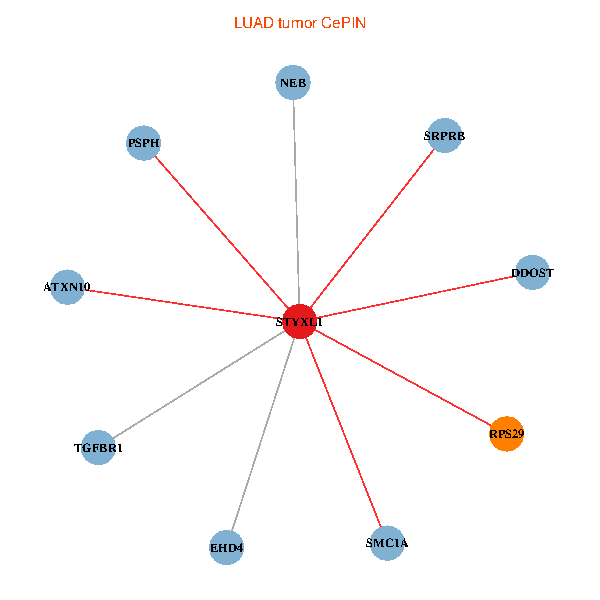
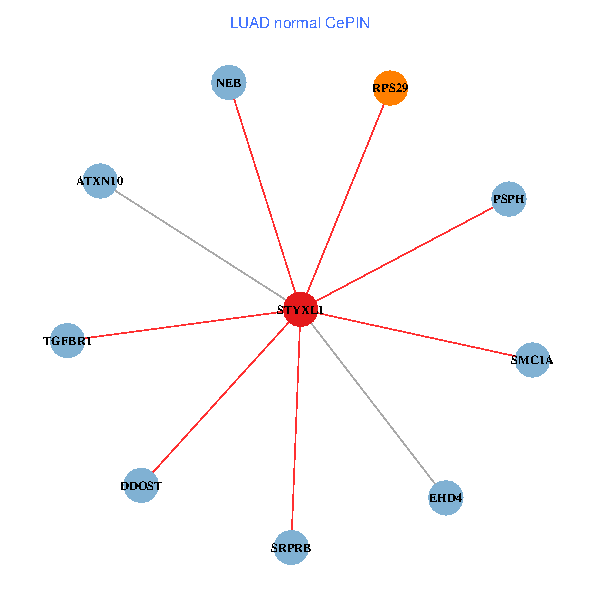
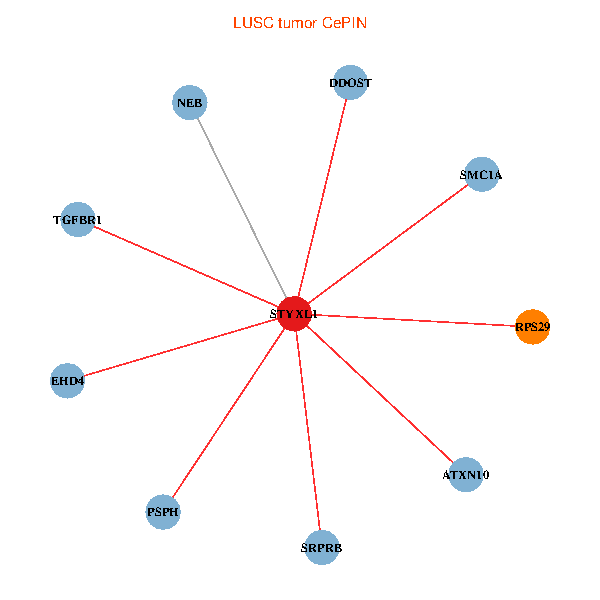
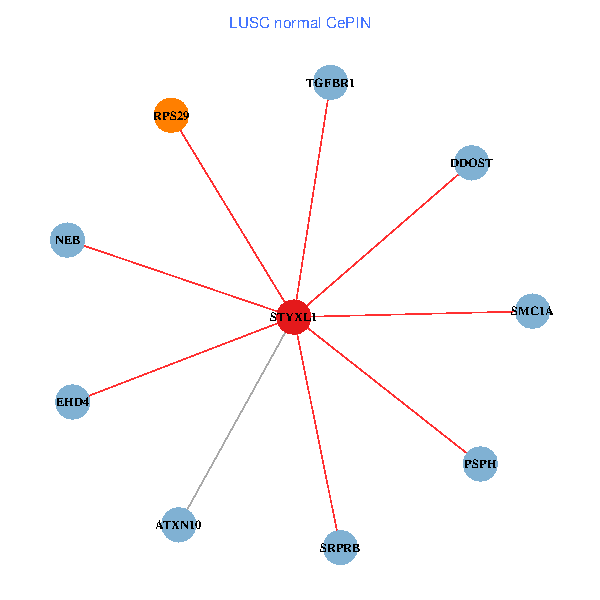
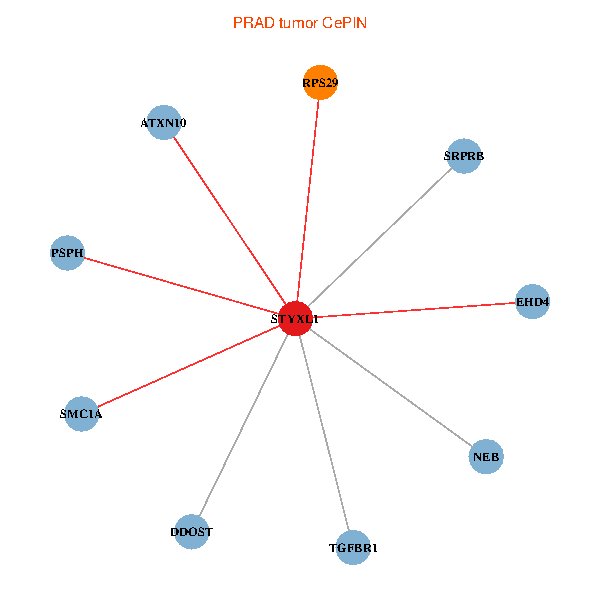
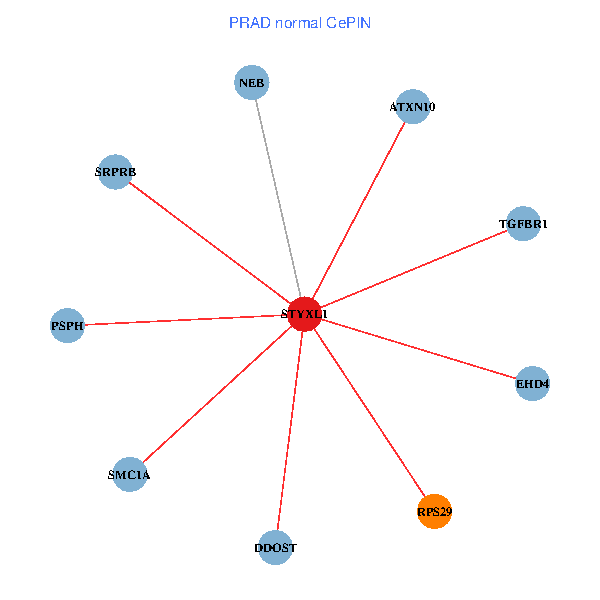
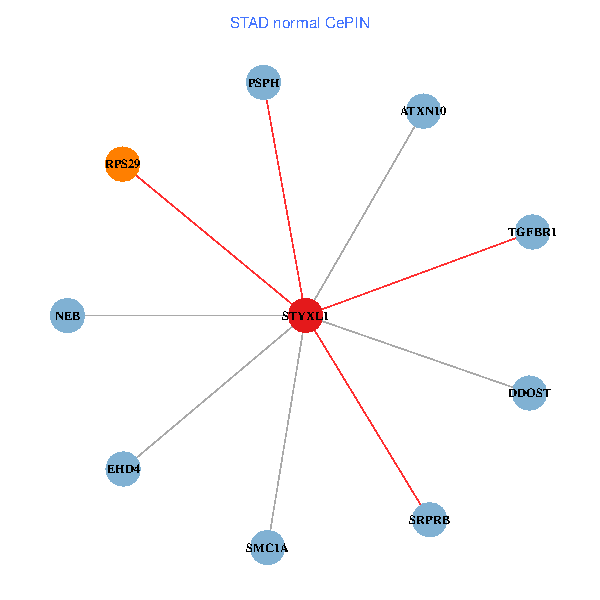
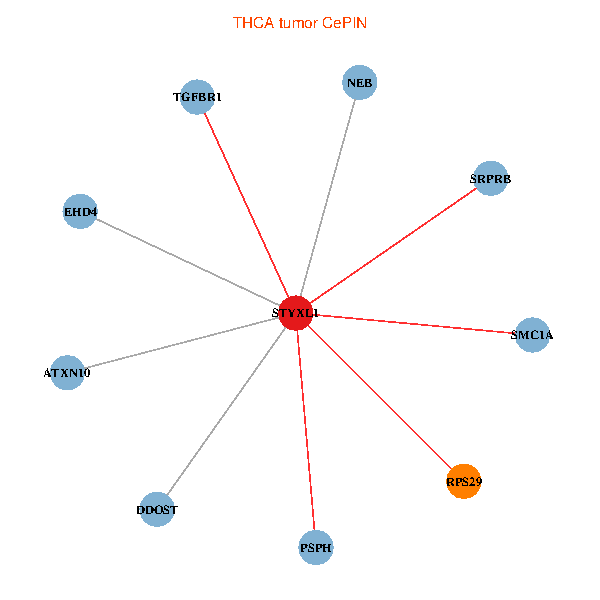
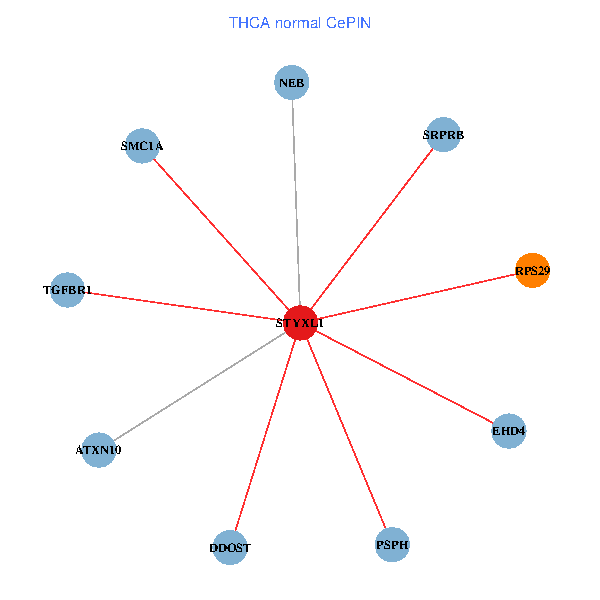
| Co-expressed gene networks based on protein-protein interaction data (CePIN) (TCGA IlluminaHiSeq_RNASeqV2, pan-cancer normalized log2(norm_counts+1) data, version 2016-08-16) (PINA2 ppi data) |
| BRCA (tumor) | BRCA (normal) |
| STYXL1, TGFBR1, RPS29, SMC1A, SRPRB, ATXN10, NEB, PSPH, DDOST, EHD4 (tumor) | STYXL1, TGFBR1, RPS29, SMC1A, SRPRB, ATXN10, NEB, PSPH, DDOST, EHD4 (normal) |
 |  |
| COAD (tumor) | COAD (normal) |
| STYXL1, TGFBR1, RPS29, SMC1A, SRPRB, ATXN10, NEB, PSPH, DDOST, EHD4 (tumor) | STYXL1, TGFBR1, RPS29, SMC1A, SRPRB, ATXN10, NEB, PSPH, DDOST, EHD4 (normal) |
 |  |
| HNSC (tumor) | HNSC (normal) |
| STYXL1, TGFBR1, RPS29, SMC1A, SRPRB, ATXN10, NEB, PSPH, DDOST, EHD4 (tumor) | STYXL1, TGFBR1, RPS29, SMC1A, SRPRB, ATXN10, NEB, PSPH, DDOST, EHD4 (normal) |
 |  |
| KICH (tumor) | KICH (normal) |
| STYXL1, TGFBR1, RPS29, SMC1A, SRPRB, ATXN10, NEB, PSPH, DDOST, EHD4 (tumor) | STYXL1, TGFBR1, RPS29, SMC1A, SRPRB, ATXN10, NEB, PSPH, DDOST, EHD4 (normal) |
 |  |
| KIRC (tumor) | KIRC (normal) |
| STYXL1, TGFBR1, RPS29, SMC1A, SRPRB, ATXN10, NEB, PSPH, DDOST, EHD4 (tumor) | STYXL1, TGFBR1, RPS29, SMC1A, SRPRB, ATXN10, NEB, PSPH, DDOST, EHD4 (normal) |
 |  |
| KIRP (tumor) | KIRP (normal) |
| STYXL1, TGFBR1, RPS29, SMC1A, SRPRB, ATXN10, NEB, PSPH, DDOST, EHD4 (tumor) | STYXL1, TGFBR1, RPS29, SMC1A, SRPRB, ATXN10, NEB, PSPH, DDOST, EHD4 (normal) |
 |  |
| LIHC (tumor) | LIHC (normal) |
| STYXL1, TGFBR1, RPS29, SMC1A, SRPRB, ATXN10, NEB, PSPH, DDOST, EHD4 (tumor) | STYXL1, TGFBR1, RPS29, SMC1A, SRPRB, ATXN10, NEB, PSPH, DDOST, EHD4 (normal) |
 |  |
| LUAD (tumor) | LUAD (normal) |
| STYXL1, TGFBR1, RPS29, SMC1A, SRPRB, ATXN10, NEB, PSPH, DDOST, EHD4 (tumor) | STYXL1, TGFBR1, RPS29, SMC1A, SRPRB, ATXN10, NEB, PSPH, DDOST, EHD4 (normal) |
 |  |
| LUSC (tumor) | LUSC (normal) |
| STYXL1, TGFBR1, RPS29, SMC1A, SRPRB, ATXN10, NEB, PSPH, DDOST, EHD4 (tumor) | STYXL1, TGFBR1, RPS29, SMC1A, SRPRB, ATXN10, NEB, PSPH, DDOST, EHD4 (normal) |
 |  |
| PRAD (tumor) | PRAD (normal) |
| STYXL1, TGFBR1, RPS29, SMC1A, SRPRB, ATXN10, NEB, PSPH, DDOST, EHD4 (tumor) | STYXL1, TGFBR1, RPS29, SMC1A, SRPRB, ATXN10, NEB, PSPH, DDOST, EHD4 (normal) |
 |  |
| STAD (tumor) | STAD (normal) |
| STYXL1, TGFBR1, RPS29, SMC1A, SRPRB, ATXN10, NEB, PSPH, DDOST, EHD4 (tumor) | STYXL1, TGFBR1, RPS29, SMC1A, SRPRB, ATXN10, NEB, PSPH, DDOST, EHD4 (normal) |
 |  |
| THCA (tumor) | THCA (normal) |
| STYXL1, TGFBR1, RPS29, SMC1A, SRPRB, ATXN10, NEB, PSPH, DDOST, EHD4 (tumor) | STYXL1, TGFBR1, RPS29, SMC1A, SRPRB, ATXN10, NEB, PSPH, DDOST, EHD4 (normal) |
 |  |
| Top |
| TissGeneProg for STYXL1 |
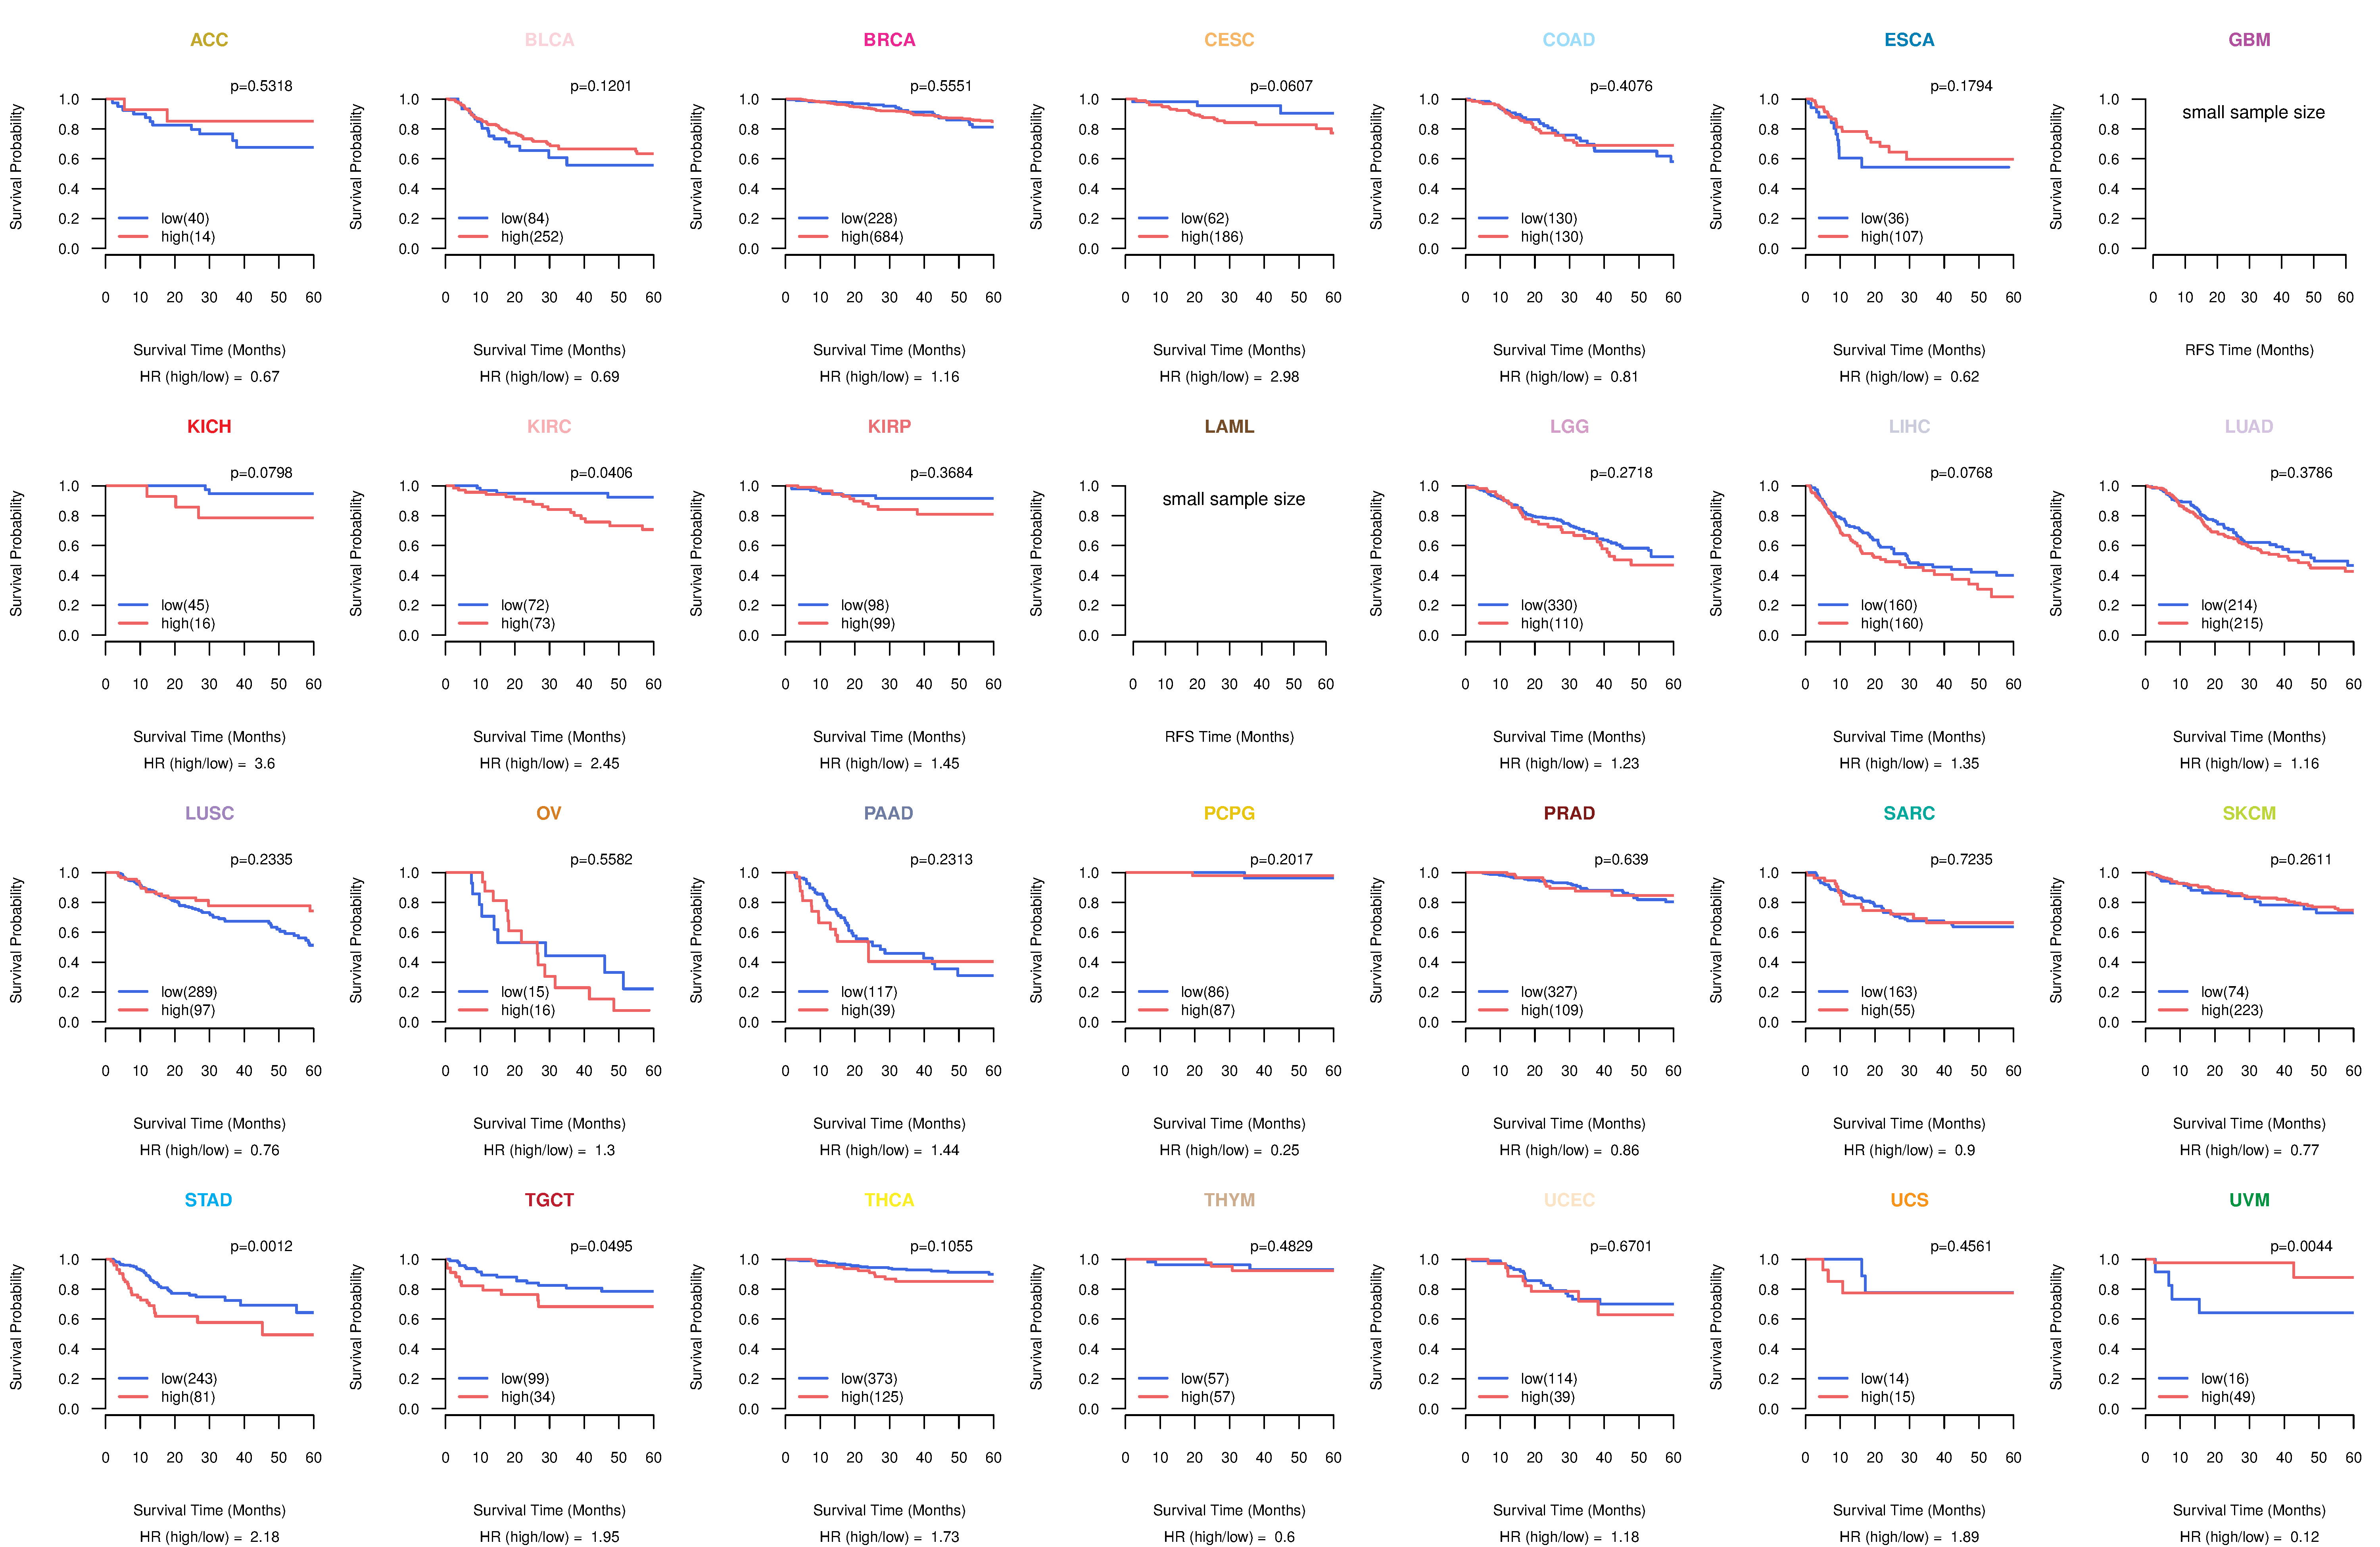
| Kaplan-Meier plots with logrank tests of overall survival (OS) using 28 cancer types (TCGA IlluminaHiSeq_RNASeqV2, pan-cancer normalized log2(norm_counts+1) data, version 2016-08-16) (TCGA clinicalMatrix, phenotype data, version 2016-04-27) * Click on the image to enlarge it in a new window. |
 |
| Kaplan-Meier plots with logrank test of relapse free survival (RFS) using 28 cancer types (TCGA IlluminaHiSeq_RNASeqV2, pan-cancer normalized log2(norm_counts+1) data, version 2016-08-16) (TCGA clinicalMatrix, phenotype data, version 2016-04-27) * Click on the image enlarge it in a new window. |
 |
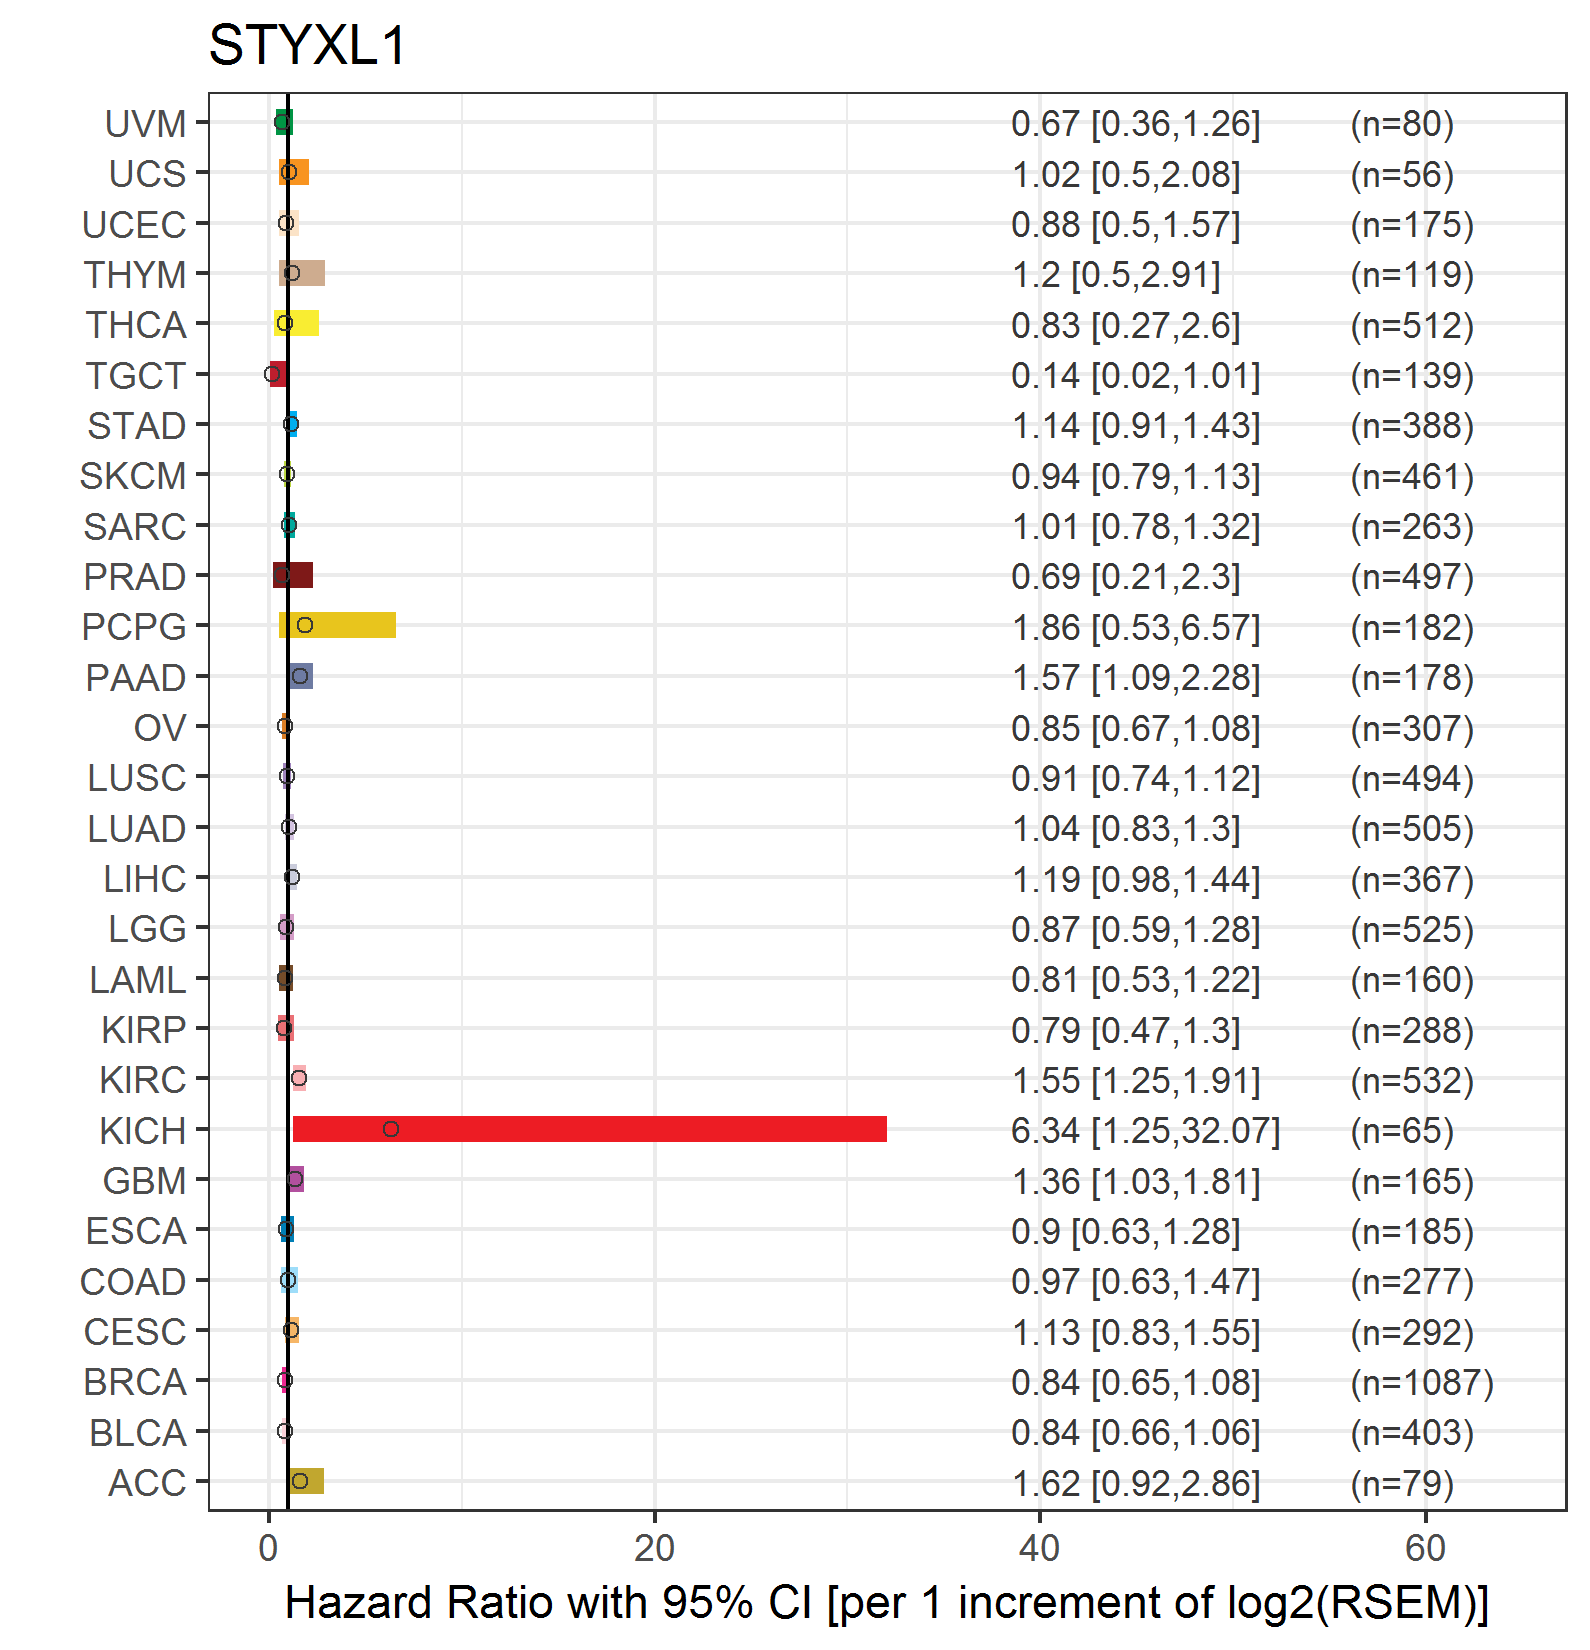
| Forest plot of Cox proportional hazard ratio (HR) and 95% CI of overall survival (OS) using 28 cancer types (TCGA IlluminaHiSeq_RNASeqV2, pan-cancer normalized log2(norm_counts+1) data, version 2016-08-16) (TCGA clinicalMatrix, phenotype data, version 2016-04-27) * Click on the image enlarge it in a new window. |
 |
| Forest plot of Cox proportional hazard ratio (HR) and 95% CI of relapse free survival (RFS) using 28 cancer types (TCGA IlluminaHiSeq_RNASeqV2, pan-cancer normalized log2(norm_counts+1) data, version 2016-08-16) (TCGA clinicalMatrix, phenotype data, version 2016-04-27) * Click on the image enlarge it in a new window. |
 |
| Top |
| TissGeneClin for STYXL1 |
| TissGeneDrug for STYXL1 |
| Drug information targeting TissGene (DrugBank Version 5.0.6, 2017-04-01) |
| DrugBank ID | Drug name | Drug activity | Drug type | Drug status |
| Top |
| TissGeneDisease for STYXL1 |
| Disease information associated with TissGene (DisGeNet, 2016-06-01) |
| Disease ID | Disease name | # pubmeds | Source |
| umls:C0026351 | Moderate mental retardation (I.Q. 35-49) | 1 | BeFree |
| umls:C1292769 | Precursor B-cell lymphoblastic leukemia | 1 | BeFree |
|
Copyright 2016-Present - The University of Texas Health Science Center at Houston (UTHealth) Web File Viewing | How to Report, Fraud, Waste and Abuse | State of Texas | Statewide Search | Texas Homeland Security | Site Policies |