 |
| |
| |
| |
| |
| |
| |
|

| TissGeneSummary for PANK1 |
 Gene summary Gene summary |
| Basic gene information | Gene symbol | PANK1 |
| Gene name | pantothenate kinase 1 | |
| Synonyms | PANK | |
| Cytomap | UCSC genome browser: 10q23.31 | |
| Type of gene | protein-coding | |
| RefGenes | NM_138316.3, NM_148977.2,NM_148978.2, | |
| Description | pantothenic acid kinase 1 | |
| Modification date | 20141207 | |
| dbXrefs | MIM : 606160 | |
| HGNC : HGNC | ||
| Ensembl : ENSG00000152782 | ||
| HPRD : 07549 | ||
| Protein | UniProt: go to UniProt's Cross Reference DB Table | |
| Expression | CleanEX: HS_PANK1 | |
| BioGPS: 53354 | ||
| Pathway | NCI Pathway Interaction Database: PANK1 | |
| KEGG: PANK1 | ||
| REACTOME: PANK1 | ||
| Pathway Commons: PANK1 | ||
| Context | iHOP: PANK1 | |
| ligand binding site mutation search in PubMed: PANK1 | ||
| UCL Cancer Institute: PANK1 | ||
| Assigned class in TissGDB* | C | |
| Included tissue-specific gene expression resources | TiGER,GTEx | |
| Specific-tissues in normal samples (assigned by TissGDB using HPA, TiGER, and GTEx) | KidneyLiver | |
| Cancer types related to the specific-tissues in cancer samples (assigned by TissGDB using TCGA) | KIRC,KIRP,KICHLIHC | |
| Reference showing the relevant tissue of PANK1 | ||
| Description by TissGene annotations | ||
| * Class A consists of genes with literature evidence and is part of the cTissGenes. Class B consists of only cTissGenes without additional evidence. The remaining genes belong to Class C. |
| Gene ontology having evidence of Inferred from Direct Assay (IDA) from Entrez |
| GO ID | GO term | PubMed ID |
| Top |
| TissGeneExp for PANK1 |
| Gene expressions across 28 cancer types (X-axis: cancer type and Y-axis: log2(norm_counts+1)) (TCGA IlluminaHiSeq_RNASeqV2, pan-cancer normalized log2(norm_counts+1) data, version 2016-08-16) |
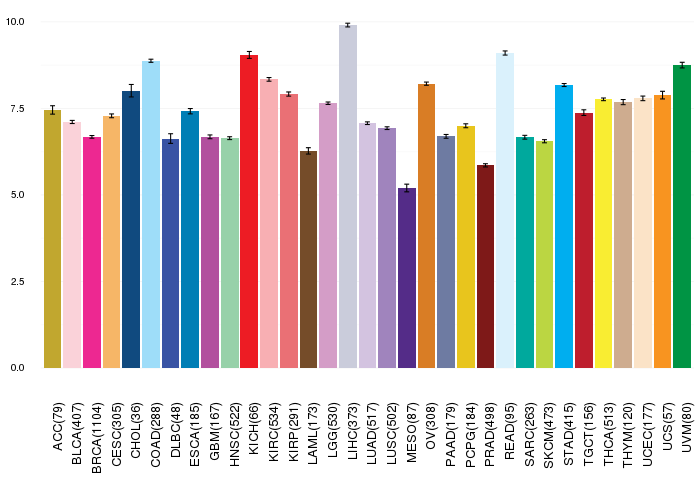 |
| Gene isoform expressions across 28 cancer types (X-axis: cancer type and Y-axis: log2(norm_counts+1)) (TCGA pan-cancer tcga_rsem_isoform_tpm, version 2016-09-01) |
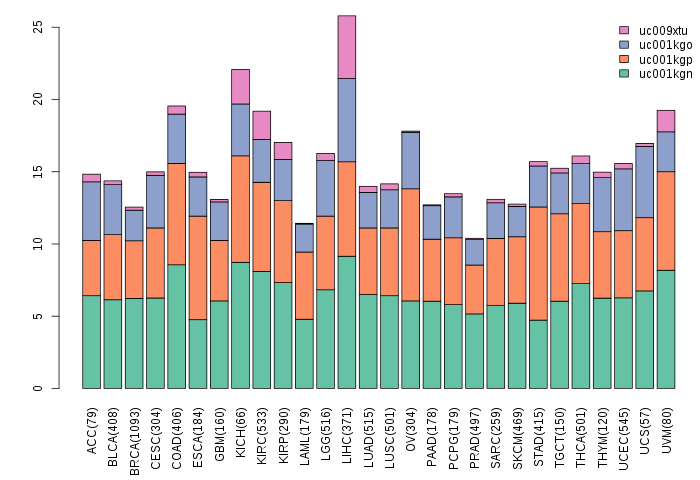 |
| Gene expressions across normal tissues of GTEx data (GTEx GTEx_Analysis_v6_RNA-seq_RNA-SeQCv1.1.8_gene_rpkm.gct) - Here, we shows the matched tissue types only among our 28 cancer types. |
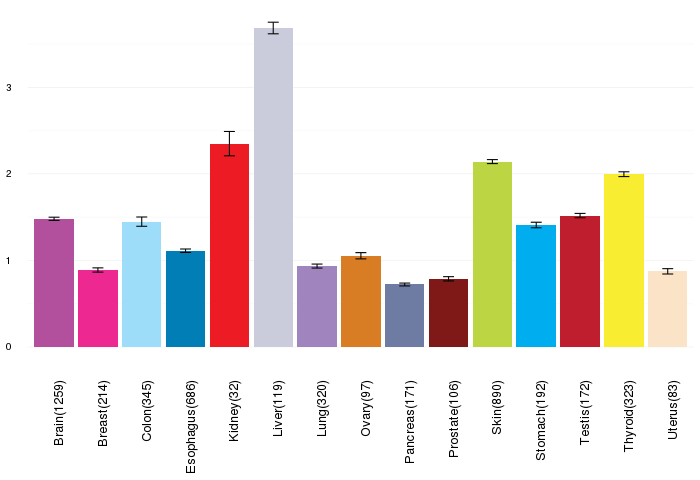 |
| Different expressions across 14 cancer types with more than 10 samples between matched tumors and normals (X-axis: cancer type and Y-axis: log2(norm_counts+1)) (TCGA IlluminaHiSeq_RNASeqV2, pan-cancer normalized log2(norm_counts+1) data, version 2016-08-16) |
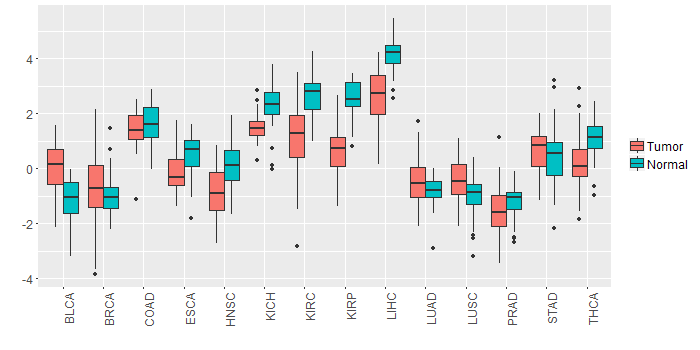 |
| - Significantly differentially expressed cancer types and information. (|Fold change|>1 and FDR<0.05) |
| Cancer type | Mean(exp) in tumor | Mean(exp) in matched normal | Log2FC | P-val. | FDR |
| KIRP | 0.647908818 | 2.542124443 | -1.894215625 | 3.98E-12 | 5.83E-11 |
| HNSC | -0.934710513 | 0.099024371 | -1.033734884 | 5.65E-07 | 4.57E-06 |
| KIRC | 1.104813679 | 2.631927568 | -1.527113889 | 5.49E-16 | 2.96E-15 |
| LIHC | 2.573187068 | 4.169237068 | -1.59605 | 1.04E-14 | 2.96E-13 |
| BLCA | 0.030257174 | -1.082942826 | 1.1132 | 0.000599 | 0.00467351 |
| Top |
| TissGene-miRNA for PANK1 |
| Significantly anti-correlated miRNAs of TissGene across 28 cancer types (Gene-miRNA relations from TargetScanHuman Relsease 7.1, Conserved_Site_Context_Scores.txt.zip, 06.01.2016) (TCGA IlluminaHiSeq_miRNASeq, log2(RPM+1) data, version 2016-11-21) (TCGA IlluminaHiSeq_RNASeqV2, log2(normalized_count+1) data, version 2016-08-16) (Spearman’s Rank Correlation (p-value<0.05 and coefficient<-0.25)) |
| Cancer type | miRNA id | miRNA accession | P-val. | Coeff. | # samples |
| LUAD | hsa-miR-653-5p | MIMAT0003328 | 0.025 | -0.29 | 60 |
| Top |
| TissGeneMut for PANK1 |
| TissGeneSNV for PANK1 |
| nsSNV counts per each loci. Different colors of circles represent different cancer types. Circle size denotes number of samples. (TCGA somatic mutation (SNPs and small INDELs) data, version 2016-04-25) * Click on the image to enlarge it in a new window. |
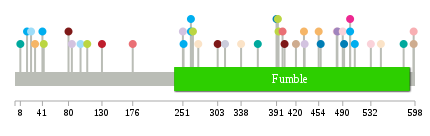 |
 |
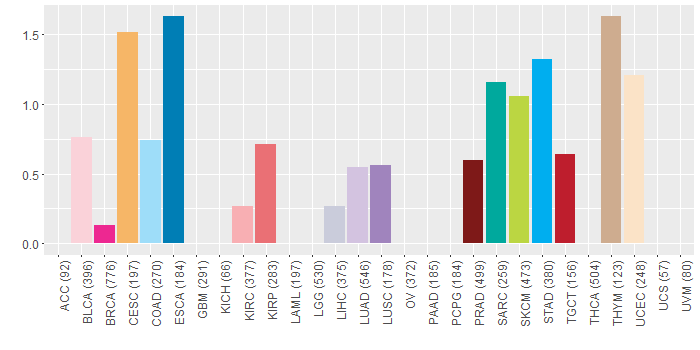
| Somatic nucleotide variants of TissGene across 28 cancer types (X-axis: cancer type and Y-axis: % of mutated samples) The numbers in parentheses are numbers of samples with mutation (nsSNVs). (TCGA somatic mutation (SNPs and small INDELs) data, version 2016-04-25) |
 |
| - nsSNVs sorted by frequency. |
| AAchange | Cancer type | # samples |
| p.E30Q | CESC | 1 |
| p.C403S | PRAD | 1 |
| p.D596Y | KIRC | 1 |
| p.A98V | COAD | 1 |
| p.V251L | LUAD | 1 |
| p.G342R | HNSC | 1 |
| p.E454Q | CESC | 1 |
| p.P391H | ESCA | 1 |
| p.K24E | COAD | 1 |
| p.N547H | UCEC | 1 |
| p.Y252C | STAD | 1 |
| p.E263* | STAD | 1 |
| p.A492V | ESCA | 1 |
| p.K400R | KIRP | 1 |
| p.S508C | STAD | 1 |
| p.N103D | HNSC | 1 |
| p.L8V | SARC | 1 |
| p.Y581C | SARC | 1 |
| p.S314I | LIHC | 1 |
| p.D596Y | THYM | 1 |
| p.M532I | BLCA | 1 |
| p.G41V | STAD | 1 |
| p.G80W | PRAD | 1 |
| p.R274Q | UCEC | 1 |
| p.S420I | THYM | 1 |
| p.R130C | TGCT | 1 |
| p.M501I | BRCA | 1 |
| p.P176L | KIRP | 1 |
| p.R432T | CESC | 1 |
| p.G481E | BLCA | 1 |
| p.V433L | LUAD | 1 |
| p.G108E | SKCM | 1 |
| p.A18V | STAD | 1 |
| p.G85E | LUAD | 1 |
| p.K431T | MESO | 1 |
| p.E263X | STAD | 1 |
| p.G490R | BLCA | 1 |
| p.E266K | SKCM | 1 |
| p.R303C | PRAD | 1 |
| p.M501T | STAD | 1 |
| p.N393S | SKCM | 1 |
| p.P394S | SKCM | 1 |
| p.G43R | SKCM | 1 |
| p.E363* | SARC | 1 |
| p.D482N | LUSC | 1 |
| p.A338V | UCEC | 1 |
| p.E457K | ESCA | 1 |
| Top |
| TissGeneCNV for PANK1 |
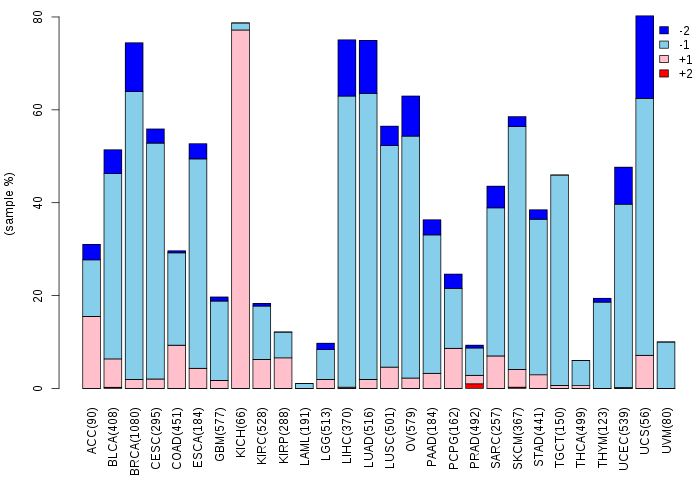
| Copy number variations of TissGene across 28 cancer types (X-axis: cancer type and Y-axis: % of CNV samples) (TCGA Gistic2_CopyNumber_Gistic2_all_data_by_genes, Gistic2 copy number data, version 2016-08-16) |
 |
| Top |
| TissGeneFusions for PANK1 |
| Fusion genes including TissGene (ChimerDB 3.0, 2016-12-01 and TCGA fusion Portal 2015-12-01) |
| Database | Src | Cancer type | Sample | Fusion gene | ORF | 5'-gene BP | 3'-gene BP |
| Chimerdb3.0 | ChiTaRs | NA | BF825680 | TRDMT1-PANK1 | chr10:17186032 | chr10:91344093 | |
| TCGAfusionPortal | PRADA | BRCA | TCGA-BH-A1FD-01A | PANK1-C8orf34 | Out-of-frame | Chr10:91404357 | Chr8:69621229 |
| TCGAfusionPortal | PRADA | PRAD | TCGA-EJ-7327-01A | PANK1-PDK3 | In-frame | Chr10:91404357 | ChrX:24523326 |
| Top |
| TissGeneNet for PANK1 |
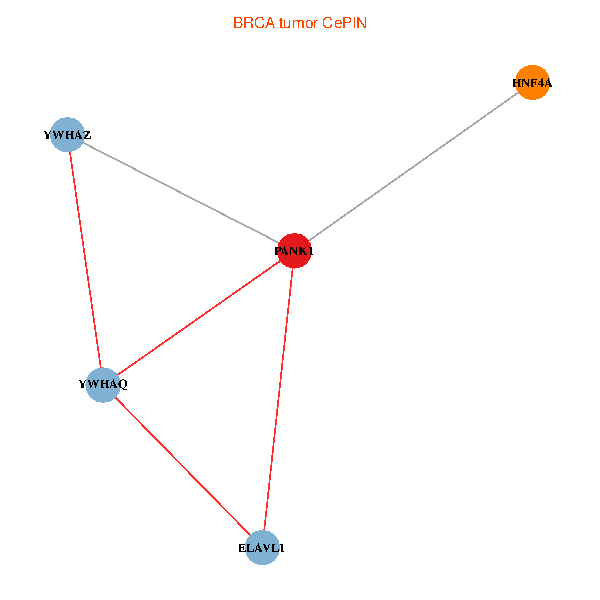
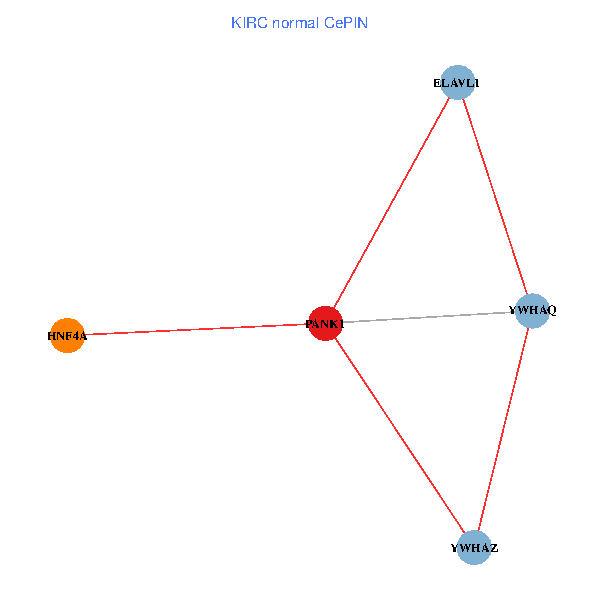
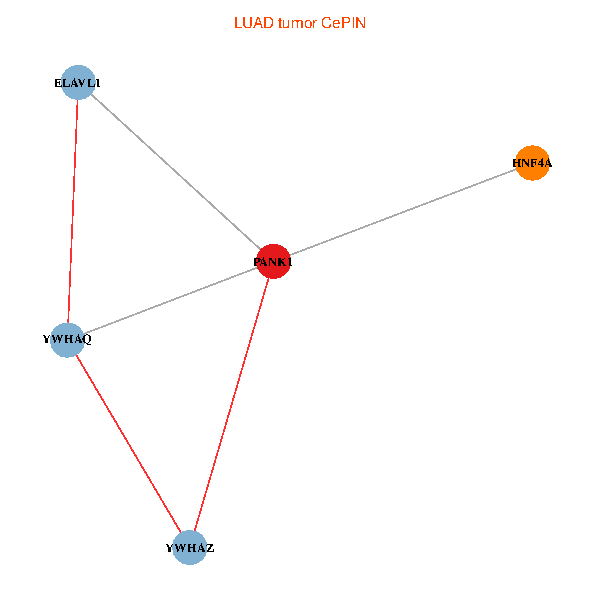
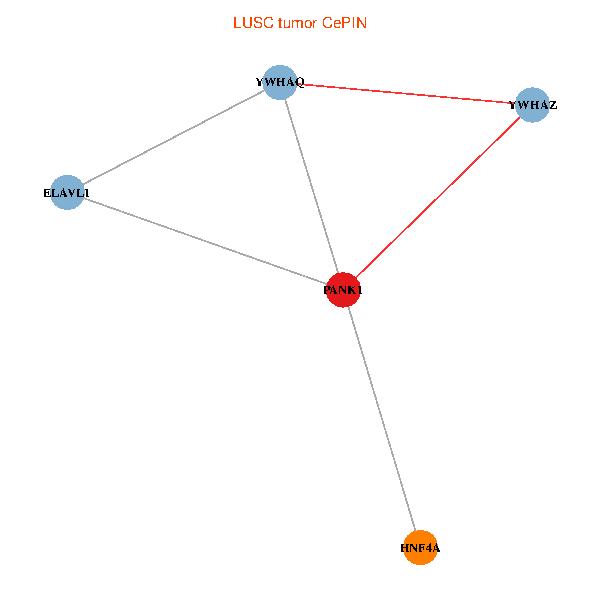
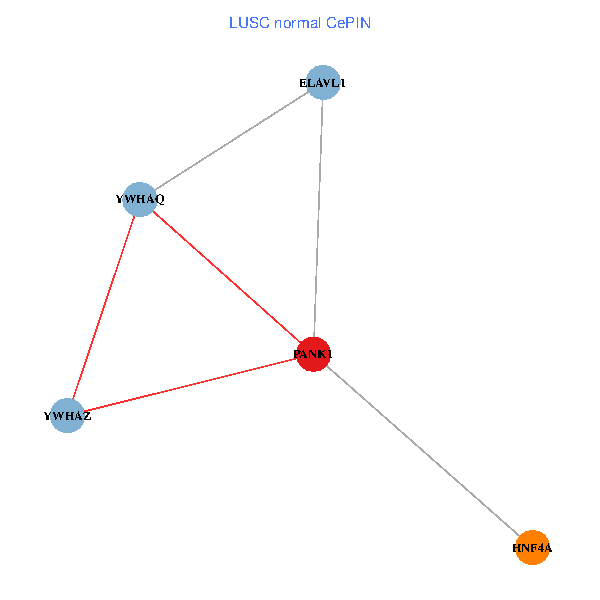
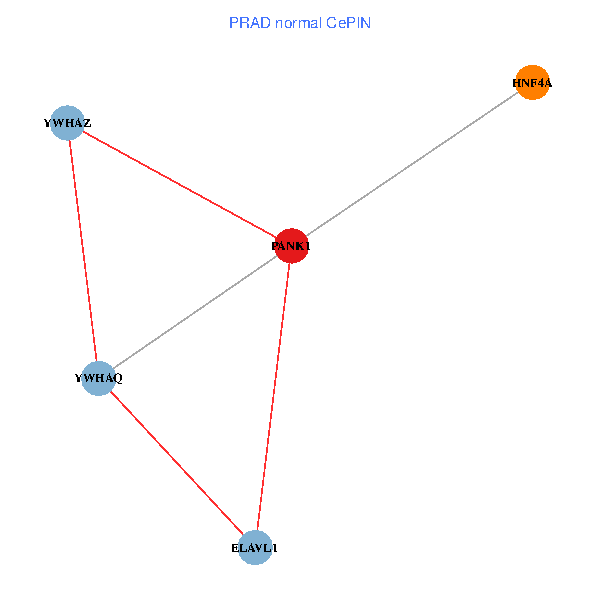
| Co-expressed gene networks based on protein-protein interaction data (CePIN) (TCGA IlluminaHiSeq_RNASeqV2, pan-cancer normalized log2(norm_counts+1) data, version 2016-08-16) (PINA2 ppi data) |
| BRCA (tumor) | BRCA (normal) |
| PANK1, HNF4A, ELAVL1, YWHAZ, YWHAQ (tumor) | PANK1, HNF4A, ELAVL1, YWHAZ, YWHAQ (normal) |
 | 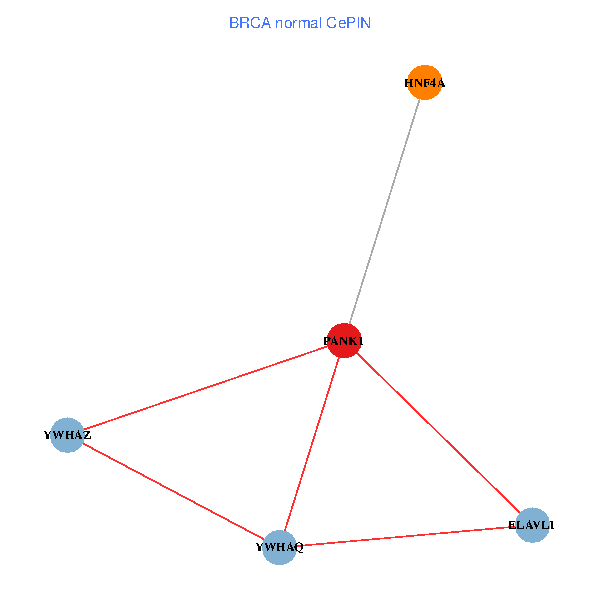 |
| COAD (tumor) | COAD (normal) |
| PANK1, HNF4A, ELAVL1, YWHAZ, YWHAQ (tumor) | PANK1, HNF4A, ELAVL1, YWHAZ, YWHAQ (normal) |
 | 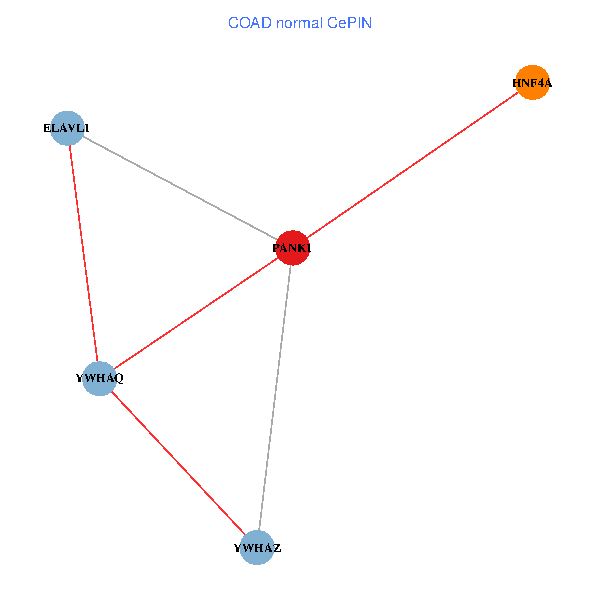 |
| HNSC (tumor) | HNSC (normal) |
| PANK1, HNF4A, ELAVL1, YWHAZ, YWHAQ (tumor) | PANK1, HNF4A, ELAVL1, YWHAZ, YWHAQ (normal) |
 | 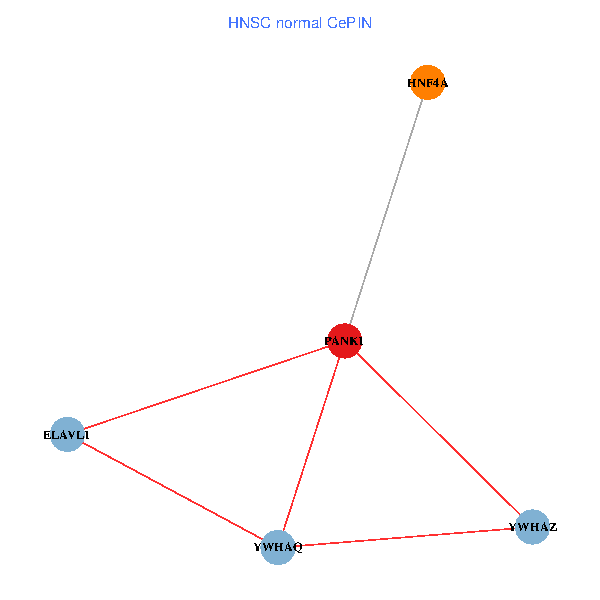 |
| KICH (tumor) | KICH (normal) |
| PANK1, HNF4A, ELAVL1, YWHAZ, YWHAQ (tumor) | PANK1, HNF4A, ELAVL1, YWHAZ, YWHAQ (normal) |
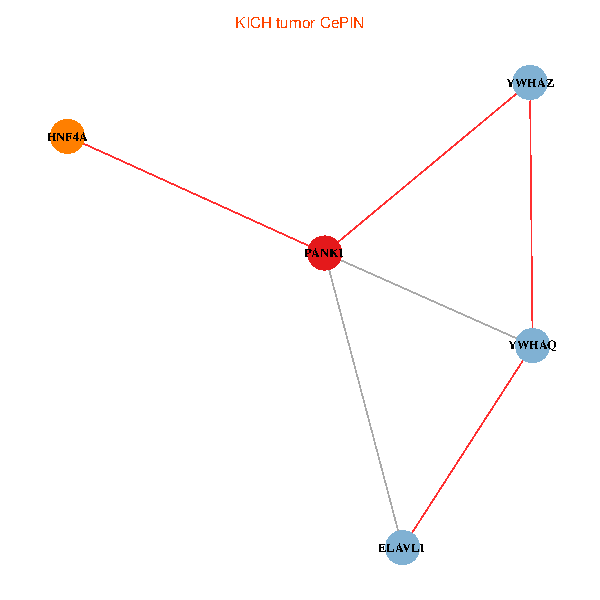 |  |
| KIRC (tumor) | KIRC (normal) |
| PANK1, HNF4A, ELAVL1, YWHAZ, YWHAQ (tumor) | PANK1, HNF4A, ELAVL1, YWHAZ, YWHAQ (normal) |
 |  |
| KIRP (tumor) | KIRP (normal) |
| PANK1, HNF4A, ELAVL1, YWHAZ, YWHAQ (tumor) | PANK1, HNF4A, ELAVL1, YWHAZ, YWHAQ (normal) |
 |  |
| LIHC (tumor) | LIHC (normal) |
| PANK1, HNF4A, ELAVL1, YWHAZ, YWHAQ (tumor) | PANK1, HNF4A, ELAVL1, YWHAZ, YWHAQ (normal) |
 |  |
| LUAD (tumor) | LUAD (normal) |
| PANK1, HNF4A, ELAVL1, YWHAZ, YWHAQ (tumor) | PANK1, HNF4A, ELAVL1, YWHAZ, YWHAQ (normal) |
 |  |
| LUSC (tumor) | LUSC (normal) |
| PANK1, HNF4A, ELAVL1, YWHAZ, YWHAQ (tumor) | PANK1, HNF4A, ELAVL1, YWHAZ, YWHAQ (normal) |
 |  |
| PRAD (tumor) | PRAD (normal) |
| PANK1, HNF4A, ELAVL1, YWHAZ, YWHAQ (tumor) | PANK1, HNF4A, ELAVL1, YWHAZ, YWHAQ (normal) |
 |  |
| STAD (tumor) | STAD (normal) |
| PANK1, HNF4A, ELAVL1, YWHAZ, YWHAQ (tumor) | PANK1, HNF4A, ELAVL1, YWHAZ, YWHAQ (normal) |
 |  |
| THCA (tumor) | THCA (normal) |
| PANK1, HNF4A, ELAVL1, YWHAZ, YWHAQ (tumor) | PANK1, HNF4A, ELAVL1, YWHAZ, YWHAQ (normal) |
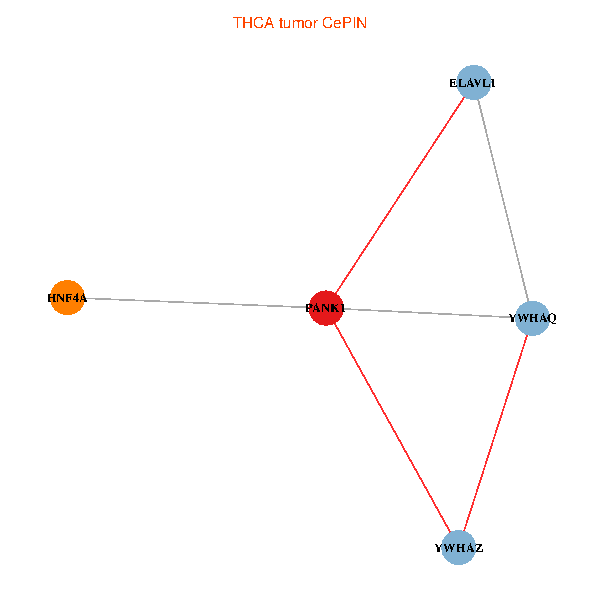 | 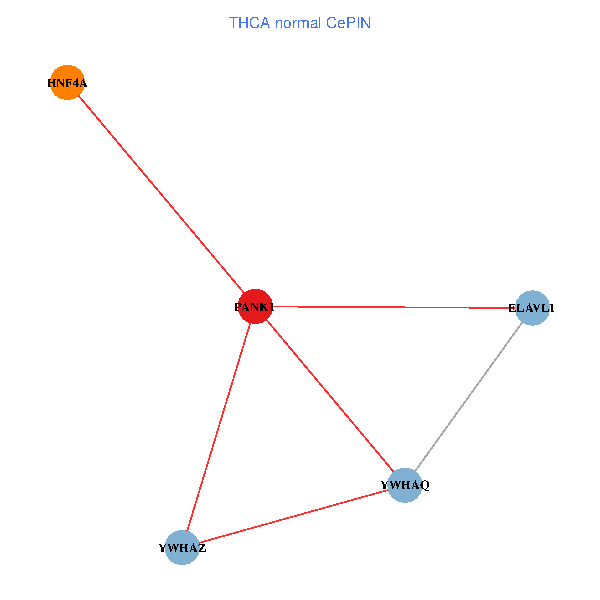 |
| Top |
| TissGeneProg for PANK1 |
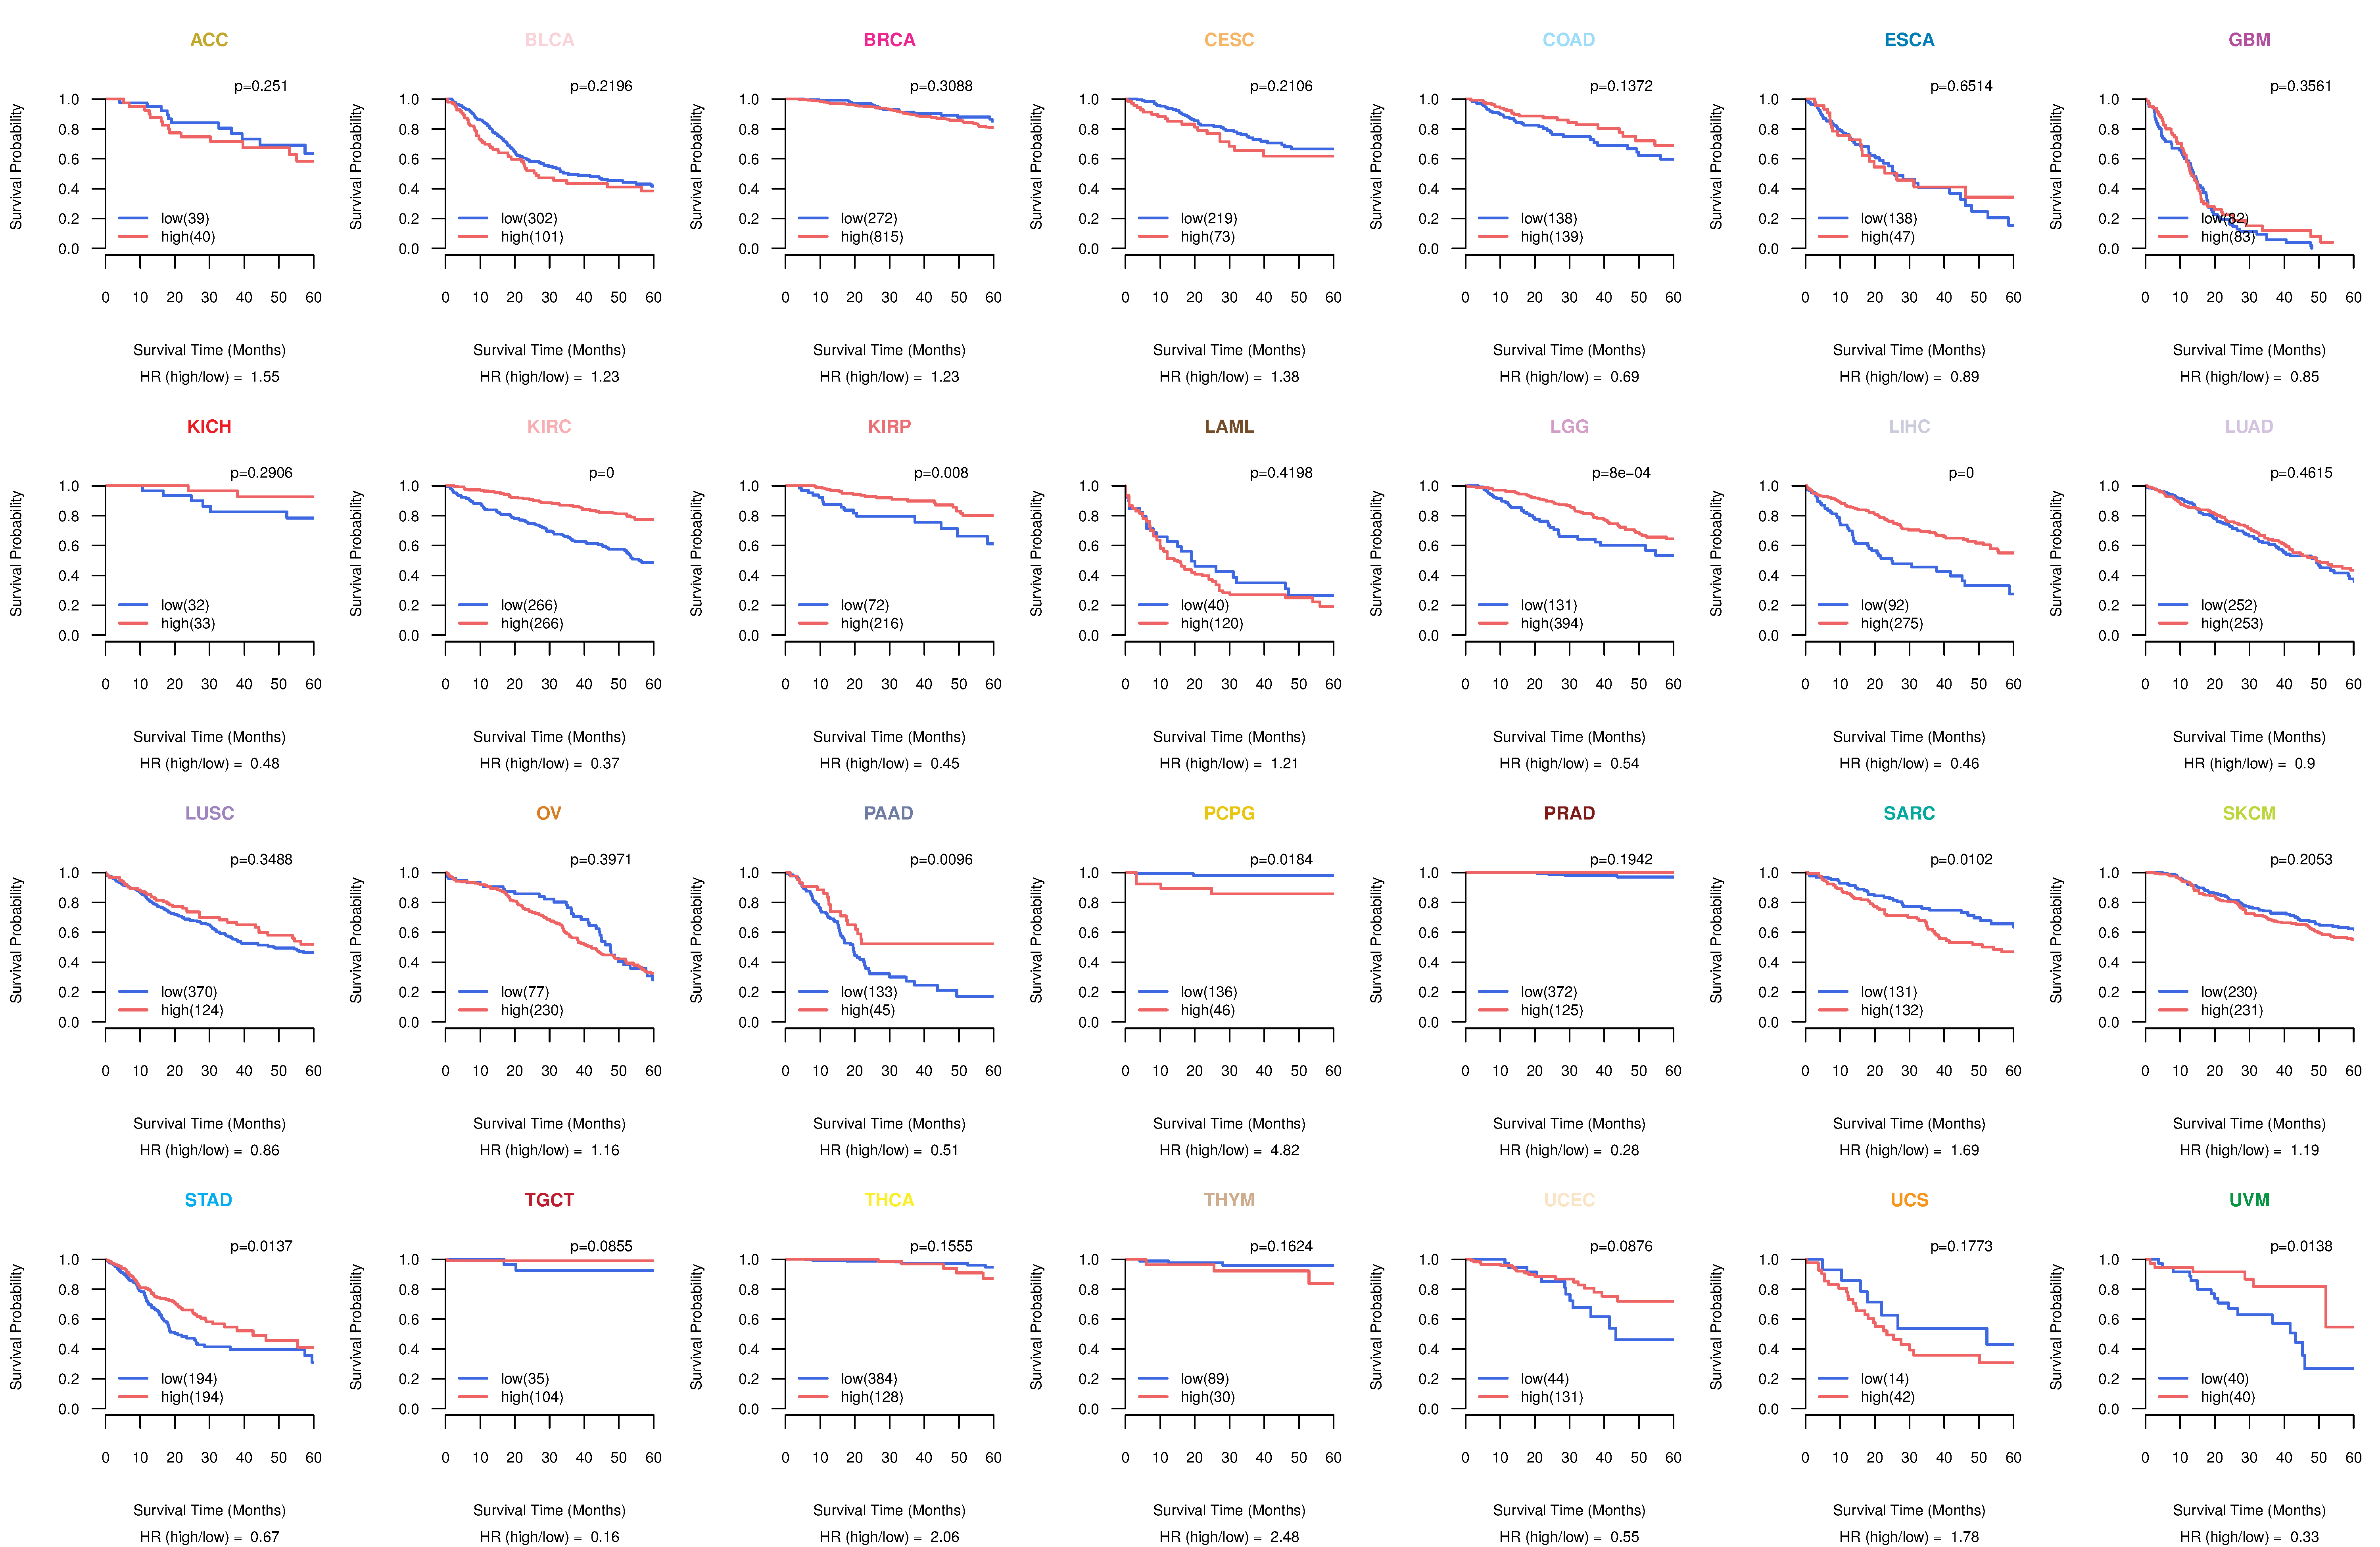
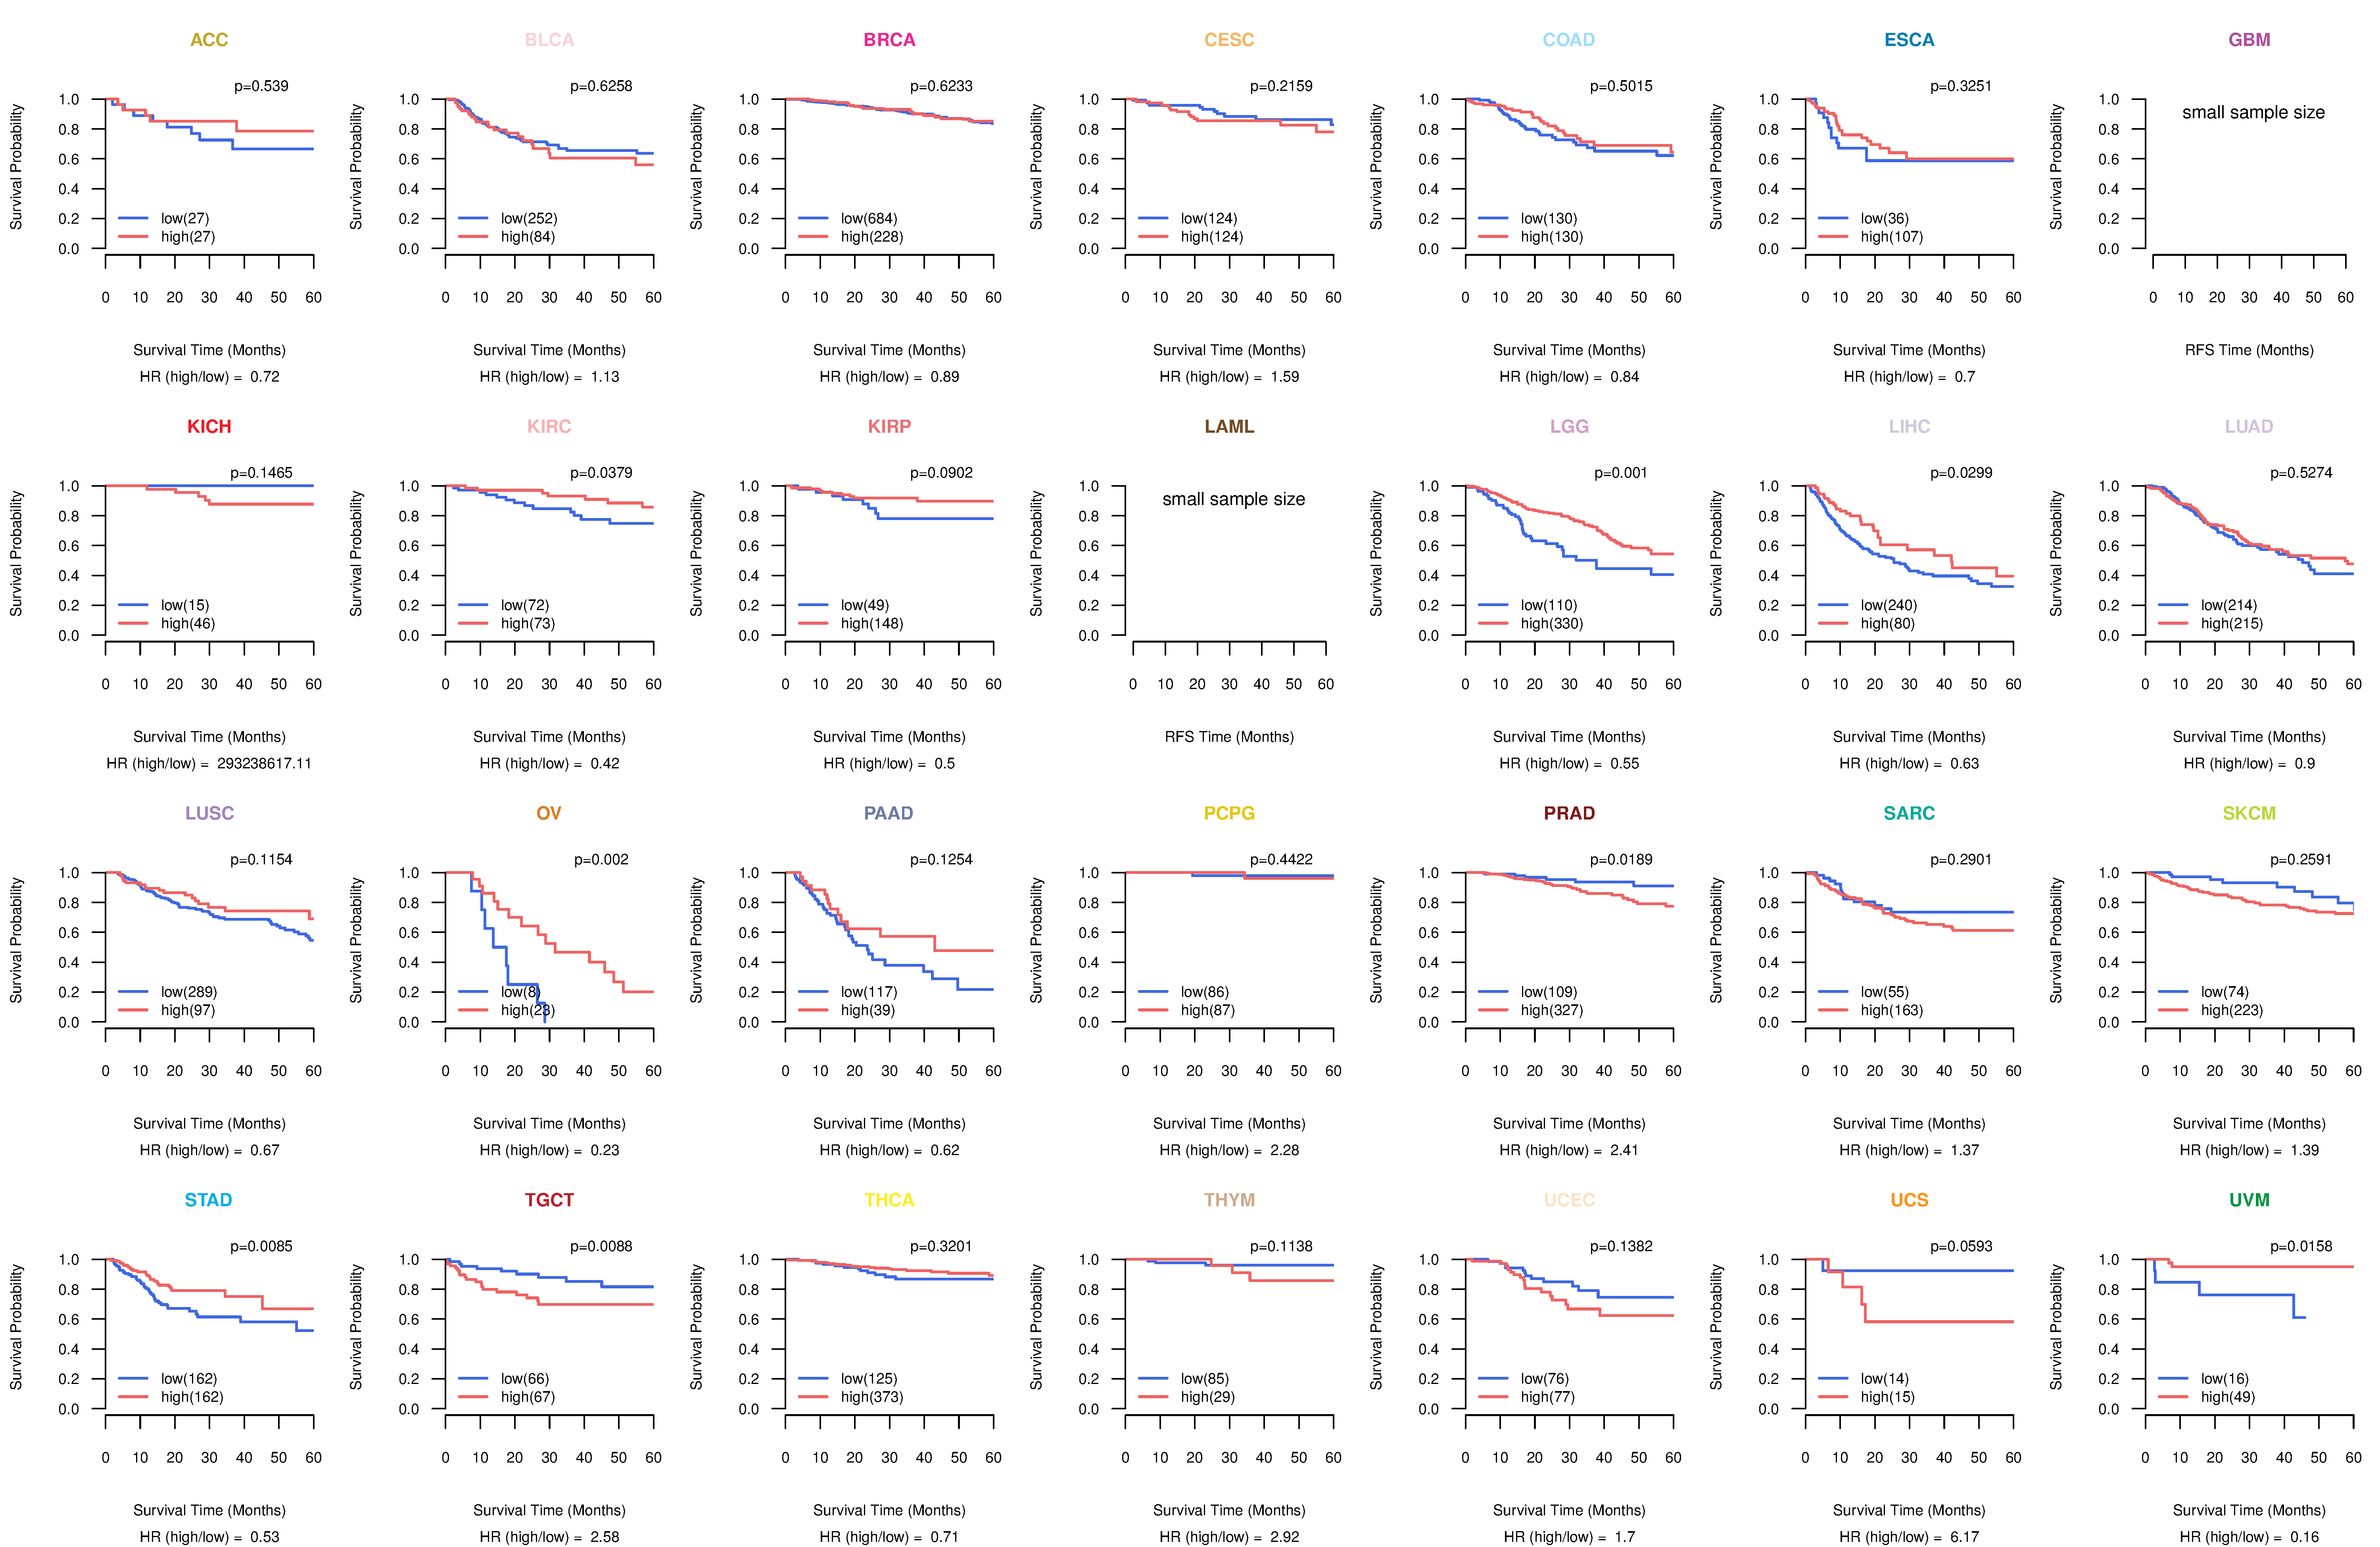
| Kaplan-Meier plots with logrank tests of overall survival (OS) using 28 cancer types (TCGA IlluminaHiSeq_RNASeqV2, pan-cancer normalized log2(norm_counts+1) data, version 2016-08-16) (TCGA clinicalMatrix, phenotype data, version 2016-04-27) * Click on the image to enlarge it in a new window. |
 |
| Kaplan-Meier plots with logrank test of relapse free survival (RFS) using 28 cancer types (TCGA IlluminaHiSeq_RNASeqV2, pan-cancer normalized log2(norm_counts+1) data, version 2016-08-16) (TCGA clinicalMatrix, phenotype data, version 2016-04-27) * Click on the image enlarge it in a new window. |
 |
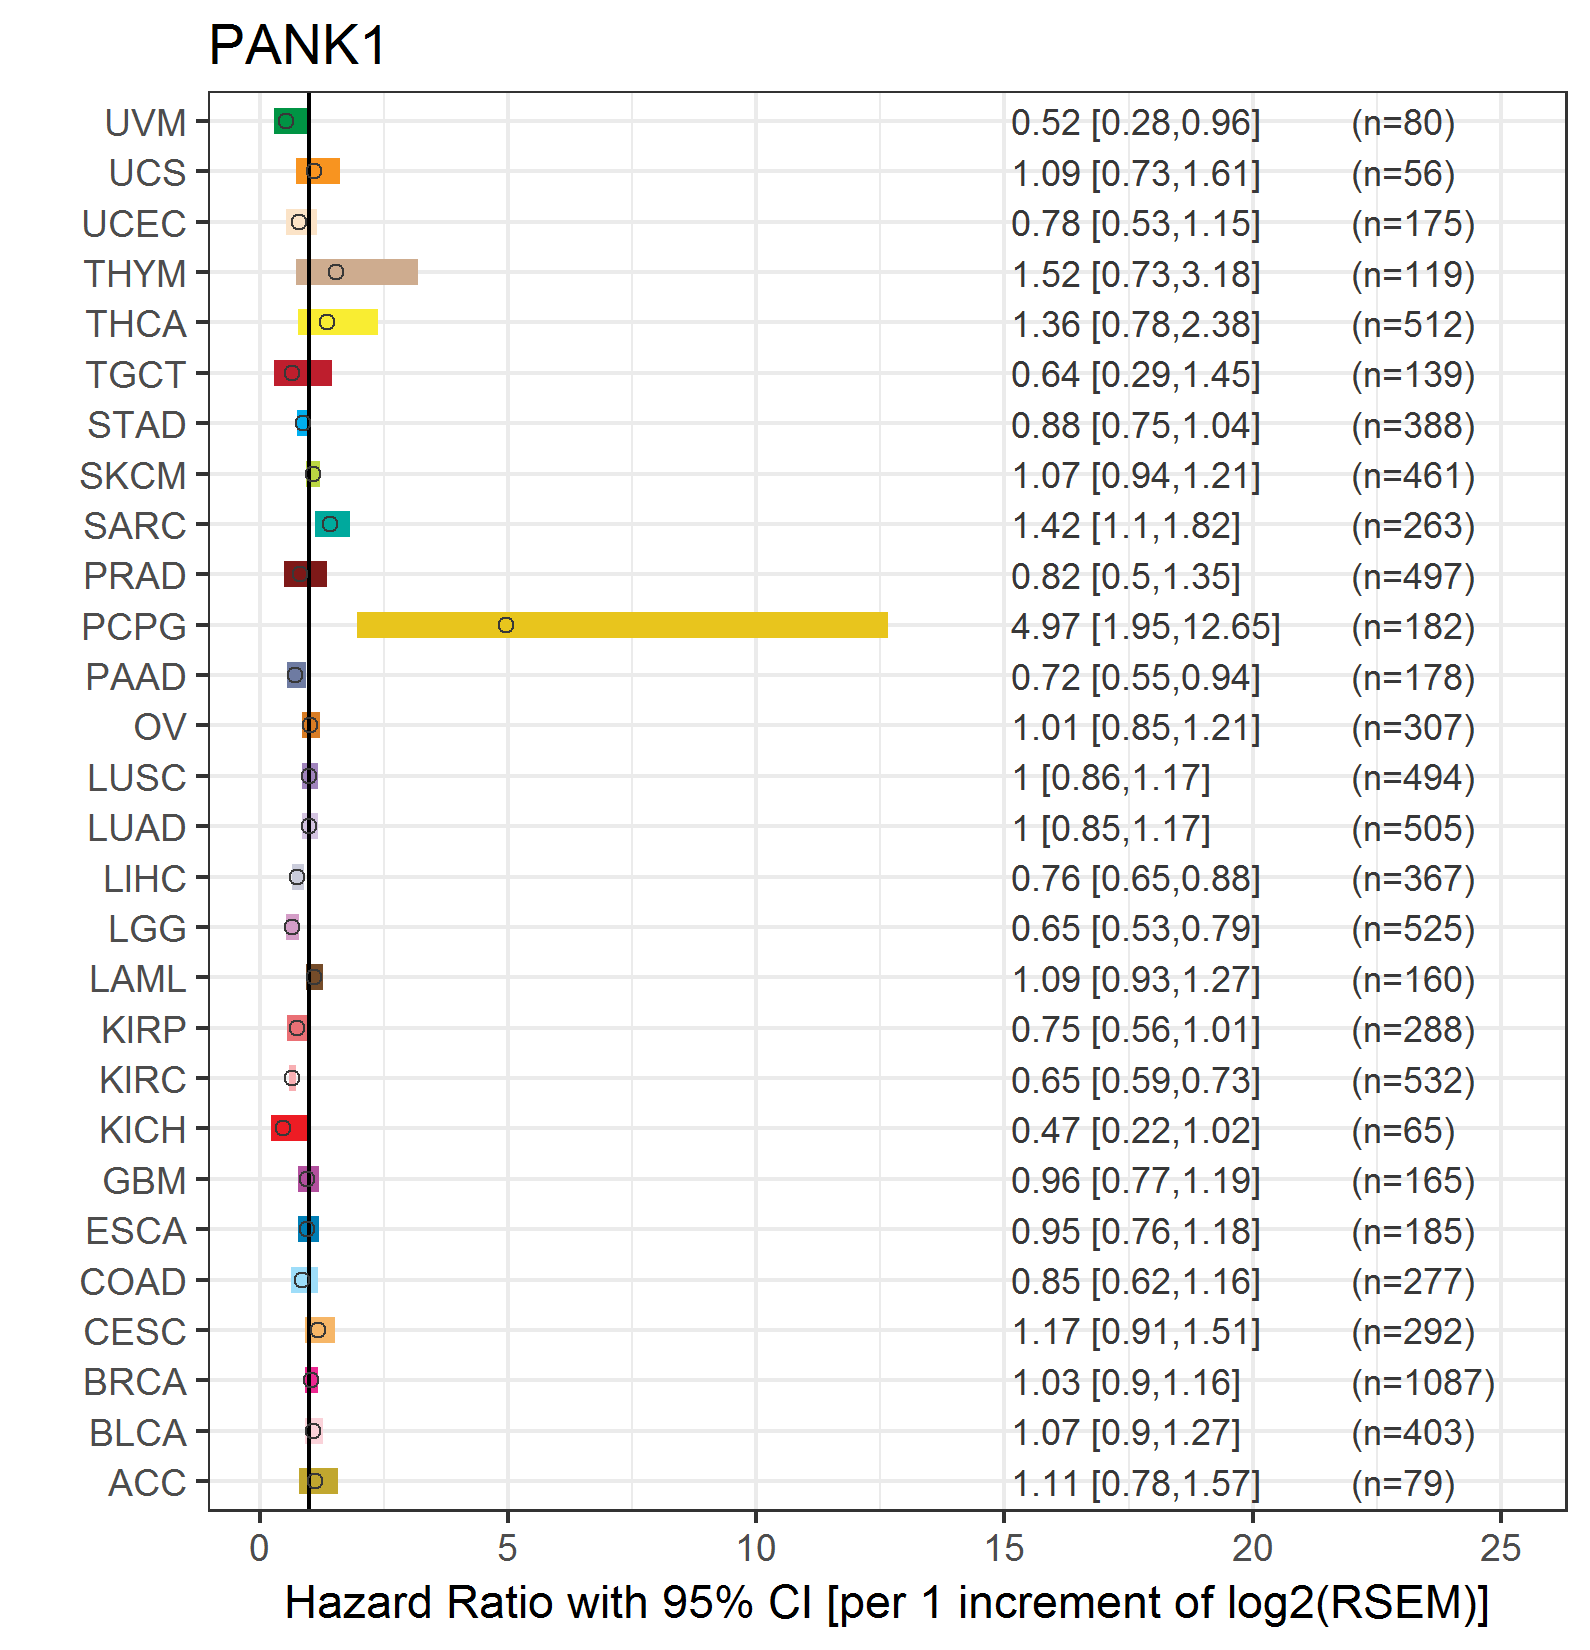
| Forest plot of Cox proportional hazard ratio (HR) and 95% CI of overall survival (OS) using 28 cancer types (TCGA IlluminaHiSeq_RNASeqV2, pan-cancer normalized log2(norm_counts+1) data, version 2016-08-16) (TCGA clinicalMatrix, phenotype data, version 2016-04-27) * Click on the image enlarge it in a new window. |
 |
| Forest plot of Cox proportional hazard ratio (HR) and 95% CI of relapse free survival (RFS) using 28 cancer types (TCGA IlluminaHiSeq_RNASeqV2, pan-cancer normalized log2(norm_counts+1) data, version 2016-08-16) (TCGA clinicalMatrix, phenotype data, version 2016-04-27) * Click on the image enlarge it in a new window. |
 |
| Top |
| TissGeneClin for PANK1 |
| TissGeneDrug for PANK1 |
| Drug information targeting TissGene (DrugBank Version 5.0.6, 2017-04-01) |
| DrugBank ID | Drug name | Drug activity | Drug type | Drug status |
| Top |
| TissGeneDisease for PANK1 |
| Disease information associated with TissGene (DisGeNet, 2016-06-01) |
| Disease ID | Disease name | # pubmeds | Source |
| umls:C0018523 | Hallervorden-Spatz Syndrome | 7 | BeFree |
| umls:C0524851 | Neurodegenerative Disorders | 2 | BeFree |
| umls:C2931845 | Neurodegeneration with brain iron accumulation (NBIA) | 2 | BeFree |
| umls:C0038160 | Staphylococcal Infections | 1 | BeFree |
| umls:C0040336 | Tobacco Use Disorder | 1 | GAD |
| umls:C0270724 | Infantile Neuroaxonal Dystrophy | 1 | BeFree |
|
Copyright 2016-Present - The University of Texas Health Science Center at Houston (UTHealth) Web File Viewing | How to Report, Fraud, Waste and Abuse | State of Texas | Statewide Search | Texas Homeland Security | Site Policies |