 |
| |
| |
| |
| |
| |
| |
|

| TissGeneSummary for PLP1 |
 Gene summary Gene summary |
| Basic gene information | Gene symbol | PLP1 |
| Gene name | proteolipid protein 1 | |
| Synonyms | GPM6C|HLD1|MMPL|PLP|PLP/DM20|PMD|SPG2 | |
| Cytomap | UCSC genome browser: Xq22 | |
| Type of gene | protein-coding | |
| RefGenes | NM_000533.3, NM_001128834.1,NM_199478.1, | |
| Description | lipophilinmajor myelin proteolipid proteinmyelin proteolipid protein | |
| Modification date | 20141219 | |
| dbXrefs | MIM : 300401 | |
| HGNC : HGNC | ||
| Ensembl : ENSG00000123560 | ||
| HPRD : 02321 | ||
| Vega : OTTHUMG00000022111 | ||
| Protein | UniProt: go to UniProt's Cross Reference DB Table | |
| Expression | CleanEX: HS_PLP1 | |
| BioGPS: 5354 | ||
| Pathway | NCI Pathway Interaction Database: PLP1 | |
| KEGG: PLP1 | ||
| REACTOME: PLP1 | ||
| Pathway Commons: PLP1 | ||
| Context | iHOP: PLP1 | |
| ligand binding site mutation search in PubMed: PLP1 | ||
| UCL Cancer Institute: PLP1 | ||
| Assigned class in TissGDB* | C | |
| Included tissue-specific gene expression resources | HPA,TiGER | |
| Specific-tissues in normal samples (assigned by TissGDB using HPA, TiGER, and GTEx) | Brain | |
| Cancer types related to the specific-tissues in cancer samples (assigned by TissGDB using TCGA) | GBM,LGG | |
| Reference showing the relevant tissue of PLP1 | ||
| Description by TissGene annotations | Have significant anti-correlated miRNA Fused withTSGene Fused withOncogene | |
| * Class A consists of genes with literature evidence and is part of the cTissGenes. Class B consists of only cTissGenes without additional evidence. The remaining genes belong to Class C. |
| Gene ontology having evidence of Inferred from Direct Assay (IDA) from Entrez |
| GO ID | GO term | PubMed ID |
| Top |
| TissGeneExp for PLP1 |
| Gene expressions across 28 cancer types (X-axis: cancer type and Y-axis: log2(norm_counts+1)) (TCGA IlluminaHiSeq_RNASeqV2, pan-cancer normalized log2(norm_counts+1) data, version 2016-08-16) |
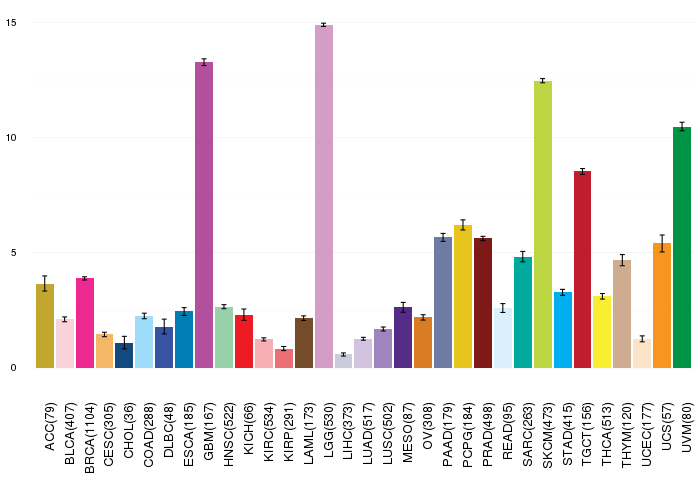 |
| Gene isoform expressions across 28 cancer types (X-axis: cancer type and Y-axis: log2(norm_counts+1)) (TCGA pan-cancer tcga_rsem_isoform_tpm, version 2016-09-01) |
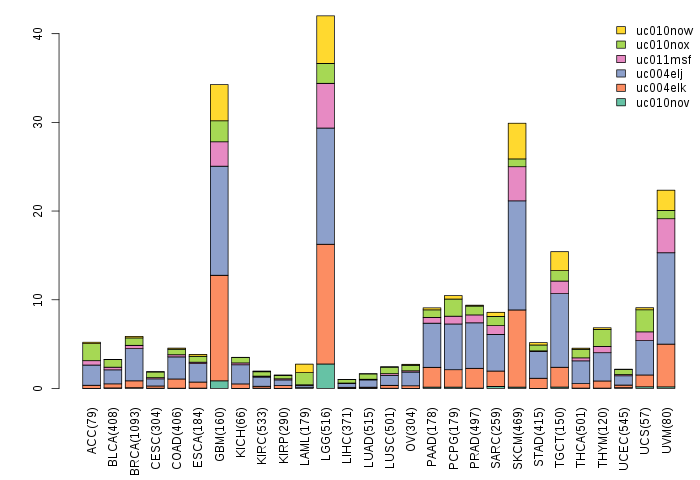 |
| Gene expressions across normal tissues of GTEx data (GTEx GTEx_Analysis_v6_RNA-seq_RNA-SeQCv1.1.8_gene_rpkm.gct) - Here, we shows the matched tissue types only among our 28 cancer types. |
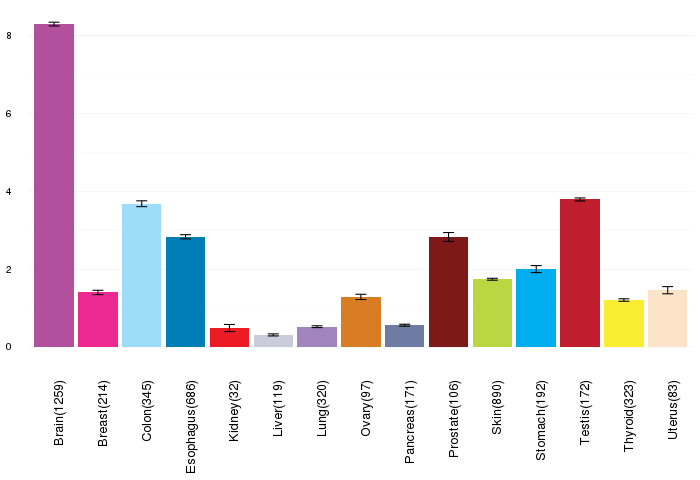 |
| Different expressions across 14 cancer types with more than 10 samples between matched tumors and normals (X-axis: cancer type and Y-axis: log2(norm_counts+1)) (TCGA IlluminaHiSeq_RNASeqV2, pan-cancer normalized log2(norm_counts+1) data, version 2016-08-16) |
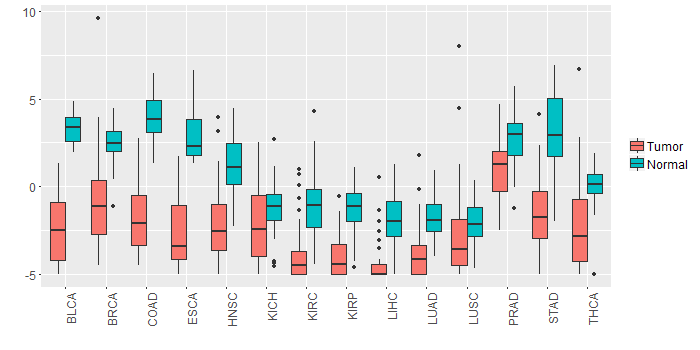 |
| - Significantly differentially expressed cancer types and information. (|Fold change|>1 and FDR<0.05) |
| Cancer type | Mean(exp) in tumor | Mean(exp) in matched normal | Log2FC | P-val. | FDR |
| LIHC | -4.494249521 | -1.859117521 | -2.635132 | 2.05E-17 | 9.69E-16 |
| HNSC | -2.158162032 | 1.300696107 | -3.45885814 | 2.82E-12 | 8.81E-11 |
| LUAD | -3.7792569 | -1.765017245 | -2.014239655 | 9.81E-14 | 8.66E-13 |
| COAD | -1.878173213 | 3.939530633 | -5.817703846 | 4.72E-17 | 5.44E-15 |
| PRAD | 0.929880633 | 2.811072941 | -1.881192308 | 3.41E-09 | 4.75E-08 |
| KIRP | -3.872662396 | -1.271465521 | -2.601196875 | 3.21E-10 | 3.32E-09 |
| BLCA | -2.304499731 | 3.313605532 | -5.618105263 | 1.08E-10 | 2.67E-08 |
| STAD | -1.448809271 | 3.236178229 | -4.6849875 | 1.18E-11 | 2.21E-09 |
| BRCA | -1.026152363 | 2.482458163 | -3.508610526 | 1.31E-32 | 2.00E-31 |
| KIRC | -3.983680799 | -1.148787743 | -2.834893056 | 1.82E-19 | 1.36E-18 |
| THCA | -2.023088402 | 0.083672615 | -2.106761017 | 2.44E-07 | 1.01E-06 |
| ESCA | -2.612579157 | 2.977220843 | -5.5898 | 1.08E-06 | 0.000542656 |
| Top |
| TissGene-miRNA for PLP1 |
| Significantly anti-correlated miRNAs of TissGene across 28 cancer types (Gene-miRNA relations from TargetScanHuman Relsease 7.1, Conserved_Site_Context_Scores.txt.zip, 06.01.2016) (TCGA IlluminaHiSeq_miRNASeq, log2(RPM+1) data, version 2016-11-21) (TCGA IlluminaHiSeq_RNASeqV2, log2(normalized_count+1) data, version 2016-08-16) (Spearman’s Rank Correlation (p-value<0.05 and coefficient<-0.25)) |
| Cancer type | miRNA id | miRNA accession | P-val. | Coeff. | # samples |
| THYM | hsa-miR-29b-3p | MIMAT0000100 | 0.00075 | -0.3 | 122 |
| Top |
| TissGeneMut for PLP1 |
| TissGeneSNV for PLP1 |
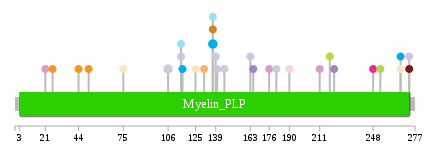
| nsSNV counts per each loci. Different colors of circles represent different cancer types. Circle size denotes number of samples. (TCGA somatic mutation (SNPs and small INDELs) data, version 2016-04-25) * Click on the image to enlarge it in a new window. |
 |
 |
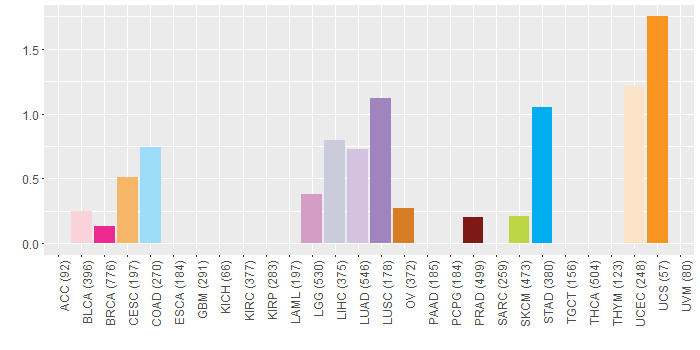
| Somatic nucleotide variants of TissGene across 28 cancer types (X-axis: cancer type and Y-axis: % of mutated samples) The numbers in parentheses are numbers of samples with mutation (nsSNVs). (TCGA somatic mutation (SNPs and small INDELs) data, version 2016-04-25) |
 |
| - nsSNVs sorted by frequency. |
| AAchange | Cancer type | # samples |
| p.T106A | LIHC | 2 |
| p.R137W | STAD | 2 |
| p.L46Q | READ | 1 |
| p.A248E | BRCA | 1 |
| p.T75S | UCEC | 1 |
| p.S253F | SKCM | 1 |
| p.Q131E | HNSC | 1 |
| p.W145X | LIHC | 1 |
| p.P190T | BLCA | 1 |
| p.F26L | UCS | 1 |
| p.V267I | UCEC | 1 |
| p.V267I | STAD | 1 |
| p.A115T | LUAD | 1 |
| p.G221V | LUSC | 1 |
| p.Q131E | CESC | 1 |
| p.G125S | UCEC | 1 |
| p.P211S | LGG | 1 |
| p.C139S | LUAD | 1 |
| p.A21V | LGG | 1 |
| p.W181C | LIHC | 1 |
| p.T116M | STAD | 1 |
| p.R273Q | PRAD | 1 |
| p.E44K | UCS | 1 |
| p.H140R | LUAD | 1 |
| p.P176S | LGG | 1 |
| p.R137W | OV | 1 |
| p.W163C | LUAD | 1 |
| p.R273Q | LUAD | 1 |
| p.R137Q | COAD | 1 |
| p.L165P | LUSC | 1 |
| p.S218F | SKCM | 1 |
| p.F51L | UCS | 1 |
| p.A115T | COAD | 1 |
| Top |
| TissGeneCNV for PLP1 |
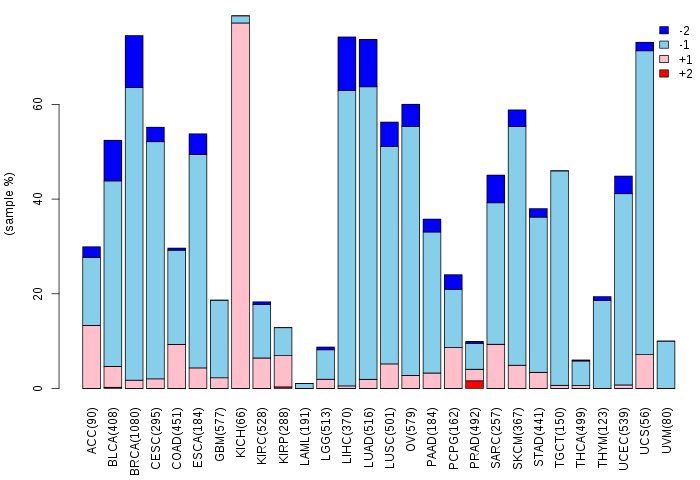
| Copy number variations of TissGene across 28 cancer types (X-axis: cancer type and Y-axis: % of CNV samples) (TCGA Gistic2_CopyNumber_Gistic2_all_data_by_genes, Gistic2 copy number data, version 2016-08-16) |
 |
| Top |
| TissGeneFusions for PLP1 |
| Fusion genes including TissGene (ChimerDB 3.0, 2016-12-01 and TCGA fusion Portal 2015-12-01) |
| Database | Src | Cancer type | Sample | Fusion gene | ORF | 5'-gene BP | 3'-gene BP |
| Chimerdb3.0 | ChiTaRs | NA | DA174856 | PLP1-GNPAT | chrX:103031891 | chr1:231410993 | |
| Chimerdb3.0 | ChiTaRs | NA | DA387913 | EPAS1-PLP1 | chr2:46524725 | chrX:103031798 | |
| Chimerdb3.0 | ChiTaRs | NA | AV723721 | PLP1-MAN2A2 | chrX:103045735 | chr15:91464074 | |
| Chimerdb3.0 | ChiTaRs | NA | AA348328 | PRRG1-PLP1 | chrX:37285177 | chrX:103043392 | |
| Chimerdb3.0 | ChiTaRs | NA | CR740283 | PLP1-PLP1 | chrX:103046888 | chrX:103046981 | |
| Chimerdb3.0 | ChiTaRs | NA | DA415824 | PTTG1IP-PLP1 | chr21:46285138 | chrX:103031845 | |
| Chimerdb3.0 | ChiTaRs | NA | ES316348 | MRPL10-PLP1 | chr17:45901092 | chrX:103045970 | |
| Chimerdb3.0 | ChiTaRs | NA | DA386793 | RNU12-PLP1 | chr22:43011399 | chrX:103031768 | |
| Chimerdb3.0 | ChiTaRs | NA | DA327340 | OAZ1-PLP1 | chr19:2269577 | chrX:103031802 | |
| Chimerdb3.0 | ChiTaRs | NA | DB171847 | MBNL2-PLP1 | chr13:97882117 | chrX:103031802 | |
| TCGAfusionPortal | PRADA | LGG | TCGA-HT-7902-01A | PLP1-SGK1 | NA | ChrX:103047545 | Chr6:134639049 |
| Top |
| TissGeneNet for PLP1 |
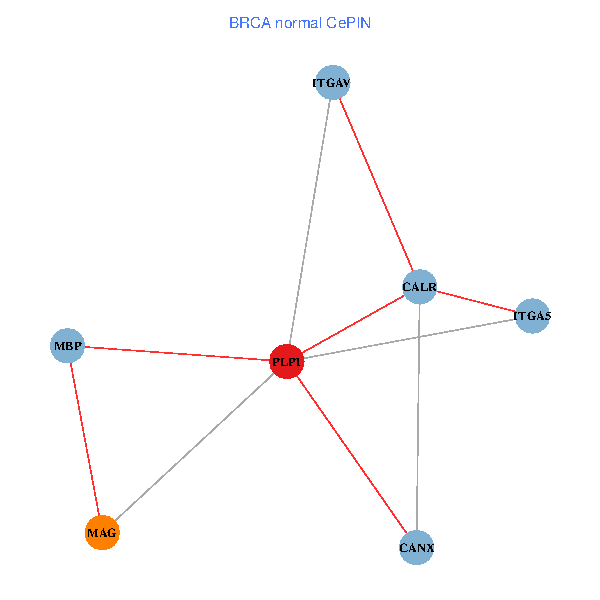
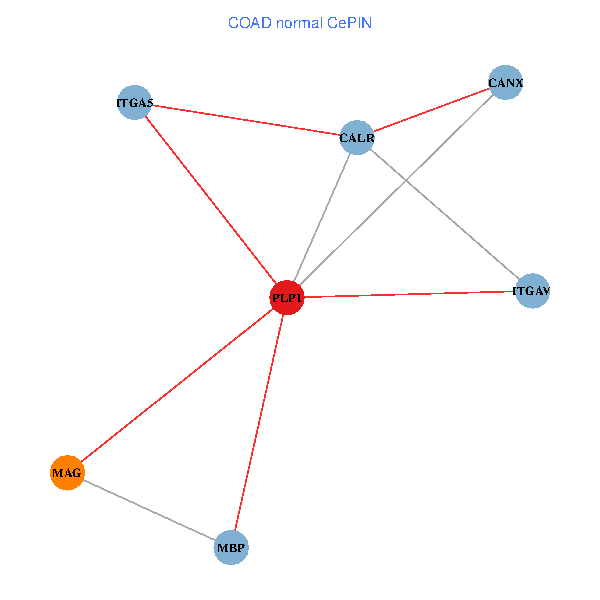
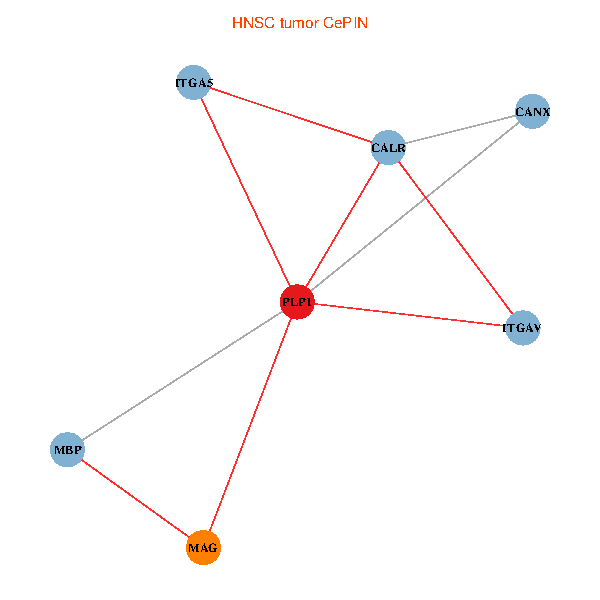
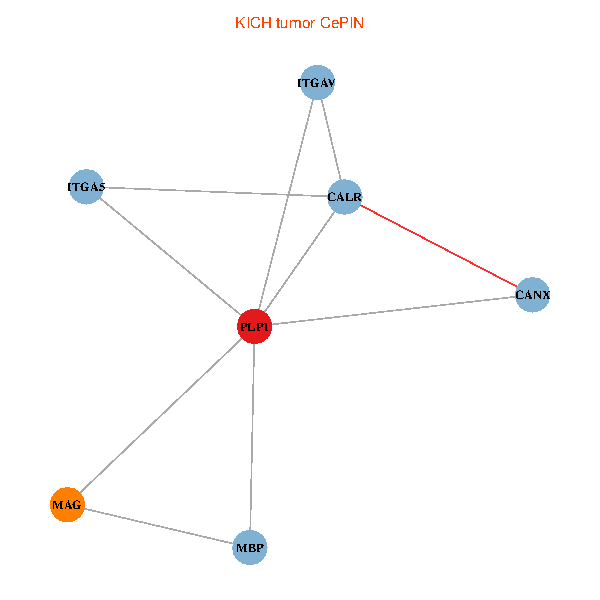
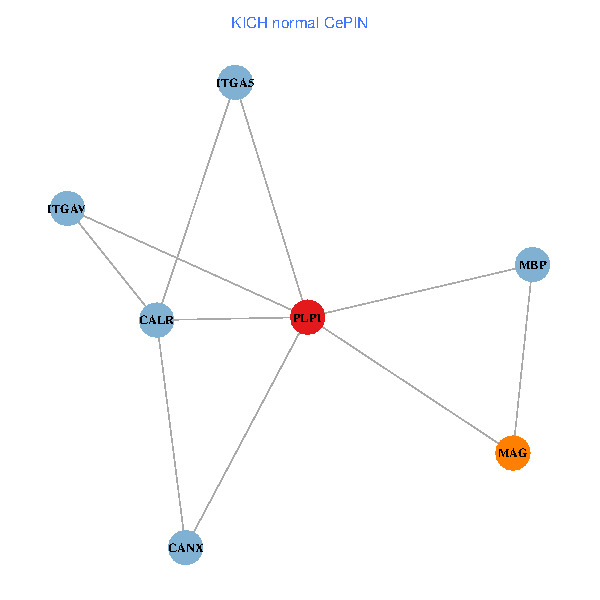
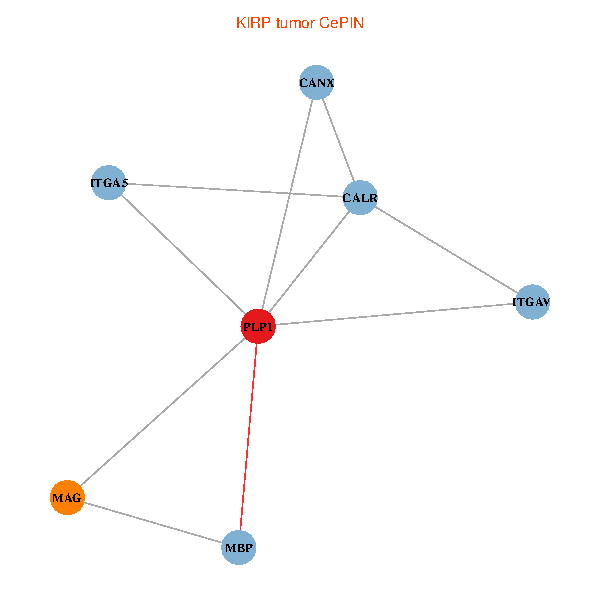
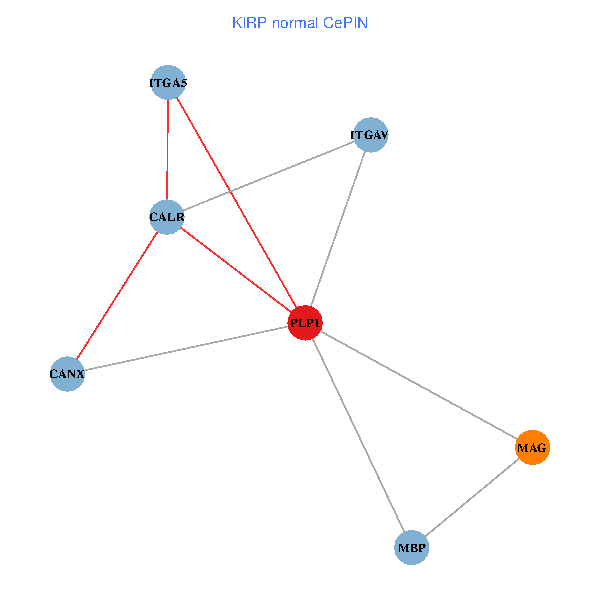
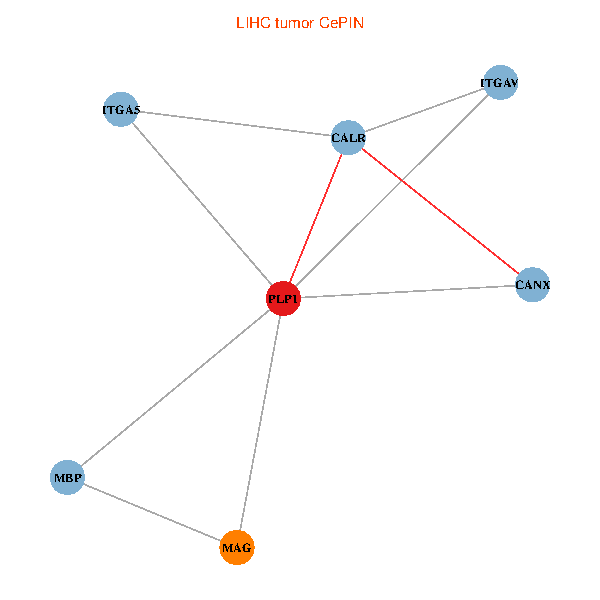
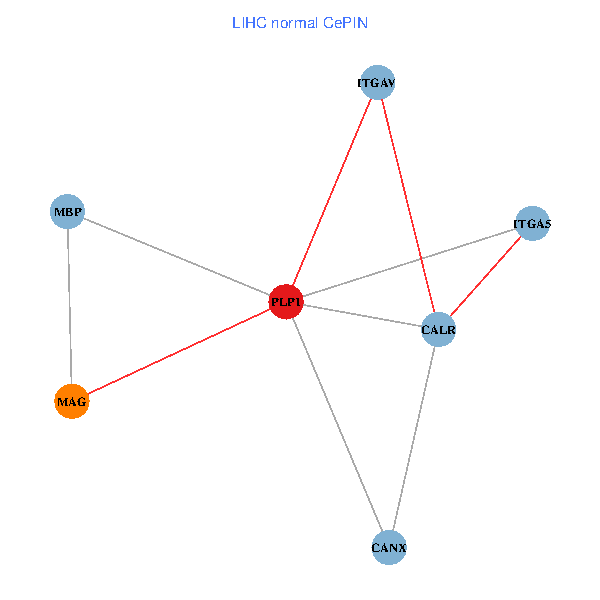
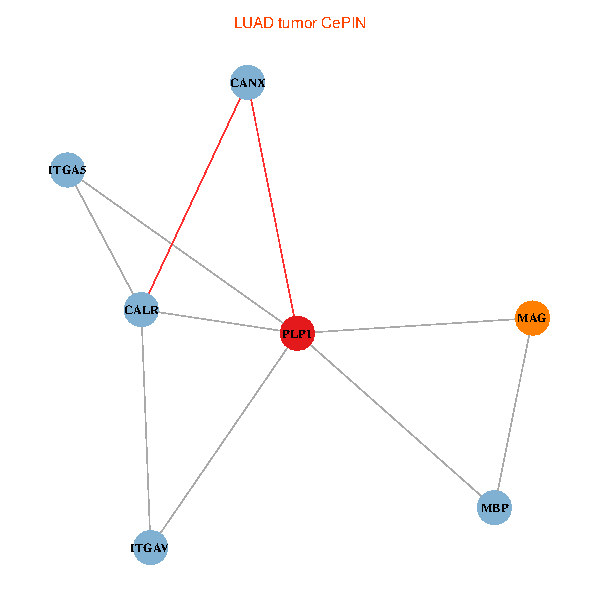
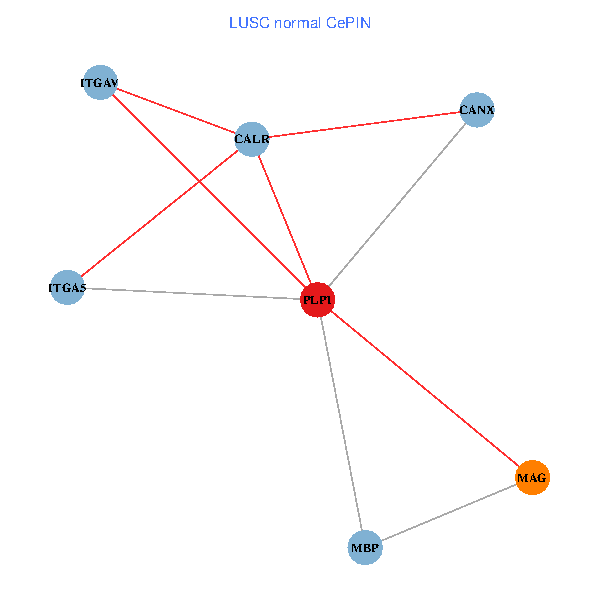
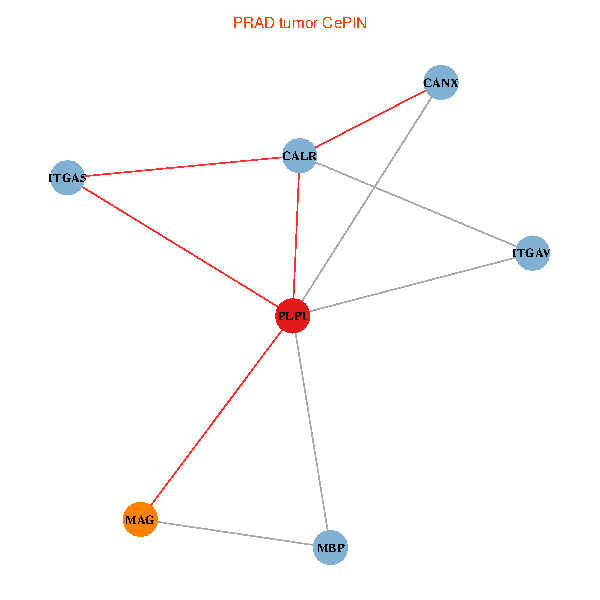
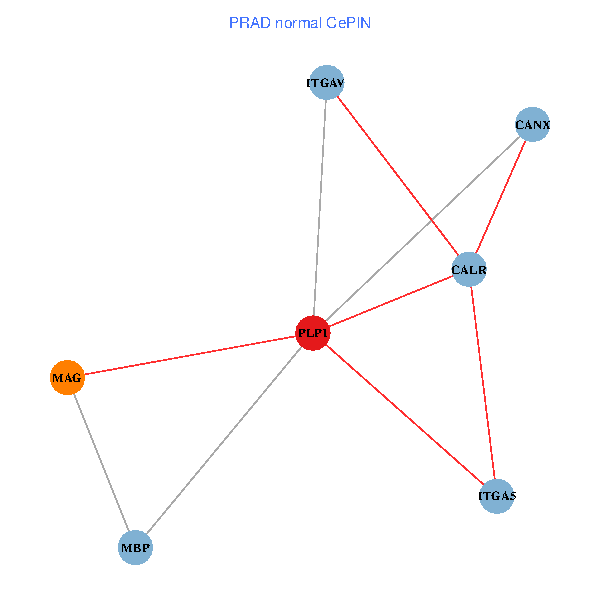
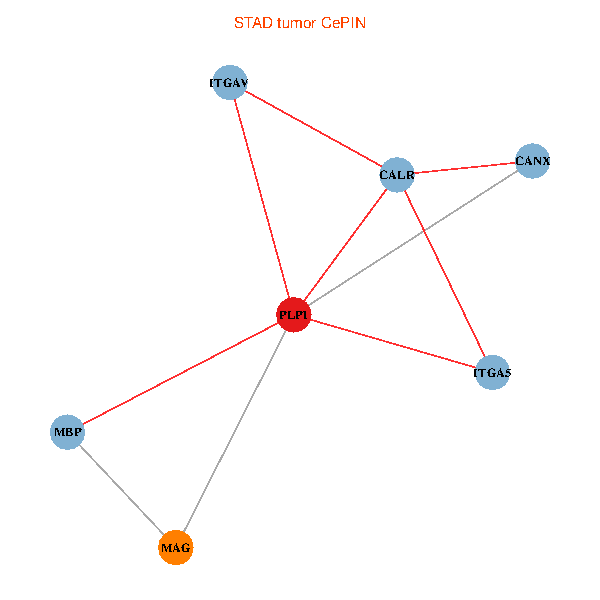
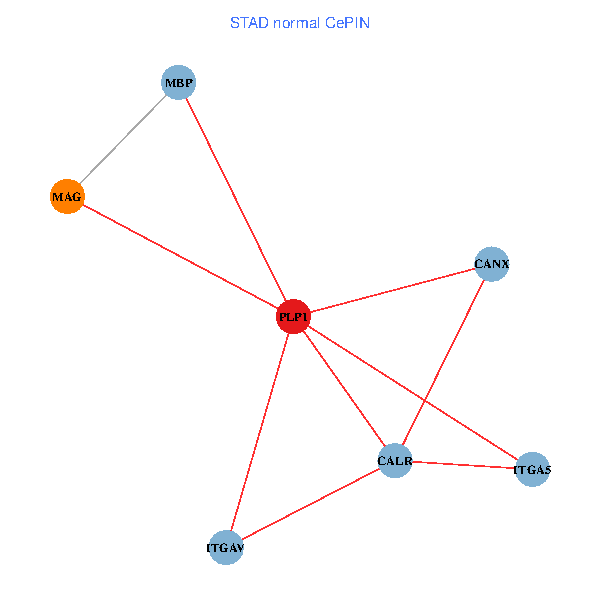
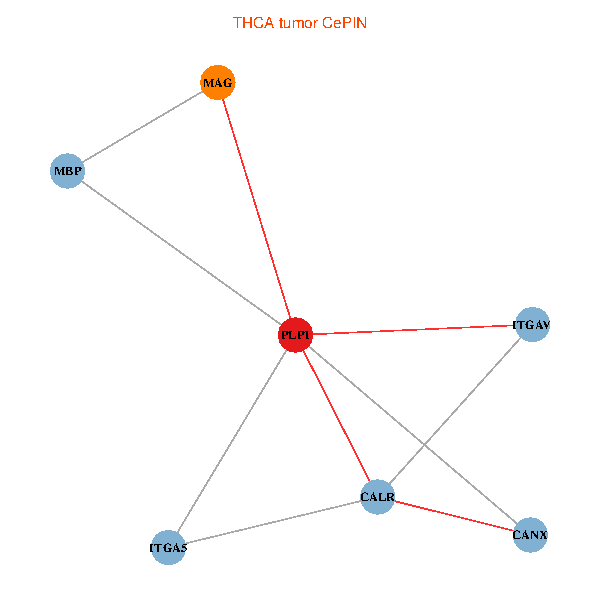
| Co-expressed gene networks based on protein-protein interaction data (CePIN) (TCGA IlluminaHiSeq_RNASeqV2, pan-cancer normalized log2(norm_counts+1) data, version 2016-08-16) (PINA2 ppi data) |
| BRCA (tumor) | BRCA (normal) |
| PLP1, MBP, ITGAV, CALR, CANX, MAG, ITGA5 (tumor) | PLP1, MBP, ITGAV, CALR, CANX, MAG, ITGA5 (normal) |
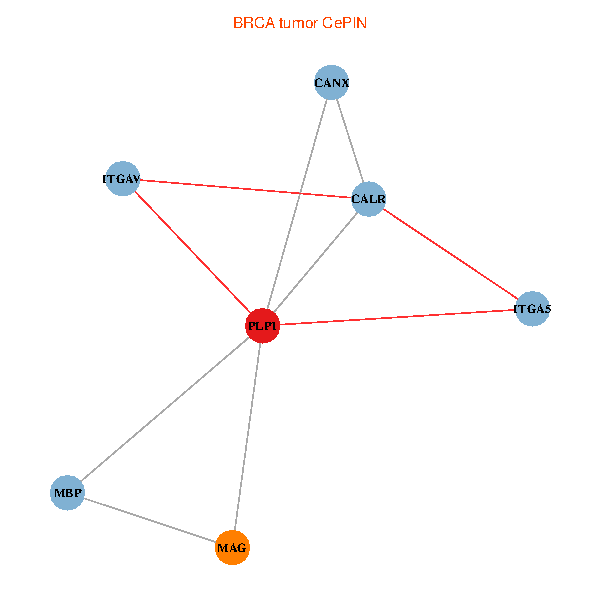 |  |
| COAD (tumor) | COAD (normal) |
| PLP1, MBP, ITGAV, CALR, CANX, MAG, ITGA5 (tumor) | PLP1, MBP, ITGAV, CALR, CANX, MAG, ITGA5 (normal) |
 |  |
| HNSC (tumor) | HNSC (normal) |
| PLP1, MBP, ITGAV, CALR, CANX, MAG, ITGA5 (tumor) | PLP1, MBP, ITGAV, CALR, CANX, MAG, ITGA5 (normal) |
 |  |
| KICH (tumor) | KICH (normal) |
| PLP1, MBP, ITGAV, CALR, CANX, MAG, ITGA5 (tumor) | PLP1, MBP, ITGAV, CALR, CANX, MAG, ITGA5 (normal) |
 |  |
| KIRC (tumor) | KIRC (normal) |
| PLP1, MBP, ITGAV, CALR, CANX, MAG, ITGA5 (tumor) | PLP1, MBP, ITGAV, CALR, CANX, MAG, ITGA5 (normal) |
 |  |
| KIRP (tumor) | KIRP (normal) |
| PLP1, MBP, ITGAV, CALR, CANX, MAG, ITGA5 (tumor) | PLP1, MBP, ITGAV, CALR, CANX, MAG, ITGA5 (normal) |
 |  |
| LIHC (tumor) | LIHC (normal) |
| PLP1, MBP, ITGAV, CALR, CANX, MAG, ITGA5 (tumor) | PLP1, MBP, ITGAV, CALR, CANX, MAG, ITGA5 (normal) |
 |  |
| LUAD (tumor) | LUAD (normal) |
| PLP1, MBP, ITGAV, CALR, CANX, MAG, ITGA5 (tumor) | PLP1, MBP, ITGAV, CALR, CANX, MAG, ITGA5 (normal) |
 |  |
| LUSC (tumor) | LUSC (normal) |
| PLP1, MBP, ITGAV, CALR, CANX, MAG, ITGA5 (tumor) | PLP1, MBP, ITGAV, CALR, CANX, MAG, ITGA5 (normal) |
 |  |
| PRAD (tumor) | PRAD (normal) |
| PLP1, MBP, ITGAV, CALR, CANX, MAG, ITGA5 (tumor) | PLP1, MBP, ITGAV, CALR, CANX, MAG, ITGA5 (normal) |
 |  |
| STAD (tumor) | STAD (normal) |
| PLP1, MBP, ITGAV, CALR, CANX, MAG, ITGA5 (tumor) | PLP1, MBP, ITGAV, CALR, CANX, MAG, ITGA5 (normal) |
 |  |
| THCA (tumor) | THCA (normal) |
| PLP1, MBP, ITGAV, CALR, CANX, MAG, ITGA5 (tumor) | PLP1, MBP, ITGAV, CALR, CANX, MAG, ITGA5 (normal) |
 |  |
| Top |
| TissGeneProg for PLP1 |
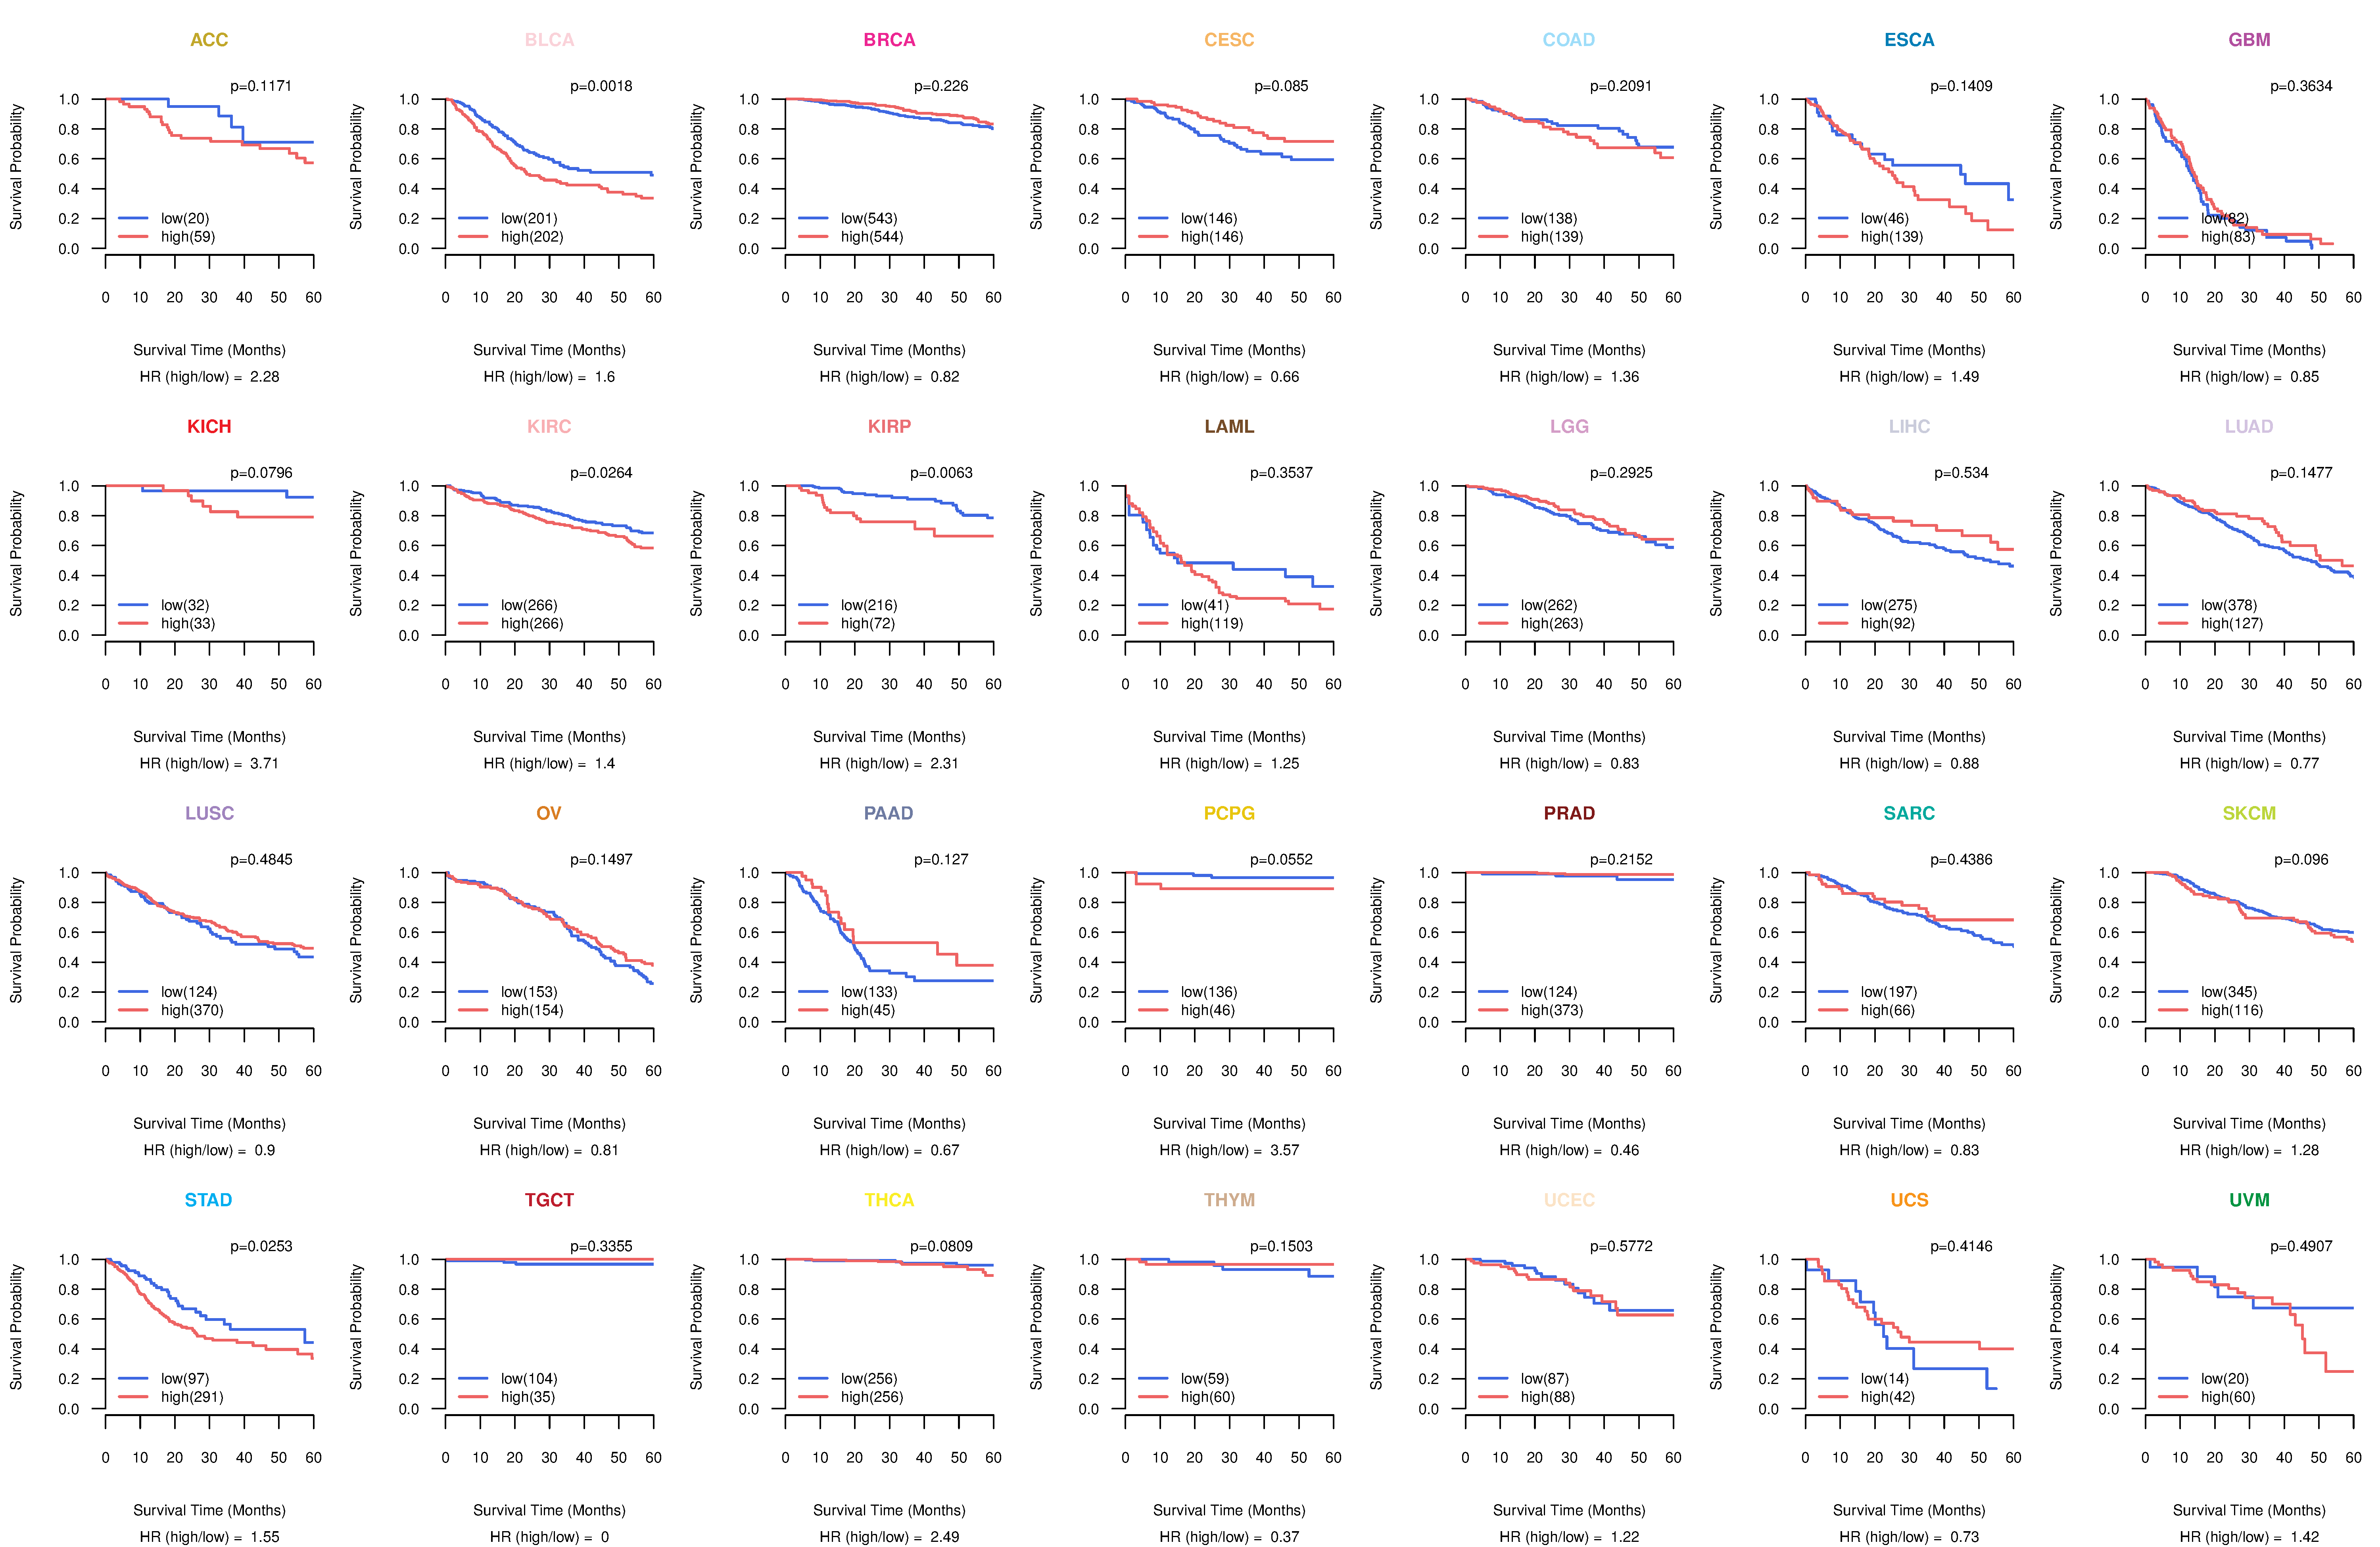
| Kaplan-Meier plots with logrank tests of overall survival (OS) using 28 cancer types (TCGA IlluminaHiSeq_RNASeqV2, pan-cancer normalized log2(norm_counts+1) data, version 2016-08-16) (TCGA clinicalMatrix, phenotype data, version 2016-04-27) * Click on the image to enlarge it in a new window. |
 |
| Kaplan-Meier plots with logrank test of relapse free survival (RFS) using 28 cancer types (TCGA IlluminaHiSeq_RNASeqV2, pan-cancer normalized log2(norm_counts+1) data, version 2016-08-16) (TCGA clinicalMatrix, phenotype data, version 2016-04-27) * Click on the image enlarge it in a new window. |
 |
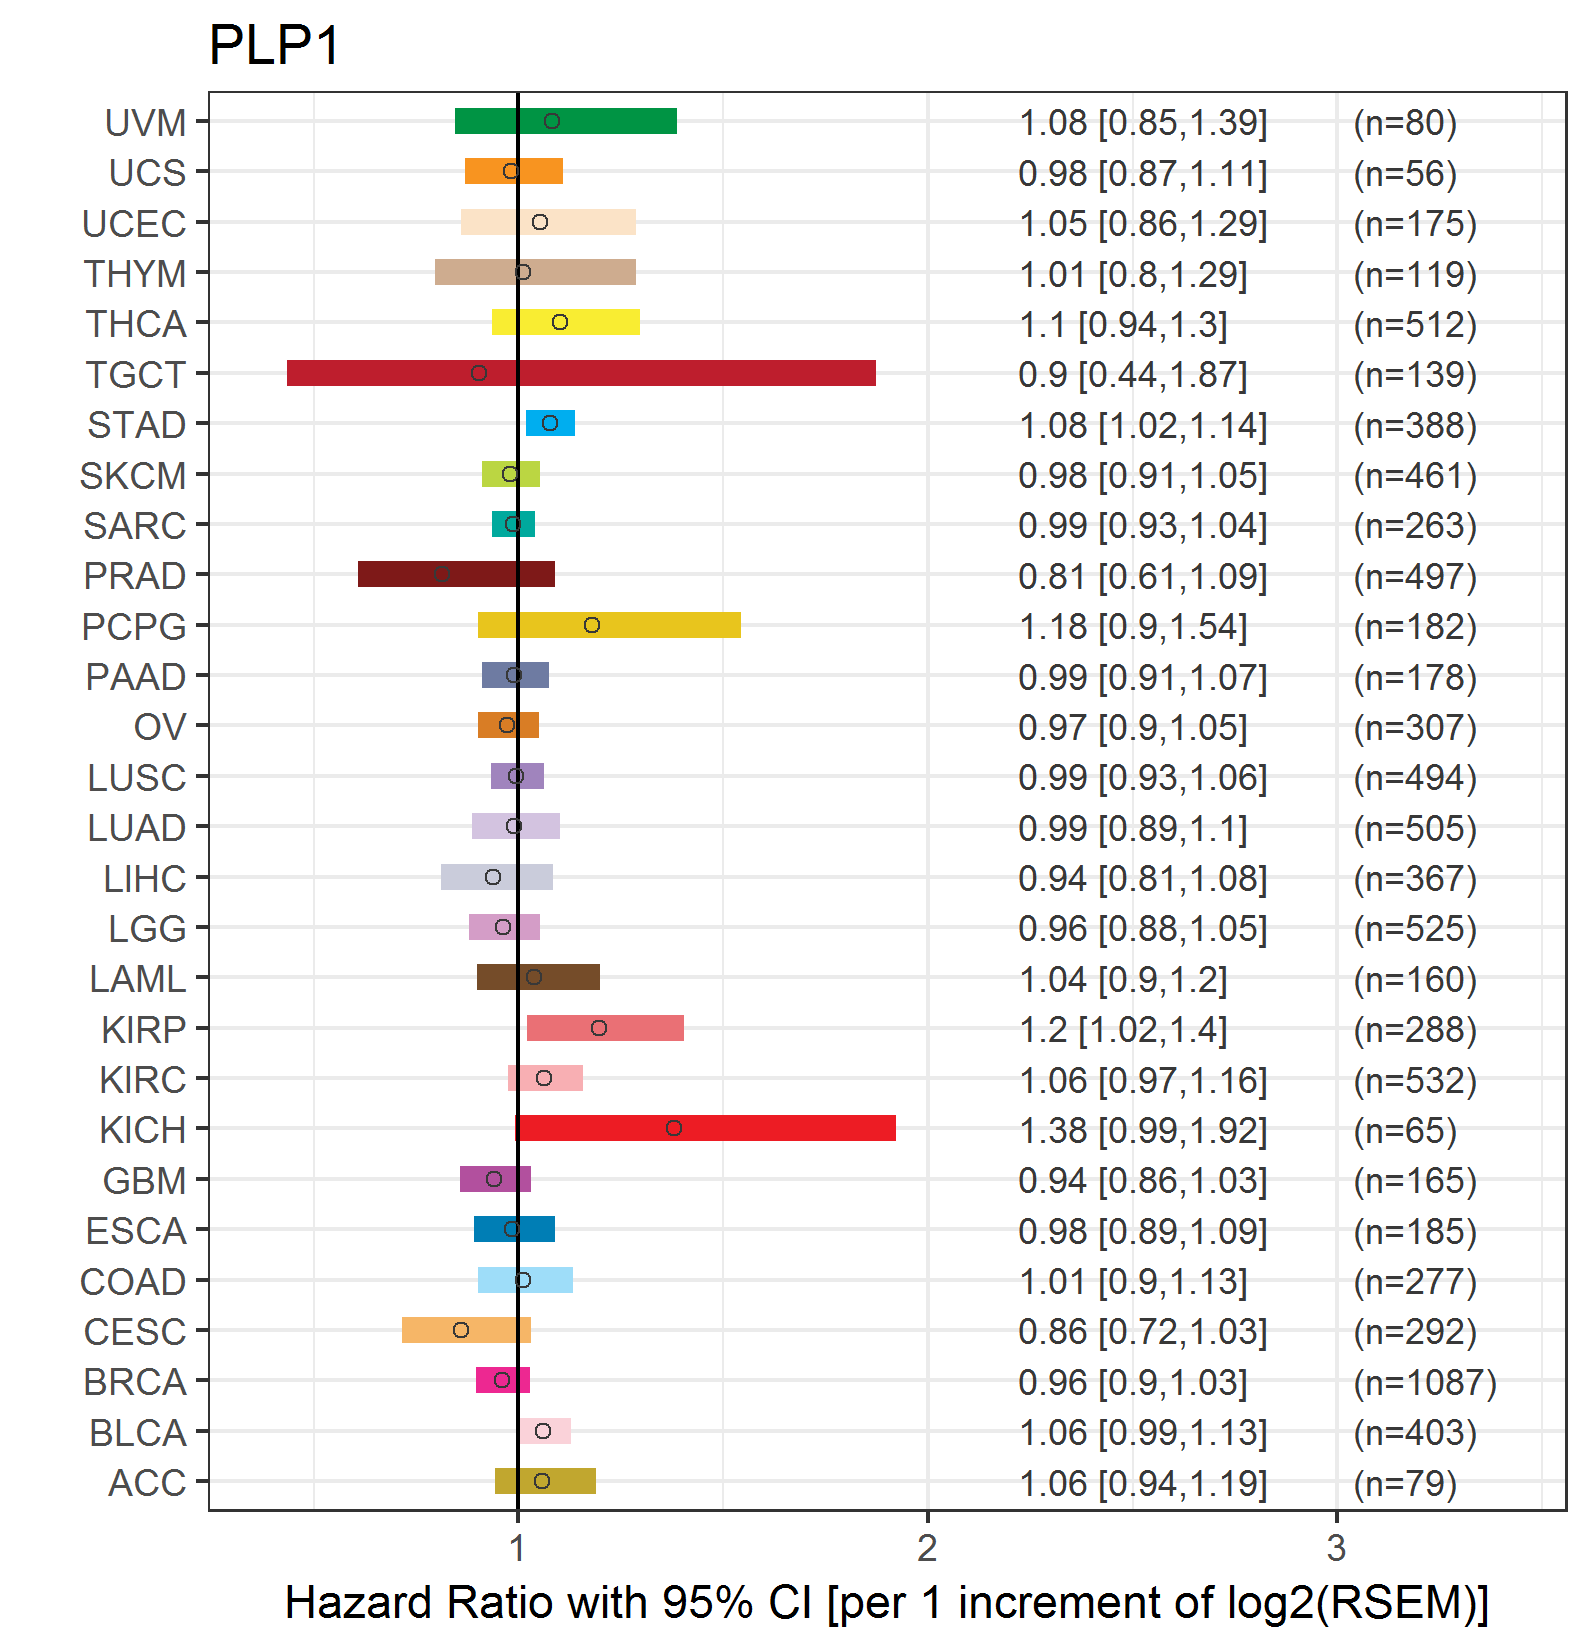
| Forest plot of Cox proportional hazard ratio (HR) and 95% CI of overall survival (OS) using 28 cancer types (TCGA IlluminaHiSeq_RNASeqV2, pan-cancer normalized log2(norm_counts+1) data, version 2016-08-16) (TCGA clinicalMatrix, phenotype data, version 2016-04-27) * Click on the image enlarge it in a new window. |
 |
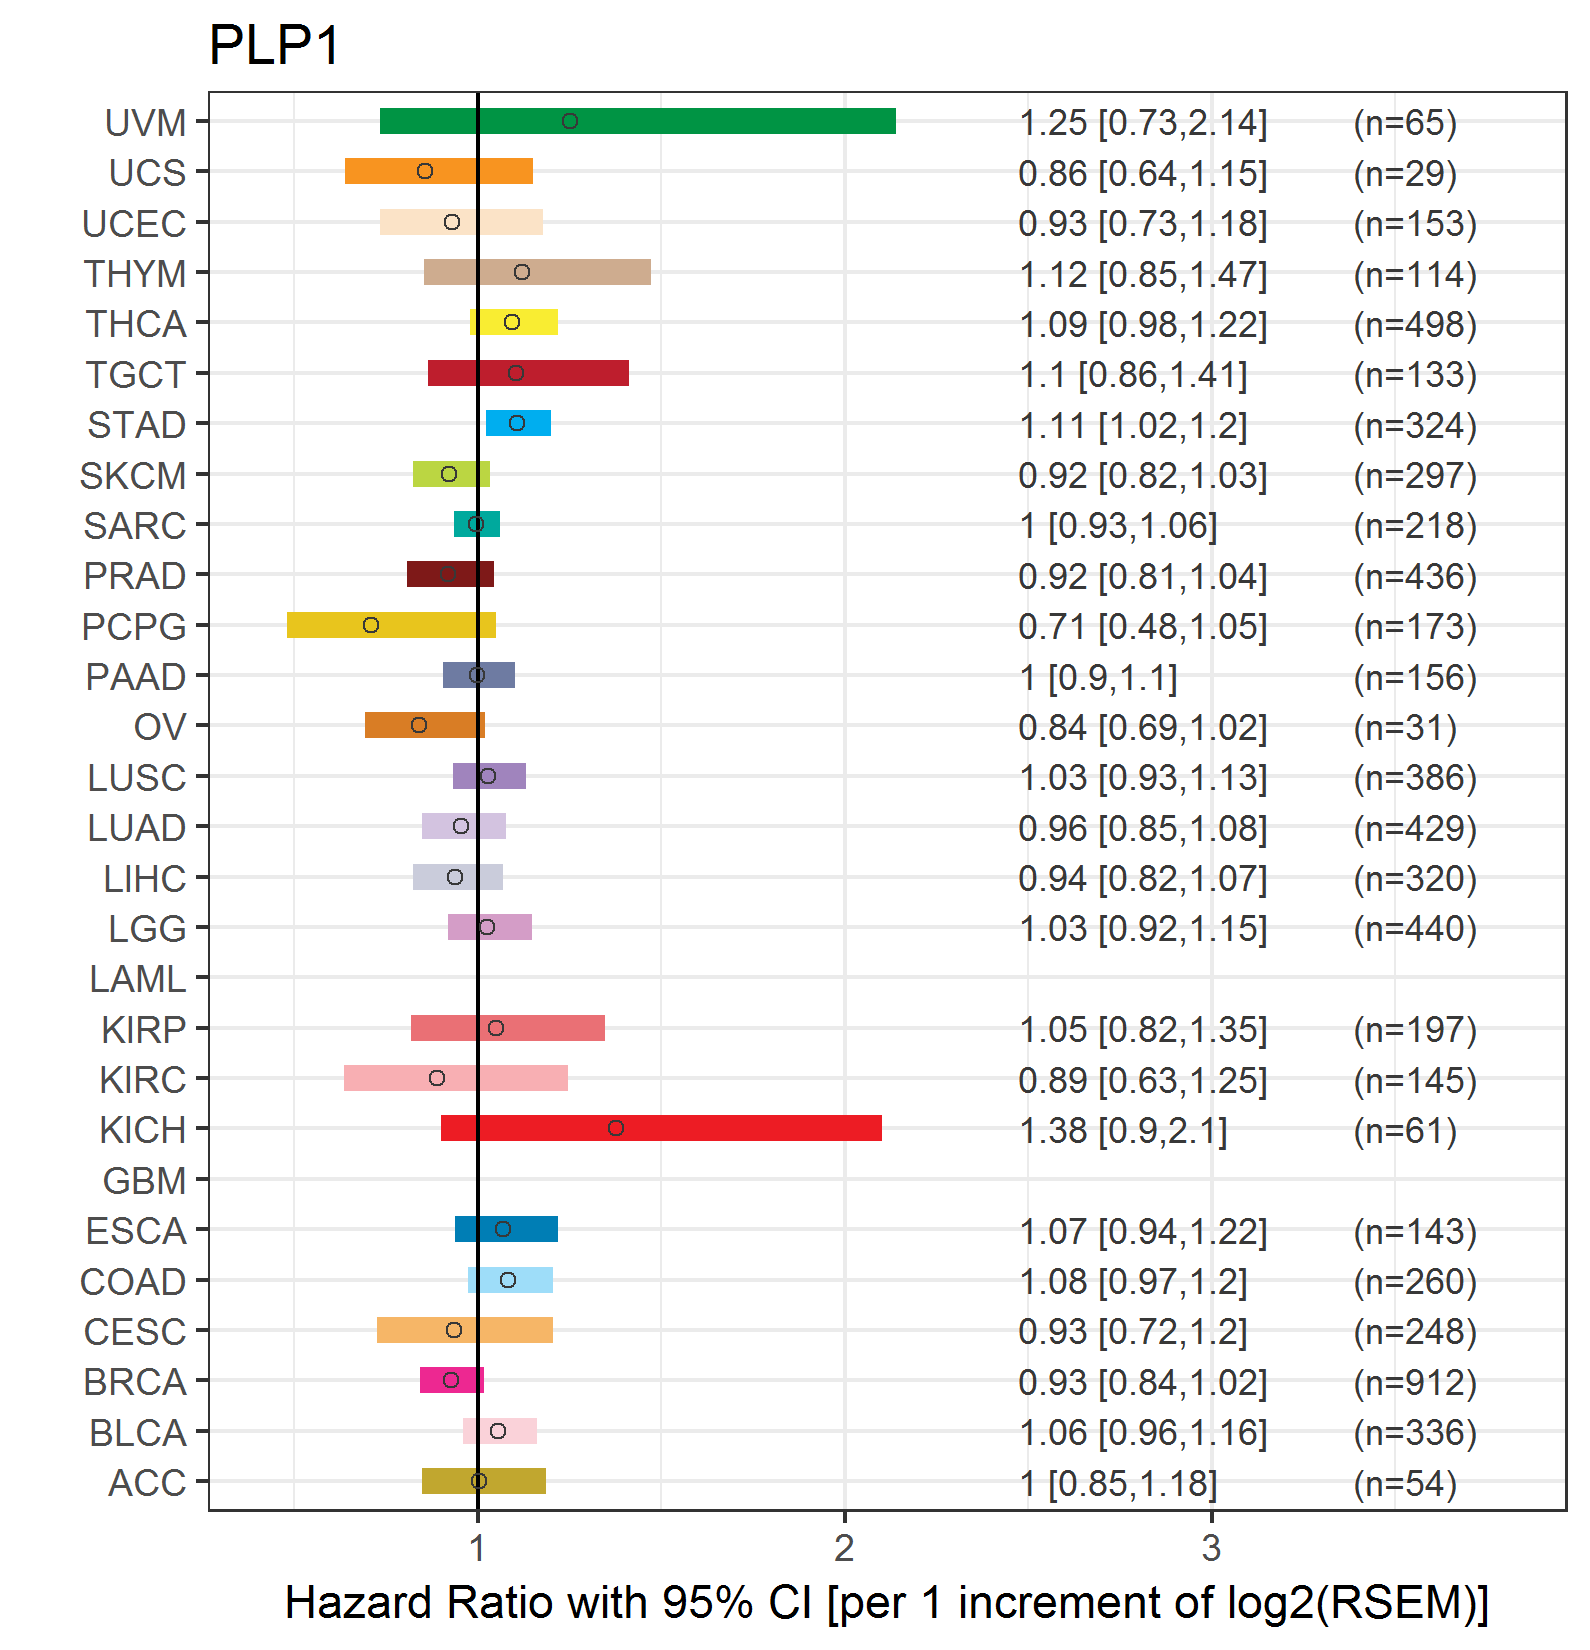
| Forest plot of Cox proportional hazard ratio (HR) and 95% CI of relapse free survival (RFS) using 28 cancer types (TCGA IlluminaHiSeq_RNASeqV2, pan-cancer normalized log2(norm_counts+1) data, version 2016-08-16) (TCGA clinicalMatrix, phenotype data, version 2016-04-27) * Click on the image enlarge it in a new window. |
 |
| Top |
| TissGeneClin for PLP1 |
| TissGeneDrug for PLP1 |
| Drug information targeting TissGene (DrugBank Version 5.0.6, 2017-04-01) |
| DrugBank ID | Drug name | Drug activity | Drug type | Drug status |
| Top |
| TissGeneDisease for PLP1 |
| Disease information associated with TissGene (DisGeNet, 2016-06-01) |
| Disease ID | Disease name | # pubmeds | Source |
| umls:C0205711 | Pelizaeus-Merzbacher Disease | 147 | BeFree,CLINVAR,CTD_human,LHGDN,MGD,UNIPROT |
| umls:C0751604 | Hereditary X-Linked Recessive Spastic Paraplegia | 22 | BeFree |
| umls:C0023520 | Leukodystrophy | 13 | BeFree,GAD |
| umls:C1839264 | SPASTIC PARAPLEGIA 2, X-LINKED (disorder) | 10 | CLINVAR,CTD_human,MGD,ORPHANET,UNIPROT |
| umls:C0037772 | Spastic Paraplegia | 7 | BeFree |
| umls:C0014072 | Experimental Autoimmune Encephalomyelitis | 6 | BeFree |
| umls:C0036341 | Schizophrenia | 5 | BeFree,LHGDN |
| umls:C0028738 | Nystagmus | 4 | BeFree |
| umls:C0026769 | Multiple Sclerosis | 3 | BeFree |
| umls:C0026838 | Muscle Spasticity | 3 | BeFree |
| umls:C0027765 | nervous system disorder | 3 | BeFree |
| umls:C0036572 | Seizures | 3 | BeFree,RGD |
| umls:C0037773 | Spastic Paraplegia, Hereditary | 3 | BeFree |
| umls:C0524851 | Neurodegenerative Disorders | 3 | BeFree |
| umls:C0007682 | CNS disorder | 2 | BeFree |
| umls:C0007789 | Cerebral Palsy | 2 | BeFree,LHGDN |
| umls:C0026827 | Muscle hypotonia | 2 | BeFree |
| umls:C0030486 | Paraplegia | 2 | LHGDN |
| umls:C0031117 | Peripheral Neuropathy | 2 | BeFree |
| umls:C0037771 | Paraparesis, Spastic | 2 | BeFree |
| umls:C0235946 | Cerebral atrophy | 2 | BeFree |
| umls:C0424605 | Developmental delay (disorder) | 2 | BeFree |
| umls:C0443306 | Spastic | 2 | BeFree |
| umls:C1269683 | Major Depressive Disorder | 2 | BeFree |
| umls:C0004114 | Astrocytoma | 1 | BeFree |
| umls:C0004352 | Autistic Disorder | 1 | BeFree |
| umls:C0009171 | Cocaine Abuse | 1 | BeFree |
| umls:C0011265 | Presenile dementia | 1 | BeFree |
| umls:C0011303 | Demyelinating Diseases | 1 | BeFree |
| umls:C0020630 | Hypophosphatasia | 1 | BeFree |
| umls:C0021368 | Inflammation | 1 | LHGDN |
| umls:C0022661 | Kidney Failure, Chronic | 1 | BeFree |
| umls:C0033626 | Protein Deficiency | 1 | BeFree |
| umls:C0034152 | Henoch-Schoenlein Purpura | 1 | BeFree |
| umls:C0034372 | Quadriplegia | 1 | LHGDN |
| umls:C0037019 | Shy-Drager Syndrome | 1 | BeFree |
| umls:C0041696 | Unipolar Depression | 1 | BeFree |
| umls:C0085078 | Lysosomal Storage Diseases | 1 | BeFree |
| umls:C0221026 | X-linked agammaglobulinemia | 1 | BeFree |
| umls:C0268164 | Primary hyperoxaluria, type I | 1 | BeFree |
| umls:C0270921 | Axonal neuropathy | 1 | BeFree |
| umls:C0270922 | Peripheral demyelinating neuropathy | 1 | BeFree |
| umls:C0271388 | Pendular Nystagmus | 1 | BeFree |
| umls:C0393571 | Multiple System Atrophy | 1 | BeFree |
| umls:C0393665 | Multiple Sclerosis, Chronic Progressive | 1 | LHGDN |
| umls:C0442874 | Neuropathy | 1 | BeFree |
| umls:C0497327 | Dementia | 1 | BeFree |
| umls:C0598608 | Hyperhomocysteinemia | 1 | BeFree |
| umls:C0751964 | Multiple Sclerosis, Primary Progressive | 1 | BeFree |
| umls:C0751967 | Multiple Sclerosis, Relapsing-Remitting | 1 | BeFree |
| umls:C1263857 | Peripheral axonal neuropathy | 1 | BeFree |
| umls:C1274795 | Urban Schosser Spohn syndrome | 1 | BeFree |
| umls:C1709246 | Non-Neoplastic Disorder | 1 | BeFree |
| umls:C1846058 | Lubs X-linked mental retardation syndrome | 1 | BeFree |
| umls:C1849156 | Spastic Ataxia | 1 | BeFree |
| umls:C2316810 | Chronic kidney disease stage 5 | 1 | BeFree |
| umls:C3495426 | Homocysteinemia | 1 | BeFree |
| umls:C3711376 | Isodicentric Chromosome 15 Syndrome | 1 | BeFree |
| umls:C0751915 | Pelizaeus-Merzbacher Disease, Atypical | 0 | CLINVAR |
| umls:C0751916 | Classic Pelizaeus-Merzbacher Disease | 0 | ORPHANET |
| umls:C0751917 | Pelizaeus-Merzbacher Disease, Transitional | 0 | ORPHANET |
|
Copyright 2016-Present - The University of Texas Health Science Center at Houston (UTHealth) Web File Viewing | How to Report, Fraud, Waste and Abuse | State of Texas | Statewide Search | Texas Homeland Security | Site Policies |