 |
| |
| |
| |
| |
| |
| |
|

| TissGeneSummary for UNC93A |
 Gene summary Gene summary |
| Basic gene information | Gene symbol | UNC93A |
| Gene name | unc-93 homolog A (C. elegans) | |
| Synonyms | Unc-93A|dJ366N23.1|dJ366N23.2 | |
| Cytomap | UCSC genome browser: 6q27 | |
| Type of gene | protein-coding | |
| RefGenes | NM_001143947.1, NM_018974.3, | |
| Description | dJ366N23.1 (putative C. elegans UNC-93 (protein 1, C46F11.1) LIKE)dJ366N23.2 (putative C. elegans UNC-93 (protein 1, C46F11.1) C-terminal LIKE)protein unc-93 homolog Aunc93 homolog A | |
| Modification date | 20141207 | |
| dbXrefs | MIM : 607995 | |
| HGNC : HGNC | ||
| Ensembl : ENSG00000112494 | ||
| HPRD : 12148 | ||
| Vega : OTTHUMG00000016021 | ||
| Protein | UniProt: go to UniProt's Cross Reference DB Table | |
| Expression | CleanEX: HS_UNC93A | |
| BioGPS: 54346 | ||
| Pathway | NCI Pathway Interaction Database: UNC93A | |
| KEGG: UNC93A | ||
| REACTOME: UNC93A | ||
| Pathway Commons: UNC93A | ||
| Context | iHOP: UNC93A | |
| ligand binding site mutation search in PubMed: UNC93A | ||
| UCL Cancer Institute: UNC93A | ||
| Assigned class in TissGDB* | C | |
| Included tissue-specific gene expression resources | TiGER,GTEx | |
| Specific-tissues in normal samples (assigned by TissGDB using HPA, TiGER, and GTEx) | SkinStomach | |
| Cancer types related to the specific-tissues in cancer samples (assigned by TissGDB using TCGA) | SKCMSTAD | |
| Reference showing the relevant tissue of UNC93A | ||
| Description by TissGene annotations | ||
| * Class A consists of genes with literature evidence and is part of the cTissGenes. Class B consists of only cTissGenes without additional evidence. The remaining genes belong to Class C. |
| Gene ontology having evidence of Inferred from Direct Assay (IDA) from Entrez |
| GO ID | GO term | PubMed ID |
| Top |
| TissGeneExp for UNC93A |
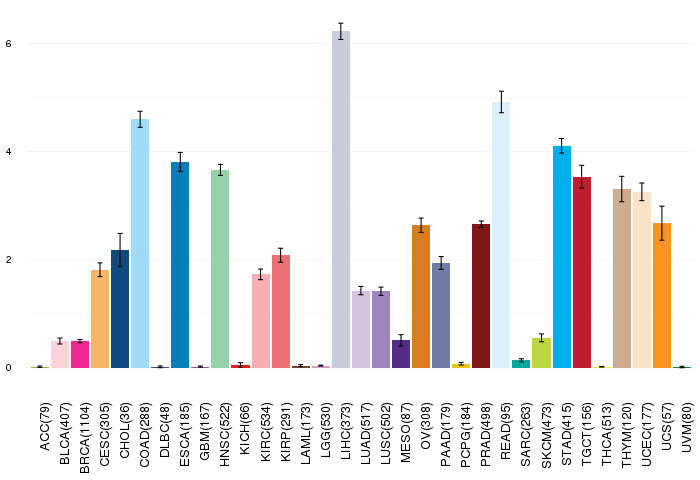
| Gene expressions across 28 cancer types (X-axis: cancer type and Y-axis: log2(norm_counts+1)) (TCGA IlluminaHiSeq_RNASeqV2, pan-cancer normalized log2(norm_counts+1) data, version 2016-08-16) |
 |
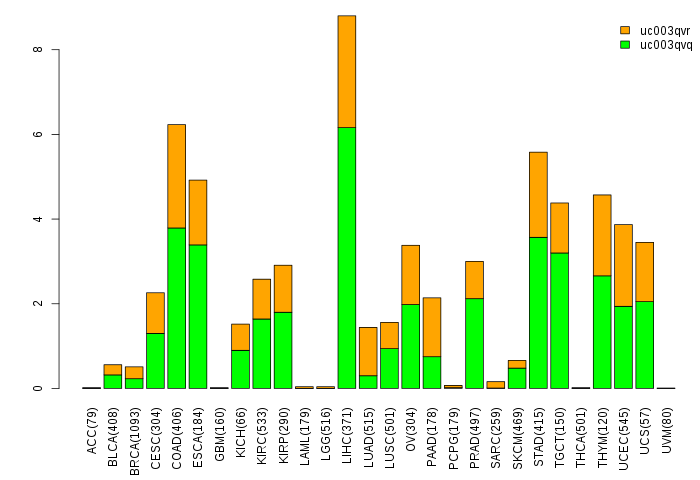
| Gene isoform expressions across 28 cancer types (X-axis: cancer type and Y-axis: log2(norm_counts+1)) (TCGA pan-cancer tcga_rsem_isoform_tpm, version 2016-09-01) |
 |
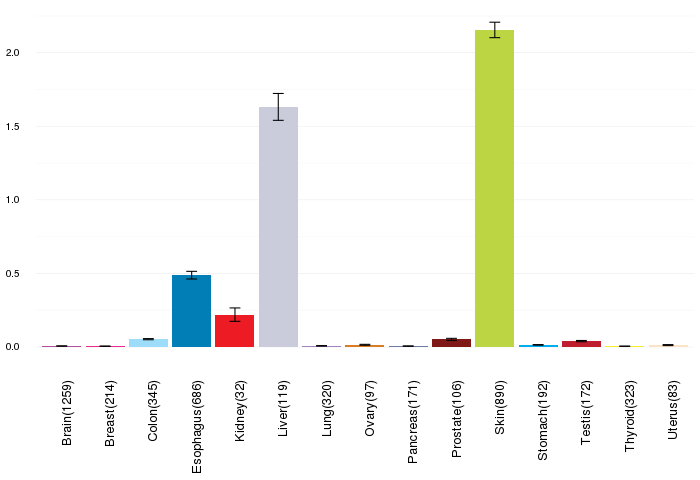
| Gene expressions across normal tissues of GTEx data (GTEx GTEx_Analysis_v6_RNA-seq_RNA-SeQCv1.1.8_gene_rpkm.gct) - Here, we shows the matched tissue types only among our 28 cancer types. |
 |
| Different expressions across 14 cancer types with more than 10 samples between matched tumors and normals (X-axis: cancer type and Y-axis: log2(norm_counts+1)) (TCGA IlluminaHiSeq_RNASeqV2, pan-cancer normalized log2(norm_counts+1) data, version 2016-08-16) |
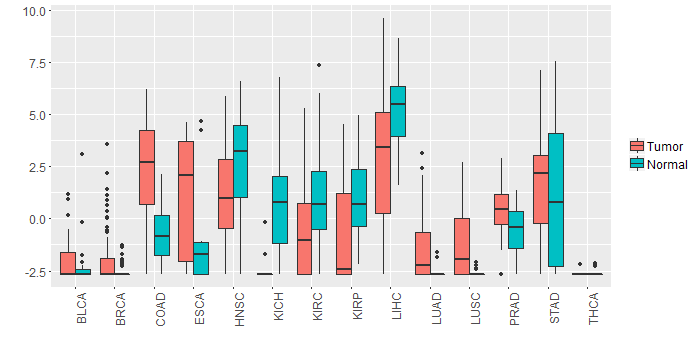 |
| - Significantly differentially expressed cancer types and information. (|Fold change|>1 and FDR<0.05) |
| Cancer type | Mean(exp) in tumor | Mean(exp) in matched normal | Log2FC | P-val. | FDR |
| LUSC | -1.188449254 | -2.611810038 | 1.423360784 | 3.54E-07 | 9.32E-07 |
| LIHC | 3.015422197 | 5.283842197 | -2.26842 | 2.31E-05 | 8.94E-05 |
| COAD | 2.379551274 | -0.824356418 | 3.203907692 | 5.39E-07 | 3.21E-06 |
| LUAD | -1.503818354 | -2.62531663 | 1.121498276 | 8.28E-07 | 2.81E-06 |
| KICH | -2.521001803 | 0.929278197 | -3.45028 | 2.44E-08 | 1.23E-07 |
| HNSC | 1.12956657 | 2.555373546 | -1.425806977 | 0.00418 | 0.011554054 |
| KIRP | -0.648887428 | 0.978584447 | -1.627471875 | 0.00297 | 0.007349603 |
| KIRC | -0.366520414 | 0.98590042 | -1.352420833 | 0.000457 | 0.000894443 |
| Top |
| TissGene-miRNA for UNC93A |
| Significantly anti-correlated miRNAs of TissGene across 28 cancer types (Gene-miRNA relations from TargetScanHuman Relsease 7.1, Conserved_Site_Context_Scores.txt.zip, 06.01.2016) (TCGA IlluminaHiSeq_miRNASeq, log2(RPM+1) data, version 2016-11-21) (TCGA IlluminaHiSeq_RNASeqV2, log2(normalized_count+1) data, version 2016-08-16) (Spearman’s Rank Correlation (p-value<0.05 and coefficient<-0.25)) |
| Cancer type | miRNA id | miRNA accession | P-val. | Coeff. | # samples |
| Top |
| TissGeneMut for UNC93A |
| TissGeneSNV for UNC93A |
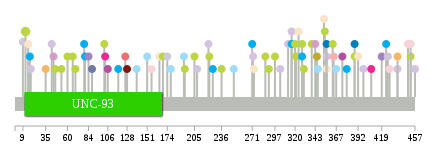
| nsSNV counts per each loci. Different colors of circles represent different cancer types. Circle size denotes number of samples. (TCGA somatic mutation (SNPs and small INDELs) data, version 2016-04-25) * Click on the image to enlarge it in a new window. |
 |
 |
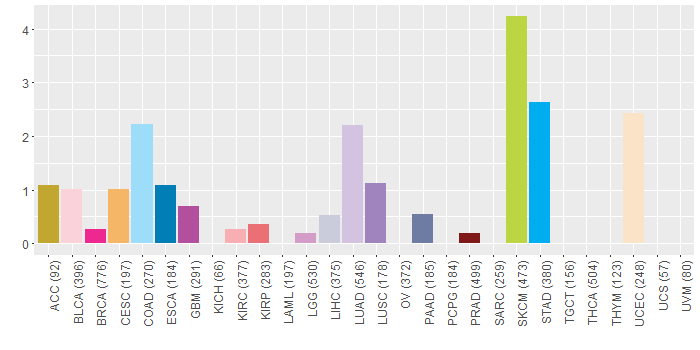
| Somatic nucleotide variants of TissGene across 28 cancer types (X-axis: cancer type and Y-axis: % of mutated samples) The numbers in parentheses are numbers of samples with mutation (nsSNVs). (TCGA somatic mutation (SNPs and small INDELs) data, version 2016-04-25) |
 |
| - nsSNVs sorted by frequency. |
| AAchange | Cancer type | # samples |
| p.S12F | SKCM | 2 |
| p.I437M | LUAD | 1 |
| p.E452Q | BLCA | 1 |
| p.L297R | SKCM | 1 |
| p.G139D | COAD | 1 |
| p.V321I | SKCM | 1 |
| p.G69R | SKCM | 1 |
| p.K128M | PRAD | 1 |
| p.K312* | LUAD | 1 |
| p.L339R | SKCM | 1 |
| p.V374I | GBM | 1 |
| p.F273L | UCEC | 1 |
| p.F353L | UCEC | 1 |
| p.P106L | GBM | 1 |
| p.A178V | COAD | 1 |
| p.V431M | HNSC | 1 |
| p.E193D | COAD | 1 |
| p.L356M | LUAD | 1 |
| p.S354F | SKCM | 1 |
| p.R388C | ESCA | 1 |
| p.L174P | LIHC | 1 |
| p.E452K | SKCM | 1 |
| p.W151X | COAD | 1 |
| p.A126V | KIRP | 1 |
| p.V328M | SKCM | 1 |
| p.F15V | UCEC | 1 |
| p.Q290* | SKCM | 1 |
| p.V363I | SKCM | 1 |
| p.V328M | STAD | 1 |
| p.A392V | UCEC | 1 |
| p.E35K | CESC | 1 |
| p.G205S | SKCM | 1 |
| p.K194N | SKCM | 1 |
| p.W364R | KIRC | 1 |
| p.H330Y | SKCM | 1 |
| p.S44I | LGG | 1 |
| p.L18F | LUAD | 1 |
| p.T208N | LUAD | 1 |
| p.A320T | SKCM | 1 |
| p.T118M | STAD | 1 |
| p.G426V | LUAD | 1 |
| p.R343H | LGG | 1 |
| p.A424V | STAD | 1 |
| p.S53F | SKCM | 1 |
| p.V407M | BRCA | 1 |
| p.L356M | ESCA | 1 |
| p.S379N | STAD | 1 |
| p.V286M | SKCM | 1 |
| p.A398P | LUAD | 1 |
| p.G272V | LUAD | 1 |
| p.M457L | LUAD | 1 |
| p.S156L | BLCA | 1 |
| p.G66S | SKCM | 1 |
| p.Y316H | STAD | 1 |
| p.L9P | LIHC | 1 |
| p.M217V | CHOL | 1 |
| p.D345Y | ACC | 1 |
| p.L17F | STAD | 1 |
| p.L46F | SKCM | 1 |
| p.L60F | SKCM | 1 |
| p.V428L | BLCA | 1 |
| p.A80V | STAD | 1 |
| p.S165N | UCEC | 1 |
| p.F221L | LUAD | 1 |
| p.V324M | UCEC | 1 |
| p.Q271H | STAD | 1 |
| p.G69W | HNSC | 1 |
| p.S419N | LUSC | 1 |
| p.L169F | SKCM | 1 |
| p.R346H | COAD | 1 |
| p.I437M | CESC | 1 |
| p.K68R | HNSC | 1 |
| p.Y316* | LUAD | 1 |
| p.R226X | STAD | 1 |
| p.R343C | HNSC | 1 |
| p.V79M | STAD | 1 |
| p.E449D | BLCA | 1 |
| p.D303E | LUAD | 1 |
| p.A88T | PAAD | 1 |
| p.L222F | SKCM | 1 |
| p.K236N | SKCM | 1 |
| p.G84C | LUSC | 1 |
| p.R388C | SKCM | 1 |
| p.L356M | UCEC | 1 |
| p.L102P | SKCM | 1 |
| p.G103R | BRCA | 1 |
| p.A42E | LUAD | 1 |
| p.V367I | COAD | 1 |
| p.V250I | COAD | 1 |
| Top |
| TissGeneCNV for UNC93A |
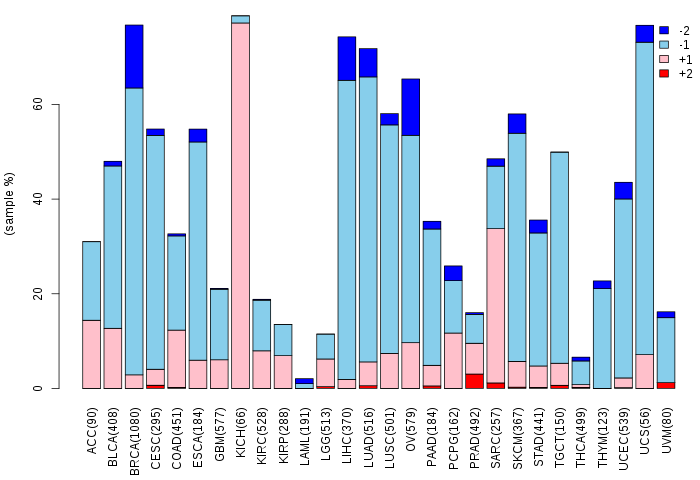
| Copy number variations of TissGene across 28 cancer types (X-axis: cancer type and Y-axis: % of CNV samples) (TCGA Gistic2_CopyNumber_Gistic2_all_data_by_genes, Gistic2 copy number data, version 2016-08-16) |
 |
| Top |
| TissGeneFusions for UNC93A |
| Fusion genes including TissGene (ChimerDB 3.0, 2016-12-01 and TCGA fusion Portal 2015-12-01) |
| Database | Src | Cancer type | Sample | Fusion gene | ORF | 5'-gene BP | 3'-gene BP |
| TCGAfusionPortal | PRADA | OV | TCGA-13-1408-01A | MLLT4-UNC93A | Out-of-frame | Chr6:168227917 | Chr6:167717407 |
| Top |
| TissGeneNet for UNC93A |
| Co-expressed gene networks based on protein-protein interaction data (CePIN) (TCGA IlluminaHiSeq_RNASeqV2, pan-cancer normalized log2(norm_counts+1) data, version 2016-08-16) (PINA2 ppi data) |
| Top |
| TissGeneProg for UNC93A |
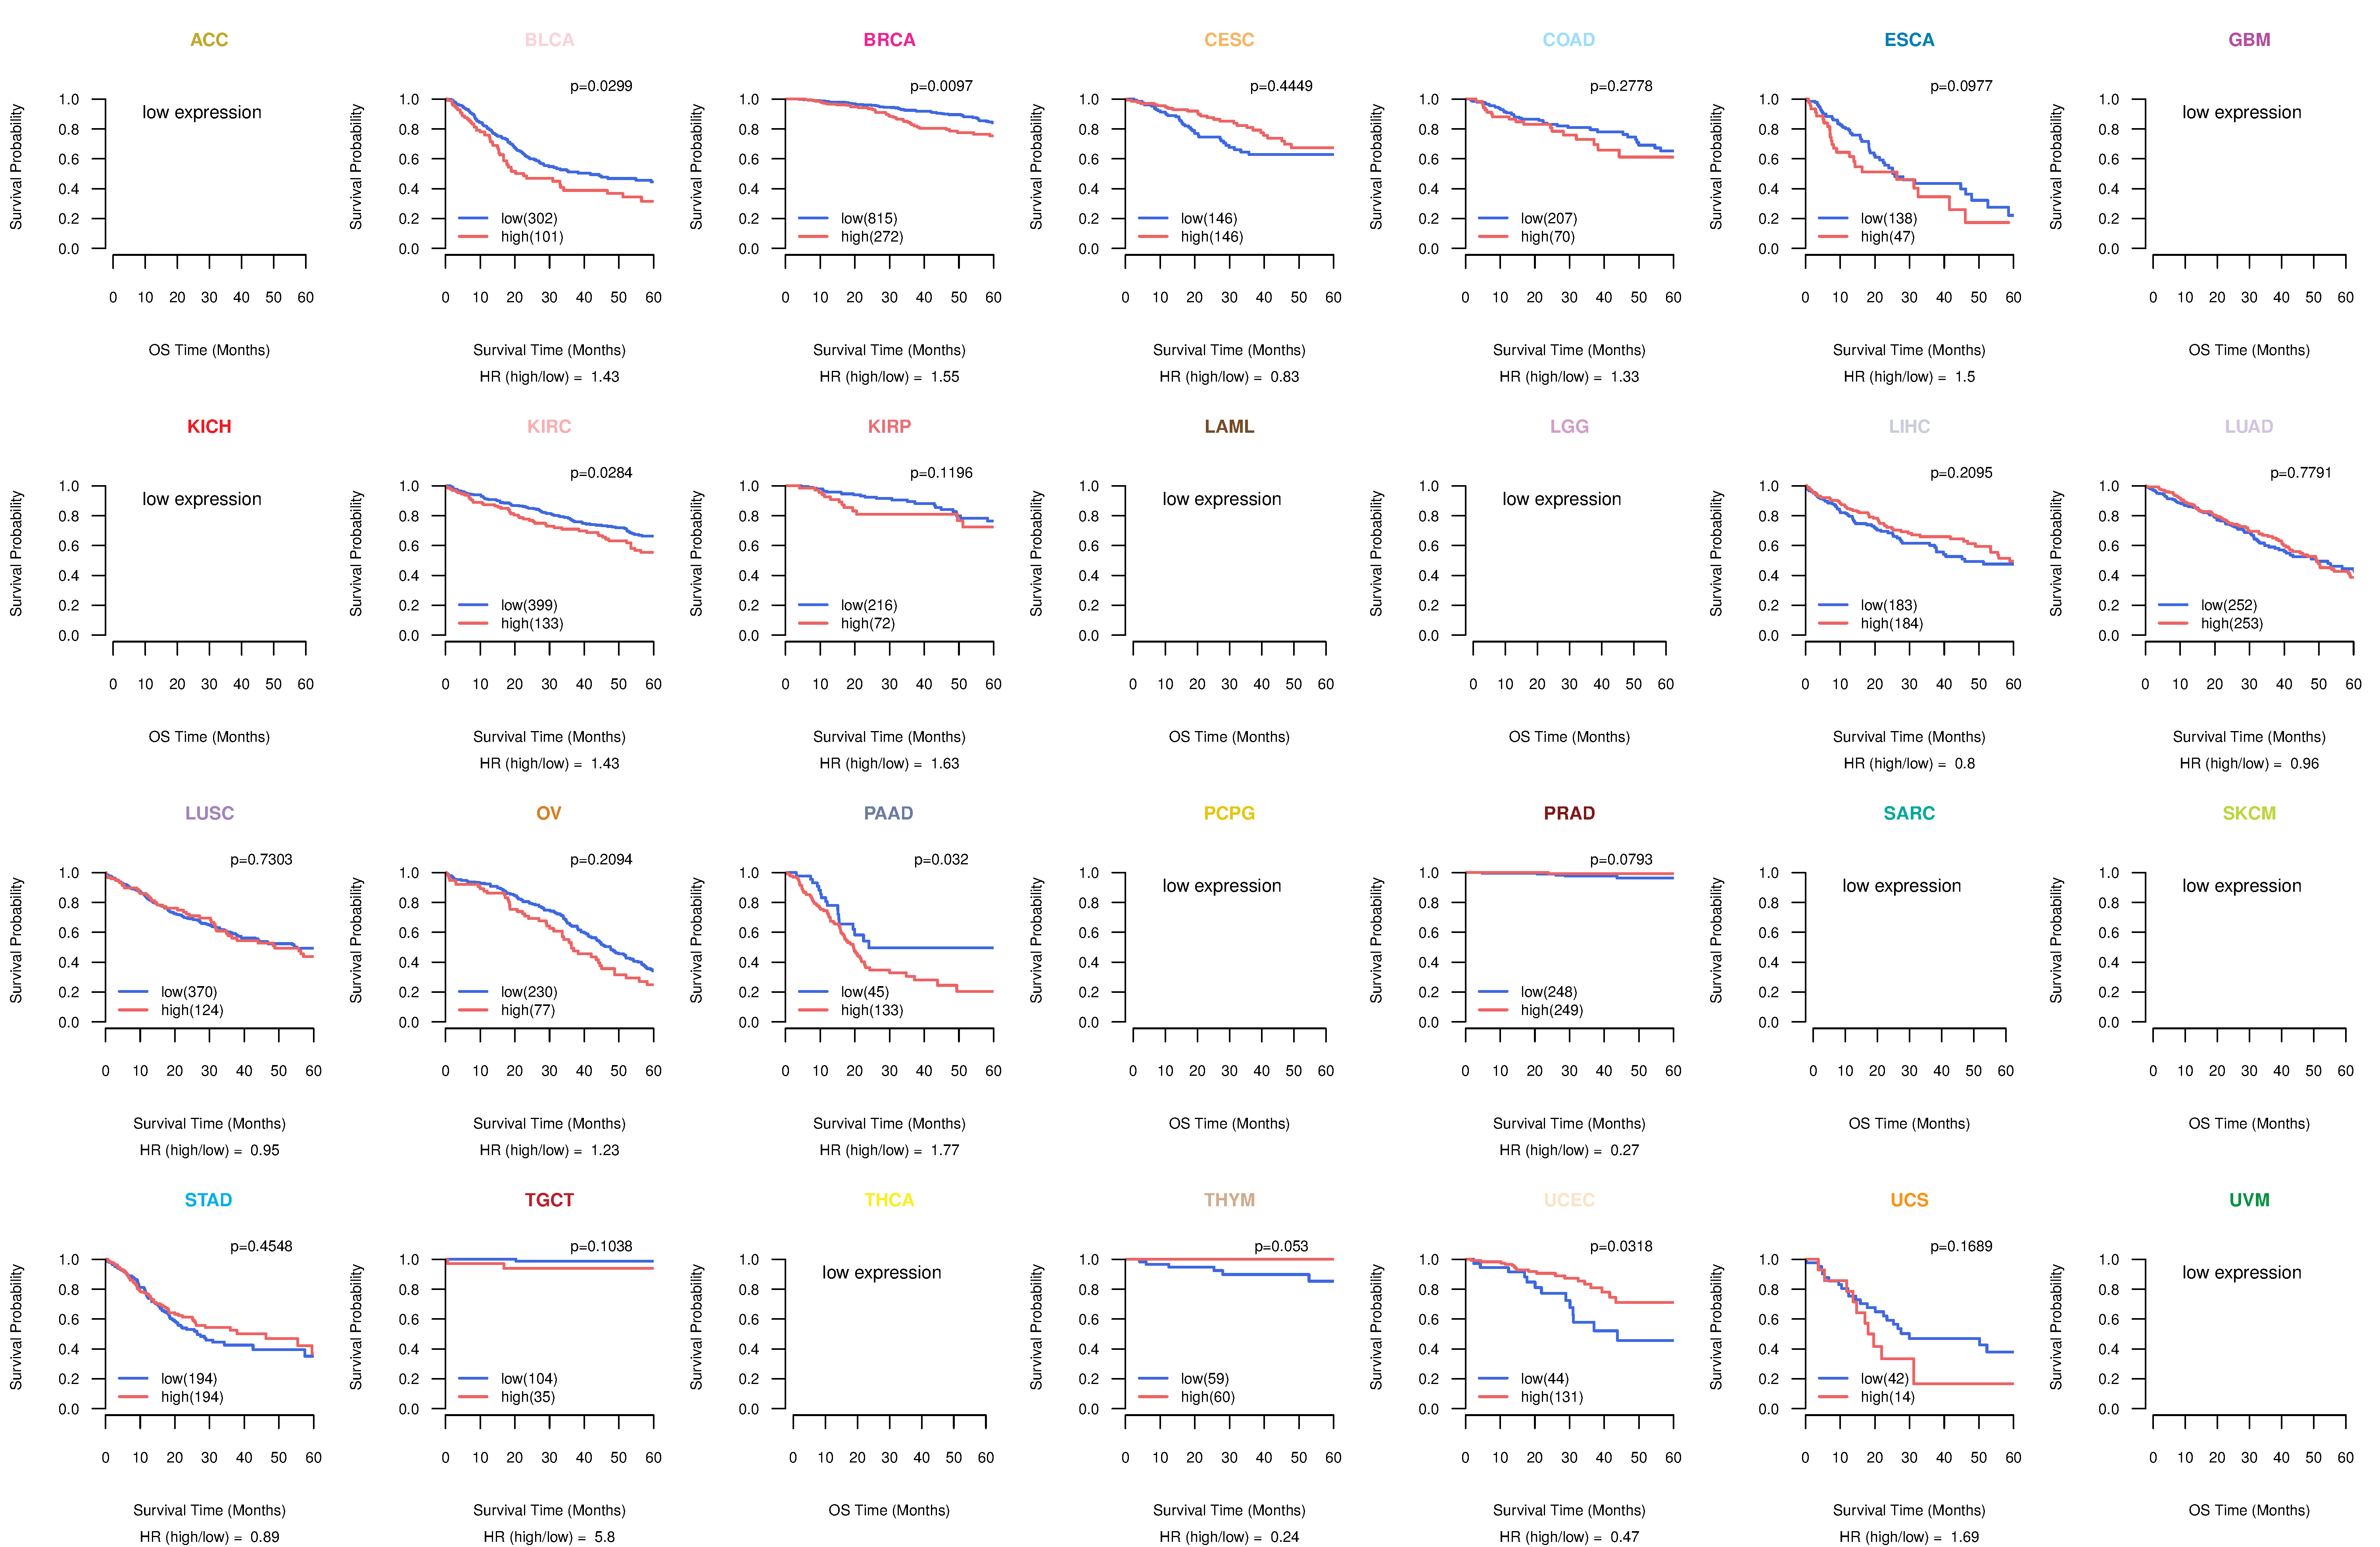
| Kaplan-Meier plots with logrank tests of overall survival (OS) using 28 cancer types (TCGA IlluminaHiSeq_RNASeqV2, pan-cancer normalized log2(norm_counts+1) data, version 2016-08-16) (TCGA clinicalMatrix, phenotype data, version 2016-04-27) * Click on the image to enlarge it in a new window. |
 |
| Kaplan-Meier plots with logrank test of relapse free survival (RFS) using 28 cancer types (TCGA IlluminaHiSeq_RNASeqV2, pan-cancer normalized log2(norm_counts+1) data, version 2016-08-16) (TCGA clinicalMatrix, phenotype data, version 2016-04-27) * Click on the image enlarge it in a new window. |
 |
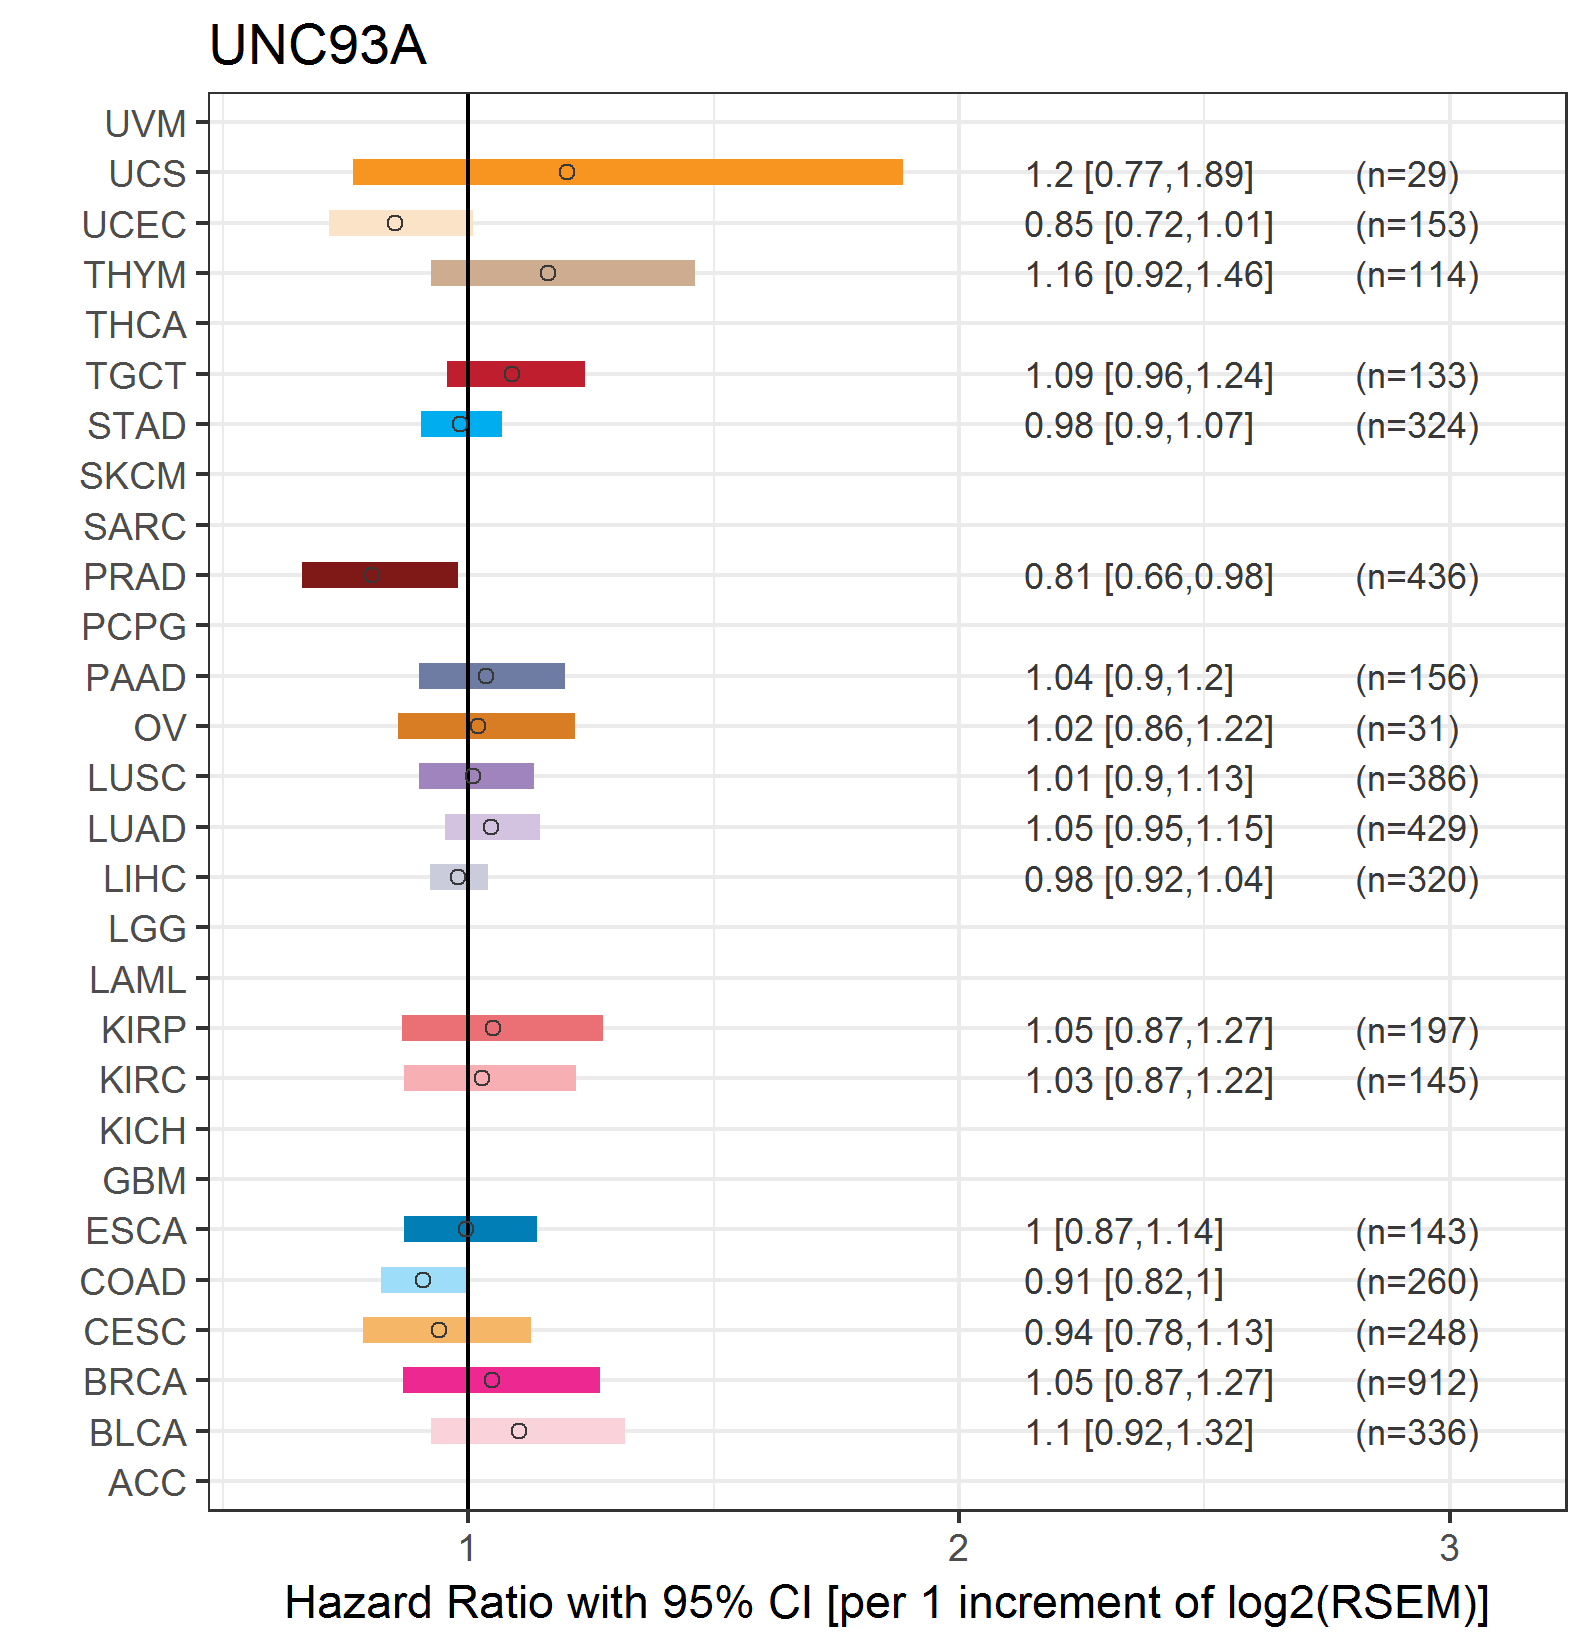
| Forest plot of Cox proportional hazard ratio (HR) and 95% CI of overall survival (OS) using 28 cancer types (TCGA IlluminaHiSeq_RNASeqV2, pan-cancer normalized log2(norm_counts+1) data, version 2016-08-16) (TCGA clinicalMatrix, phenotype data, version 2016-04-27) * Click on the image enlarge it in a new window. |
 |
| Forest plot of Cox proportional hazard ratio (HR) and 95% CI of relapse free survival (RFS) using 28 cancer types (TCGA IlluminaHiSeq_RNASeqV2, pan-cancer normalized log2(norm_counts+1) data, version 2016-08-16) (TCGA clinicalMatrix, phenotype data, version 2016-04-27) * Click on the image enlarge it in a new window. |
 |
| Top |
| TissGeneClin for UNC93A |
| TissGeneDrug for UNC93A |
| Drug information targeting TissGene (DrugBank Version 5.0.6, 2017-04-01) |
| DrugBank ID | Drug name | Drug activity | Drug type | Drug status |
| Top |
| TissGeneDisease for UNC93A |
| Disease information associated with TissGene (DisGeNet, 2016-06-01) |
| Disease ID | Disease name | # pubmeds | Source |
| umls:C0919267 | ovarian neoplasm | 1 | LHGDN |
|
Copyright 2016-Present - The University of Texas Health Science Center at Houston (UTHealth) Web File Viewing | How to Report, Fraud, Waste and Abuse | State of Texas | Statewide Search | Texas Homeland Security | Site Policies |