 |
| |
| |
| |
| |
| |
| |
|

| TissGeneSummary for MOV10L1 |
 Gene summary Gene summary |
| Basic gene information | Gene symbol | MOV10L1 |
| Gene name | Mov10 RISC complex RNA helicase like 1 | |
| Synonyms | CHAMP|DJ402G11.8 | |
| Cytomap | UCSC genome browser: 22q13.33 | |
| Type of gene | protein-coding | |
| RefGenes | NM_001164104.1, NM_001164105.1,NM_001164106.1,NM_018995.2, | |
| Description | MOV10-like protein 1Mov10-like 1Mov10l1, Moloney leukemia virus 10-like 1, homologcardiac helicase activated by MEF2C proteinmoloney leukemia virus 10-like protein 1putative helicase Mov10l1 | |
| Modification date | 20141215 | |
| dbXrefs | MIM : 605794 | |
| HGNC : HGNC | ||
| Ensembl : ENSG00000073146 | ||
| HPRD : 16158 | ||
| Vega : OTTHUMG00000044648 | ||
| Protein | UniProt: go to UniProt's Cross Reference DB Table | |
| Expression | CleanEX: HS_MOV10L1 | |
| BioGPS: 54456 | ||
| Pathway | NCI Pathway Interaction Database: MOV10L1 | |
| KEGG: MOV10L1 | ||
| REACTOME: MOV10L1 | ||
| Pathway Commons: MOV10L1 | ||
| Context | iHOP: MOV10L1 | |
| ligand binding site mutation search in PubMed: MOV10L1 | ||
| UCL Cancer Institute: MOV10L1 | ||
| Assigned class in TissGDB* | B | |
| Included tissue-specific gene expression resources | ||
| Specific-tissues in normal samples (assigned by TissGDB using HPA, TiGER, and GTEx) | Testis | |
| Cancer types related to the specific-tissues in cancer samples (assigned by TissGDB using TCGA) | TGCT | |
| Reference showing the relevant tissue of MOV10L1 | ||
| Description by TissGene annotations | Fused withOncogene Fused withTSGene | |
| * Class A consists of genes with literature evidence and is part of the cTissGenes. Class B consists of only cTissGenes without additional evidence. The remaining genes belong to Class C. |
| Gene ontology having evidence of Inferred from Direct Assay (IDA) from Entrez |
| GO ID | GO term | PubMed ID |
| Top |
| TissGeneExp for MOV10L1 |
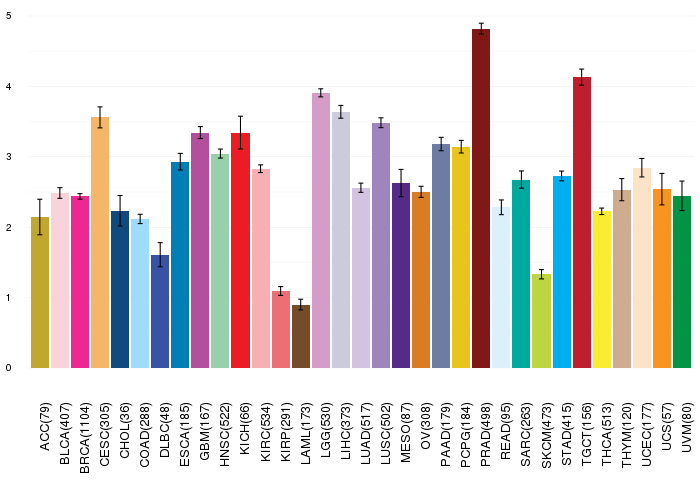
| Gene expressions across 28 cancer types (X-axis: cancer type and Y-axis: log2(norm_counts+1)) (TCGA IlluminaHiSeq_RNASeqV2, pan-cancer normalized log2(norm_counts+1) data, version 2016-08-16) |
 |
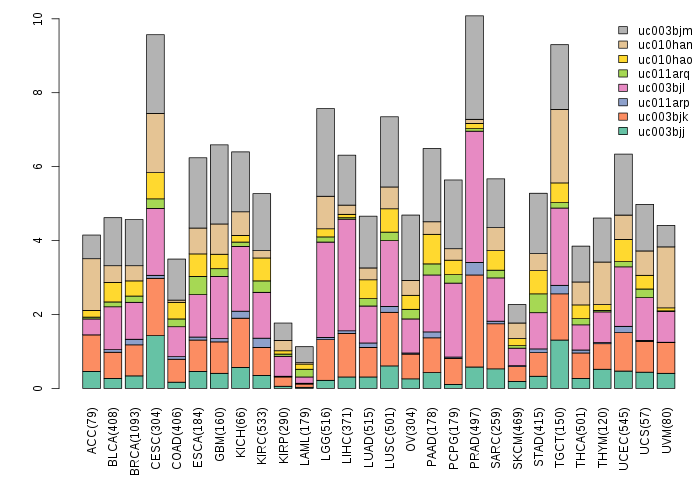
| Gene isoform expressions across 28 cancer types (X-axis: cancer type and Y-axis: log2(norm_counts+1)) (TCGA pan-cancer tcga_rsem_isoform_tpm, version 2016-09-01) |
 |
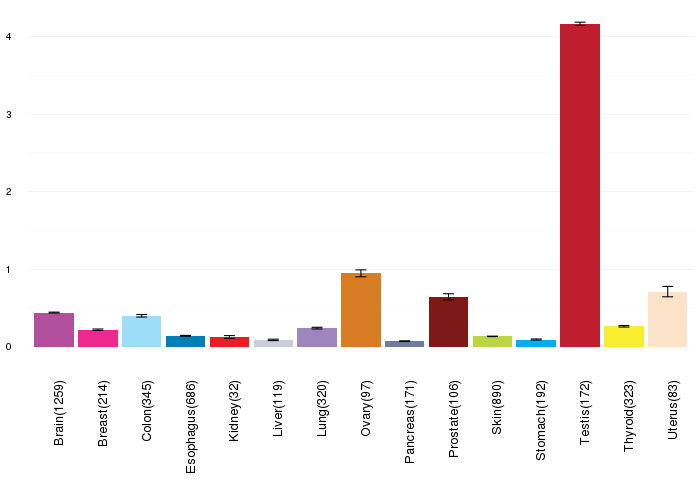
| Gene expressions across normal tissues of GTEx data (GTEx GTEx_Analysis_v6_RNA-seq_RNA-SeQCv1.1.8_gene_rpkm.gct) - Here, we shows the matched tissue types only among our 28 cancer types. |
 |
| Different expressions across 14 cancer types with more than 10 samples between matched tumors and normals (X-axis: cancer type and Y-axis: log2(norm_counts+1)) (TCGA IlluminaHiSeq_RNASeqV2, pan-cancer normalized log2(norm_counts+1) data, version 2016-08-16) |
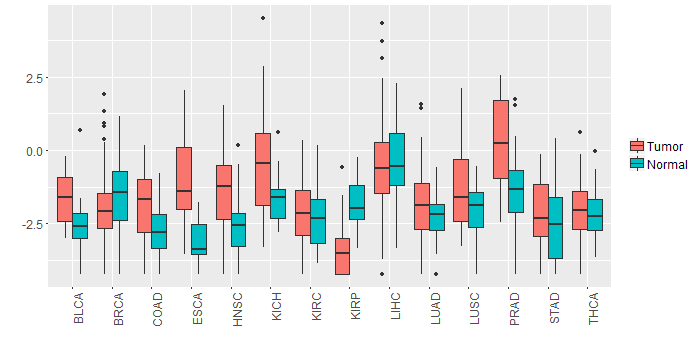 |
| - Significantly differentially expressed cancer types and information. (|Fold change|>1 and FDR<0.05) |
| Cancer type | Mean(exp) in tumor | Mean(exp) in matched normal | Log2FC | P-val. | FDR |
| HNSC | -1.349350349 | -2.642048023 | 1.292697674 | 8.22E-06 | 4.78E-05 |
| PRAD | 0.265815214 | -1.432944401 | 1.698759615 | 1.40E-08 | 1.68E-07 |
| KIRP | -3.372364593 | -1.811227093 | -1.5611375 | 1.71E-09 | 1.54E-08 |
| ESCA | -1.04099073 | -3.163118002 | 2.122127273 | 0.00197 | 0.022583918 |
| KICH | -0.305039093 | -1.673675093 | 1.368636 | 0.00359 | 0.006989717 |
| Top |
| TissGene-miRNA for MOV10L1 |
| Significantly anti-correlated miRNAs of TissGene across 28 cancer types (Gene-miRNA relations from TargetScanHuman Relsease 7.1, Conserved_Site_Context_Scores.txt.zip, 06.01.2016) (TCGA IlluminaHiSeq_miRNASeq, log2(RPM+1) data, version 2016-11-21) (TCGA IlluminaHiSeq_RNASeqV2, log2(normalized_count+1) data, version 2016-08-16) (Spearman’s Rank Correlation (p-value<0.05 and coefficient<-0.25)) |
| Cancer type | miRNA id | miRNA accession | P-val. | Coeff. | # samples |
| Top |
| TissGeneMut for MOV10L1 |
| TissGeneSNV for MOV10L1 |
| nsSNV counts per each loci. Different colors of circles represent different cancer types. Circle size denotes number of samples. (TCGA somatic mutation (SNPs and small INDELs) data, version 2016-04-25) * Click on the image to enlarge it in a new window. |
 |
| Somatic nucleotide variants of TissGene across 28 cancer types (X-axis: cancer type and Y-axis: % of mutated samples) The numbers in parentheses are numbers of samples with mutation (nsSNVs). (TCGA somatic mutation (SNPs and small INDELs) data, version 2016-04-25) |
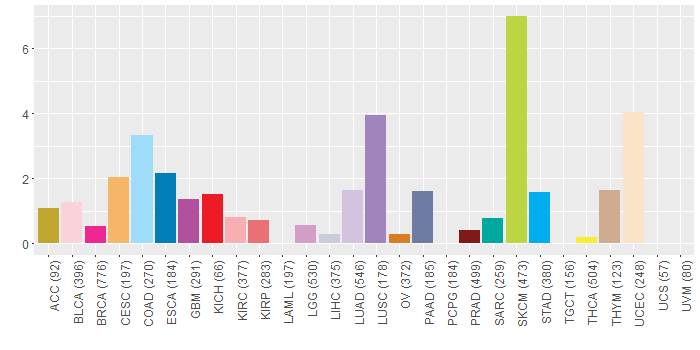 |
| - nsSNVs sorted by frequency. |
| AAchange | Cancer type | # samples |
| p.T18S | COAD | 4 |
| p.R762H | GBM | 1 |
| p.P660S | ESCA | 1 |
| p.V1073M | SKCM | 1 |
| p.L142P | KIRC | 1 |
| p.A1159T | SKCM | 1 |
| p.A597V | UCEC | 1 |
| p.A959T | PAAD | 1 |
| p.N296S | BLCA | 1 |
| p.H254Y | SKCM | 1 |
| p.R424H | STAD | 1 |
| p.T1067M | GBM | 1 |
| p.D105N | SKCM | 1 |
| p.T481I | SKCM | 1 |
| p.E704K | SKCM | 1 |
| p.R1120* | HNSC | 1 |
| p.T15S | KIRP | 1 |
| p.R984W | STAD | 1 |
| p.R795Q | BLCA | 1 |
| p.N267S | LGG | 1 |
| p.V570F | OV | 1 |
| p.G901R | GBM | 1 |
| p.D793G | THCA | 1 |
| p.V727I | HNSC | 1 |
| p.V116A | SARC | 1 |
| p.V798L | LUSC | 1 |
| p.P406S | SKCM | 1 |
| p.T687S | LUAD | 1 |
| p.A250T | THYM | 1 |
| p.G1159R | CESC | 1 |
| p.G634C | READ | 1 |
| p.L768I | UCEC | 1 |
| p.P1037R | BLCA | 1 |
| p.E834D | ESCA | 1 |
| p.S233* | LUAD | 1 |
| p.D56N | SKCM | 1 |
| p.L264V | HNSC | 1 |
| p.G385R | SKCM | 1 |
| p.A1038T | SKCM | 1 |
| p.P718R | BRCA | 1 |
| p.A456S | LUSC | 1 |
| p.G1147E | SKCM | 1 |
| p.G298* | ACC | 1 |
| p.Q302* | LUSC | 1 |
| p.H278Y | STAD | 1 |
| p.E458X | KIRP | 1 |
| p.Q361E | SKCM | 1 |
| p.C432F | SKCM | 1 |
| p.R1027Q | COAD | 1 |
| p.G285R | SKCM | 1 |
| p.G298R | SKCM | 1 |
| p.T1167A | LIHC | 1 |
| p.A455S | LUAD | 1 |
| p.M1086I | SKCM | 1 |
| p.E200K | SKCM | 1 |
| p.G419* | LUAD | 1 |
| p.S363L | SKCM | 1 |
| p.G1091A | HNSC | 1 |
| p.G914A | UCEC | 1 |
| p.V124M | UCEC | 1 |
| p.E171K | BLCA | 1 |
| p.G419R | HNSC | 1 |
| p.S126F | SKCM | 1 |
| p.A522V | UCEC | 1 |
| p.V650F | THYM | 1 |
| p.R1134X | READ | 1 |
| p.Y947H | UCEC | 1 |
| p.S579F | BLCA | 1 |
| p.G759C | PRAD | 1 |
| p.I664M | LUAD | 1 |
| p.L1079I | UCEC | 1 |
| p.A239V | UCEC | 1 |
| p.E1163K | SKCM | 1 |
| p.C380S | STAD | 1 |
| p.F857I | UCEC | 1 |
| p.G1029E | SKCM | 1 |
| p.P571S | BRCA | 1 |
| p.K283N | PAAD | 1 |
| p.R812W | SKCM | 1 |
| p.F1116L | STAD | 1 |
| p.G419R | BRCA | 1 |
| p.E1113G | STAD | 1 |
| p.G154R | SKCM | 1 |
| p.S336F | SKCM | 1 |
| p.R286I | UCEC | 1 |
| p.D388Y | UCEC | 1 |
| p.T289A | UCEC | 1 |
| p.S1107L | UCEC | 1 |
| p.V1041I | GBM | 1 |
| p.G563R | LUAD | 1 |
| p.K283N | PRAD | 1 |
| p.S2L | SKCM | 1 |
| p.R440Q | BRCA | 1 |
| p.G298E | SKCM | 1 |
| p.G298X | ACC | 1 |
| p.E1094D | UCEC | 1 |
| p.E606Q | CESC | 1 |
| p.D63Y | ESCA | 1 |
| p.E1094K | CESC | 1 |
| p.R248_splice | LUSC | 1 |
| p.P660S | SKCM | 1 |
| p.E976K | LUAD | 1 |
| p.R762H | KICH | 1 |
| p.N636T | UCEC | 1 |
| p.D1098N | SKCM | 1 |
| p.R424H | LUAD | 1 |
| p.E1007Q | LGG | 1 |
| p.K585I | LUSC | 1 |
| p.Q395* | UCEC | 1 |
| p.R488K | SKCM | 1 |
| p.M554I | LUAD | 1 |
| p.R1027Q | SKCM | 1 |
| p.P422S | SKCM | 1 |
| p.D50N | SKCM | 1 |
| p.C187S | LUSC | 1 |
| p.A840D | SKCM | 1 |
| p.E575K | COAD | 1 |
| p.R7C | HNSC | 1 |
| p.Q469H | KIRC | 1 |
| p.E579K | READ | 1 |
| p.E171K | HNSC | 1 |
| p.E180X | READ | 1 |
| p.P1139S | SKCM | 1 |
| p.G848E | SKCM | 1 |
| p.Q497R | SARC | 1 |
| p.E990K | SKCM | 1 |
| p.R1154* | UCEC | 1 |
| p.P496S | SKCM | 1 |
| p.R1154* | SKCM | 1 |
| p.K246N | CESC | 1 |
| p.E549K | READ | 1 |
| p.D1118N | SKCM | 1 |
| p.K970N | UCEC | 1 |
| p.H788R | UCEC | 1 |
| p.D1175N | UCEC | 1 |
| p.R440Q | SKCM | 1 |
| p.P765S | LUSC | 1 |
| p.S365R | KIRC | 1 |
| p.L1123W | ESCA | 1 |
| p.G89R | COAD | 1 |
| p.R162W | COAD | 1 |
| p.D1099Y | COAD | 1 |
| p.E147D | LGG | 1 |
| p.P375L | PAAD | 1 |
| p.E599K | PAAD | 1 |
| Top |
| TissGeneCNV for MOV10L1 |
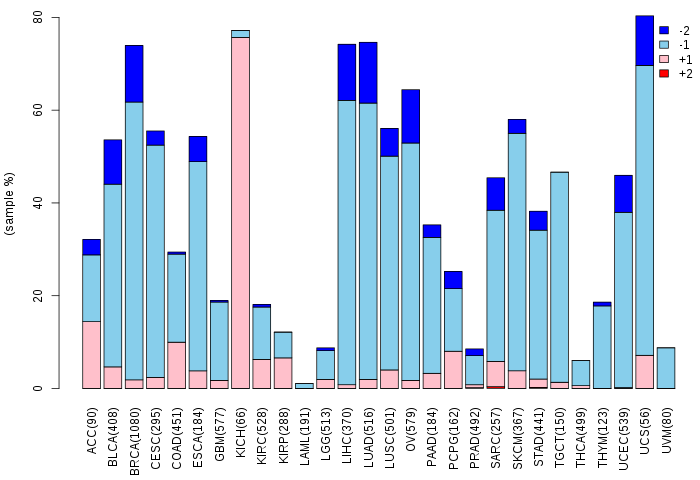
| Copy number variations of TissGene across 28 cancer types (X-axis: cancer type and Y-axis: % of CNV samples) (TCGA Gistic2_CopyNumber_Gistic2_all_data_by_genes, Gistic2 copy number data, version 2016-08-16) |
 |
| Top |
| TissGeneFusions for MOV10L1 |
| Fusion genes including TissGene (ChimerDB 3.0, 2016-12-01 and TCGA fusion Portal 2015-12-01) |
| Database | Src | Cancer type | Sample | Fusion gene | ORF | 5'-gene BP | 3'-gene BP |
| TCGAfusionPortal | PRADA | BRCA | TCGA-C8-A27A-01A | MOV10L1-NAV2 | In-frame | Chr22:50555780 | Chr11:20005671 |
| TCGAfusionPortal | PRADA | BRCA | TCGA-C8-A27A-01A | BCR-MOV10L1 | In-frame | Chr22:23524426 | Chr22:50530430 |
| Top |
| TissGeneNet for MOV10L1 |
| Co-expressed gene networks based on protein-protein interaction data (CePIN) (TCGA IlluminaHiSeq_RNASeqV2, pan-cancer normalized log2(norm_counts+1) data, version 2016-08-16) (PINA2 ppi data) |
| Top |
| TissGeneProg for MOV10L1 |
| Kaplan-Meier plots with logrank tests of overall survival (OS) using 28 cancer types (TCGA IlluminaHiSeq_RNASeqV2, pan-cancer normalized log2(norm_counts+1) data, version 2016-08-16) (TCGA clinicalMatrix, phenotype data, version 2016-04-27) * Click on the image to enlarge it in a new window. |
 |
| Kaplan-Meier plots with logrank test of relapse free survival (RFS) using 28 cancer types (TCGA IlluminaHiSeq_RNASeqV2, pan-cancer normalized log2(norm_counts+1) data, version 2016-08-16) (TCGA clinicalMatrix, phenotype data, version 2016-04-27) * Click on the image enlarge it in a new window. |
 |
| Forest plot of Cox proportional hazard ratio (HR) and 95% CI of overall survival (OS) using 28 cancer types (TCGA IlluminaHiSeq_RNASeqV2, pan-cancer normalized log2(norm_counts+1) data, version 2016-08-16) (TCGA clinicalMatrix, phenotype data, version 2016-04-27) * Click on the image enlarge it in a new window. |
 |
| Forest plot of Cox proportional hazard ratio (HR) and 95% CI of relapse free survival (RFS) using 28 cancer types (TCGA IlluminaHiSeq_RNASeqV2, pan-cancer normalized log2(norm_counts+1) data, version 2016-08-16) (TCGA clinicalMatrix, phenotype data, version 2016-04-27) * Click on the image enlarge it in a new window. |
 |
| Top |
| TissGeneClin for MOV10L1 |
| TissGeneDrug for MOV10L1 |
| Drug information targeting TissGene (DrugBank Version 5.0.6, 2017-04-01) |
| DrugBank ID | Drug name | Drug activity | Drug type | Drug status |
| Top |
| TissGeneDisease for MOV10L1 |
| Disease information associated with TissGene (DisGeNet, 2016-06-01) |
| Disease ID | Disease name | # pubmeds | Source |
| umls:C0016048 | Fibromatosis | 1 | BeFree |
| umls:C0021364 | Male infertility | 1 | BeFree |
| umls:C0040336 | Tobacco Use Disorder | 1 | GAD |
| umls:C0205945 | Sarcoma, Spindle Cell | 1 | BeFree |
| umls:C1261473 | Sarcoma | 1 | BeFree |
|
Copyright 2016-Present - The University of Texas Health Science Center at Houston (UTHealth) Web File Viewing | How to Report, Fraud, Waste and Abuse | State of Texas | Statewide Search | Texas Homeland Security | Site Policies |