 |
| |
| |
| |
| |
| |
| |
|

| TissGeneSummary for FAM105A |
 Gene summary Gene summary |
| Basic gene information | Gene symbol | FAM105A |
| Gene name | family with sequence similarity 105, member A | |
| Synonyms | NET20 | |
| Cytomap | UCSC genome browser: 5p15.2 | |
| Type of gene | protein-coding | |
| RefGenes | NM_019018.2, | |
| Description | inactive ubiquitin thioesterase FAM105Aprotein FAM105A | |
| Modification date | 20141207 | |
| dbXrefs | HGNC : HGNC | |
| HPRD : 07733 | ||
| Protein | UniProt: go to UniProt's Cross Reference DB Table | |
| Expression | CleanEX: HS_FAM105A | |
| BioGPS: 54491 | ||
| Pathway | NCI Pathway Interaction Database: FAM105A | |
| KEGG: FAM105A | ||
| REACTOME: FAM105A | ||
| Pathway Commons: FAM105A | ||
| Context | iHOP: FAM105A | |
| ligand binding site mutation search in PubMed: FAM105A | ||
| UCL Cancer Institute: FAM105A | ||
| Assigned class in TissGDB* | C | |
| Included tissue-specific gene expression resources | ||
| Specific-tissues in normal samples (assigned by TissGDB using HPA, TiGER, and GTEx) | CervixLung | |
| Cancer types related to the specific-tissues in cancer samples (assigned by TissGDB using TCGA) | CESCLUAD,LUSC | |
| Reference showing the relevant tissue of FAM105A | ||
| Description by TissGene annotations | TissgsLTS | |
| * Class A consists of genes with literature evidence and is part of the cTissGenes. Class B consists of only cTissGenes without additional evidence. The remaining genes belong to Class C. |
| Gene ontology having evidence of Inferred from Direct Assay (IDA) from Entrez |
| GO ID | GO term | PubMed ID |
| Top |
| TissGeneExp for FAM105A |
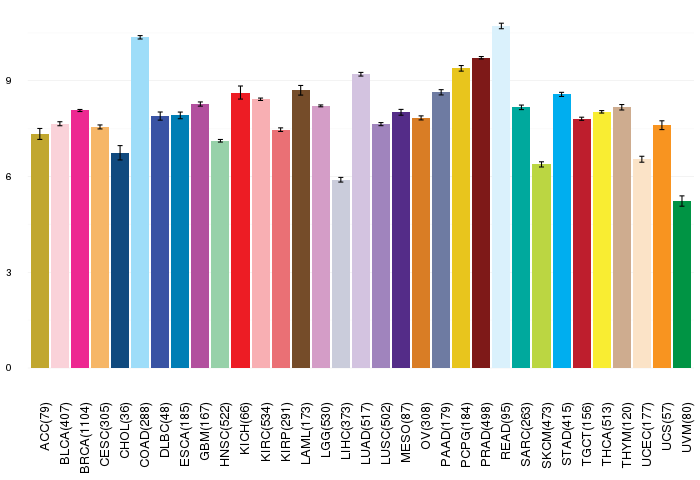
| Gene expressions across 28 cancer types (X-axis: cancer type and Y-axis: log2(norm_counts+1)) (TCGA IlluminaHiSeq_RNASeqV2, pan-cancer normalized log2(norm_counts+1) data, version 2016-08-16) |
 |
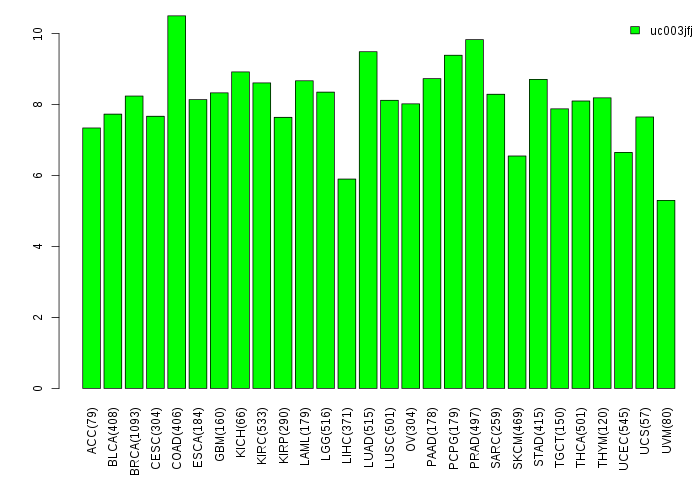
| Gene isoform expressions across 28 cancer types (X-axis: cancer type and Y-axis: log2(norm_counts+1)) (TCGA pan-cancer tcga_rsem_isoform_tpm, version 2016-09-01) |
 |
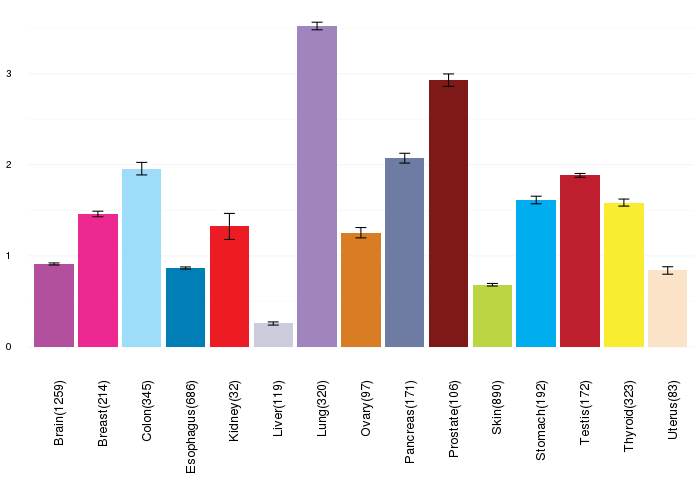
| Gene expressions across normal tissues of GTEx data (GTEx GTEx_Analysis_v6_RNA-seq_RNA-SeQCv1.1.8_gene_rpkm.gct) - Here, we shows the matched tissue types only among our 28 cancer types. |
 |
| Different expressions across 14 cancer types with more than 10 samples between matched tumors and normals (X-axis: cancer type and Y-axis: log2(norm_counts+1)) (TCGA IlluminaHiSeq_RNASeqV2, pan-cancer normalized log2(norm_counts+1) data, version 2016-08-16) |
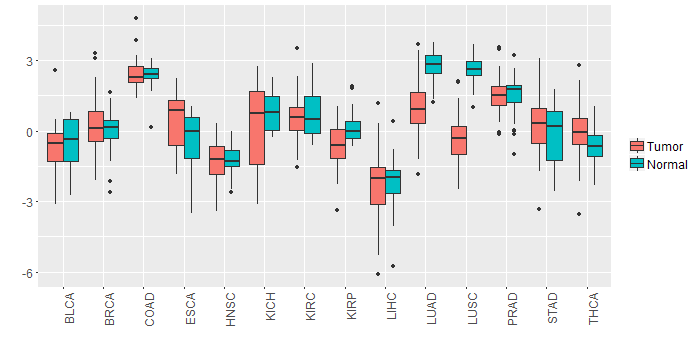 |
| - Significantly differentially expressed cancer types and information. (|Fold change|>1 and FDR<0.05) |
| Cancer type | Mean(exp) in tumor | Mean(exp) in matched normal | Log2FC | P-val. | FDR |
| LUAD | 1.050516612 | 2.824364887 | -1.773848276 | 4.33E-16 | 4.86E-15 |
| LUSC | -0.378428115 | 2.636938552 | -3.015366667 | 4.15E-29 | 1.53E-27 |
| Top |
| TissGene-miRNA for FAM105A |
| Significantly anti-correlated miRNAs of TissGene across 28 cancer types (Gene-miRNA relations from TargetScanHuman Relsease 7.1, Conserved_Site_Context_Scores.txt.zip, 06.01.2016) (TCGA IlluminaHiSeq_miRNASeq, log2(RPM+1) data, version 2016-11-21) (TCGA IlluminaHiSeq_RNASeqV2, log2(normalized_count+1) data, version 2016-08-16) (Spearman’s Rank Correlation (p-value<0.05 and coefficient<-0.25)) |
| Cancer type | miRNA id | miRNA accession | P-val. | Coeff. | # samples |
| Top |
| TissGeneMut for FAM105A |
| TissGeneSNV for FAM105A |
| nsSNV counts per each loci. Different colors of circles represent different cancer types. Circle size denotes number of samples. (TCGA somatic mutation (SNPs and small INDELs) data, version 2016-04-25) * Click on the image to enlarge it in a new window. |
 |
 |
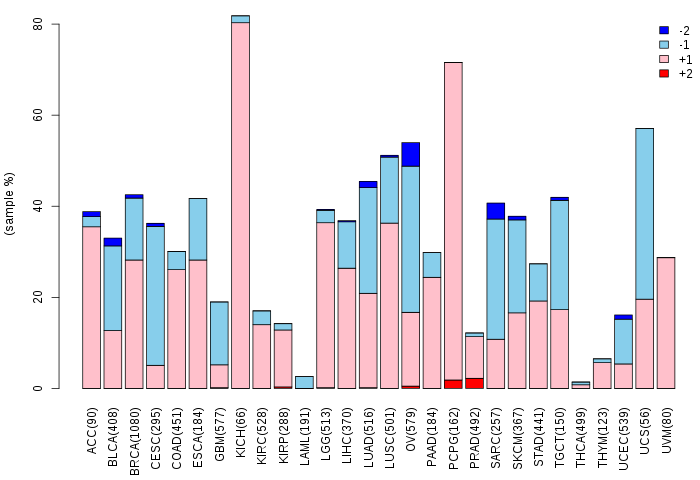
| Somatic nucleotide variants of TissGene across 28 cancer types (X-axis: cancer type and Y-axis: % of mutated samples) The numbers in parentheses are numbers of samples with mutation (nsSNVs). (TCGA somatic mutation (SNPs and small INDELs) data, version 2016-04-25) |
 |
| - nsSNVs sorted by frequency. |
| AAchange | Cancer type | # samples |
| p.S290Y | UCEC | 2 |
| p.L229P | KIRP | 1 |
| p.E332X | ESCA | 1 |
| p.E253D | LIHC | 1 |
| p.T108I | STAD | 1 |
| p.G215C | THYM | 1 |
| p.S273P | LUAD | 1 |
| p.Y219C | COAD | 1 |
| p.M114I | BLCA | 1 |
| p.E169K | SKCM | 1 |
| p.S193L | UCEC | 1 |
| p.G78* | HNSC | 1 |
| p.K128E | CESC | 1 |
| p.P156L | SKCM | 1 |
| p.D337G | UCEC | 1 |
| p.V263I | LGG | 1 |
| p.S69T | KIRC | 1 |
| p.S69L | BLCA | 1 |
| p.G106R | LUAD | 1 |
| p.K201T | UCEC | 1 |
| p.F149V | OV | 1 |
| p.D293N | OV | 1 |
| p.L171P | UCS | 1 |
| p.E275K | SKCM | 1 |
| p.S273F | SKCM | 1 |
| p.D325N | SKCM | 1 |
| p.D348N | UCEC | 1 |
| p.L229P | PAAD | 1 |
| p.S6N | LIHC | 1 |
| p.P19A | LGG | 1 |
| p.F283S | KIRP | 1 |
| p.C60F | CHOL | 1 |
| p.L267V | BRCA | 1 |
| p.F303L | LUAD | 1 |
| p.L229R | HNSC | 1 |
| p.K72R | PAAD | 1 |
| p.D293G | LIHC | 1 |
| p.R102K | ESCA | 1 |
| p.D293N | READ | 1 |
| p.D95Y | BRCA | 1 |
| p.E346K | UCEC | 1 |
| p.E204A | SKCM | 1 |
| p.R82K | SKCM | 1 |
| p.P354L | SKCM | 1 |
| p.G78E | SKCM | 1 |
| p.R131* | UCEC | 1 |
| p.R217T | LUAD | 1 |
| p.P339L | COAD | 1 |
| p.E188X | ESCA | 1 |
| p.R134K | SKCM | 1 |
| p.K128N | UCEC | 1 |
| p.G215V | COAD | 1 |
| p.P187S | SKCM | 1 |
| p.A117V | UCEC | 1 |
| p.H287Y | SKCM | 1 |
| Top |
| TissGeneCNV for FAM105A |
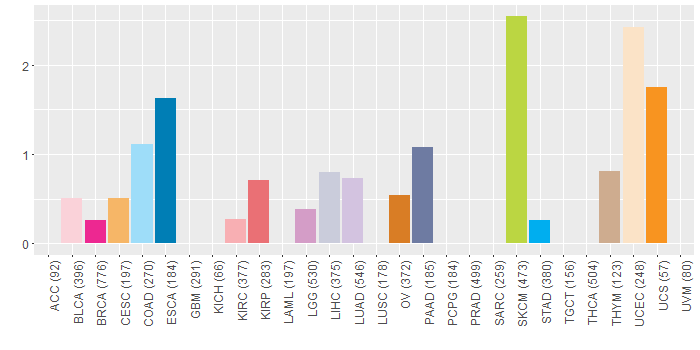
| Copy number variations of TissGene across 28 cancer types (X-axis: cancer type and Y-axis: % of CNV samples) (TCGA Gistic2_CopyNumber_Gistic2_all_data_by_genes, Gistic2 copy number data, version 2016-08-16) |
 |
| Top |
| TissGeneFusions for FAM105A |
| Fusion genes including TissGene (ChimerDB 3.0, 2016-12-01 and TCGA fusion Portal 2015-12-01) |
| Database | Src | Cancer type | Sample | Fusion gene | ORF | 5'-gene BP | 3'-gene BP |
| Chimerdb3.0 | ChiTaRs | NA | DA046822 | FAM105A-DHCR24 | chr5:14610569 | chr1:55317014 | |
| Chimerdb3.0 | ChiTaRs | NA | BQ027700 | FAM105A-FAM105A | chr5:14601748 | chr5:14601099 | |
| Chimerdb3.0 | ChiTaRs | NA | BG982650 | ABCC1-FAM105A | chr16:16089541 | chr5:14607545 |
| Top |
| TissGeneNet for FAM105A |
| Co-expressed gene networks based on protein-protein interaction data (CePIN) (TCGA IlluminaHiSeq_RNASeqV2, pan-cancer normalized log2(norm_counts+1) data, version 2016-08-16) (PINA2 ppi data) |
| Top |
| TissGeneProg for FAM105A |
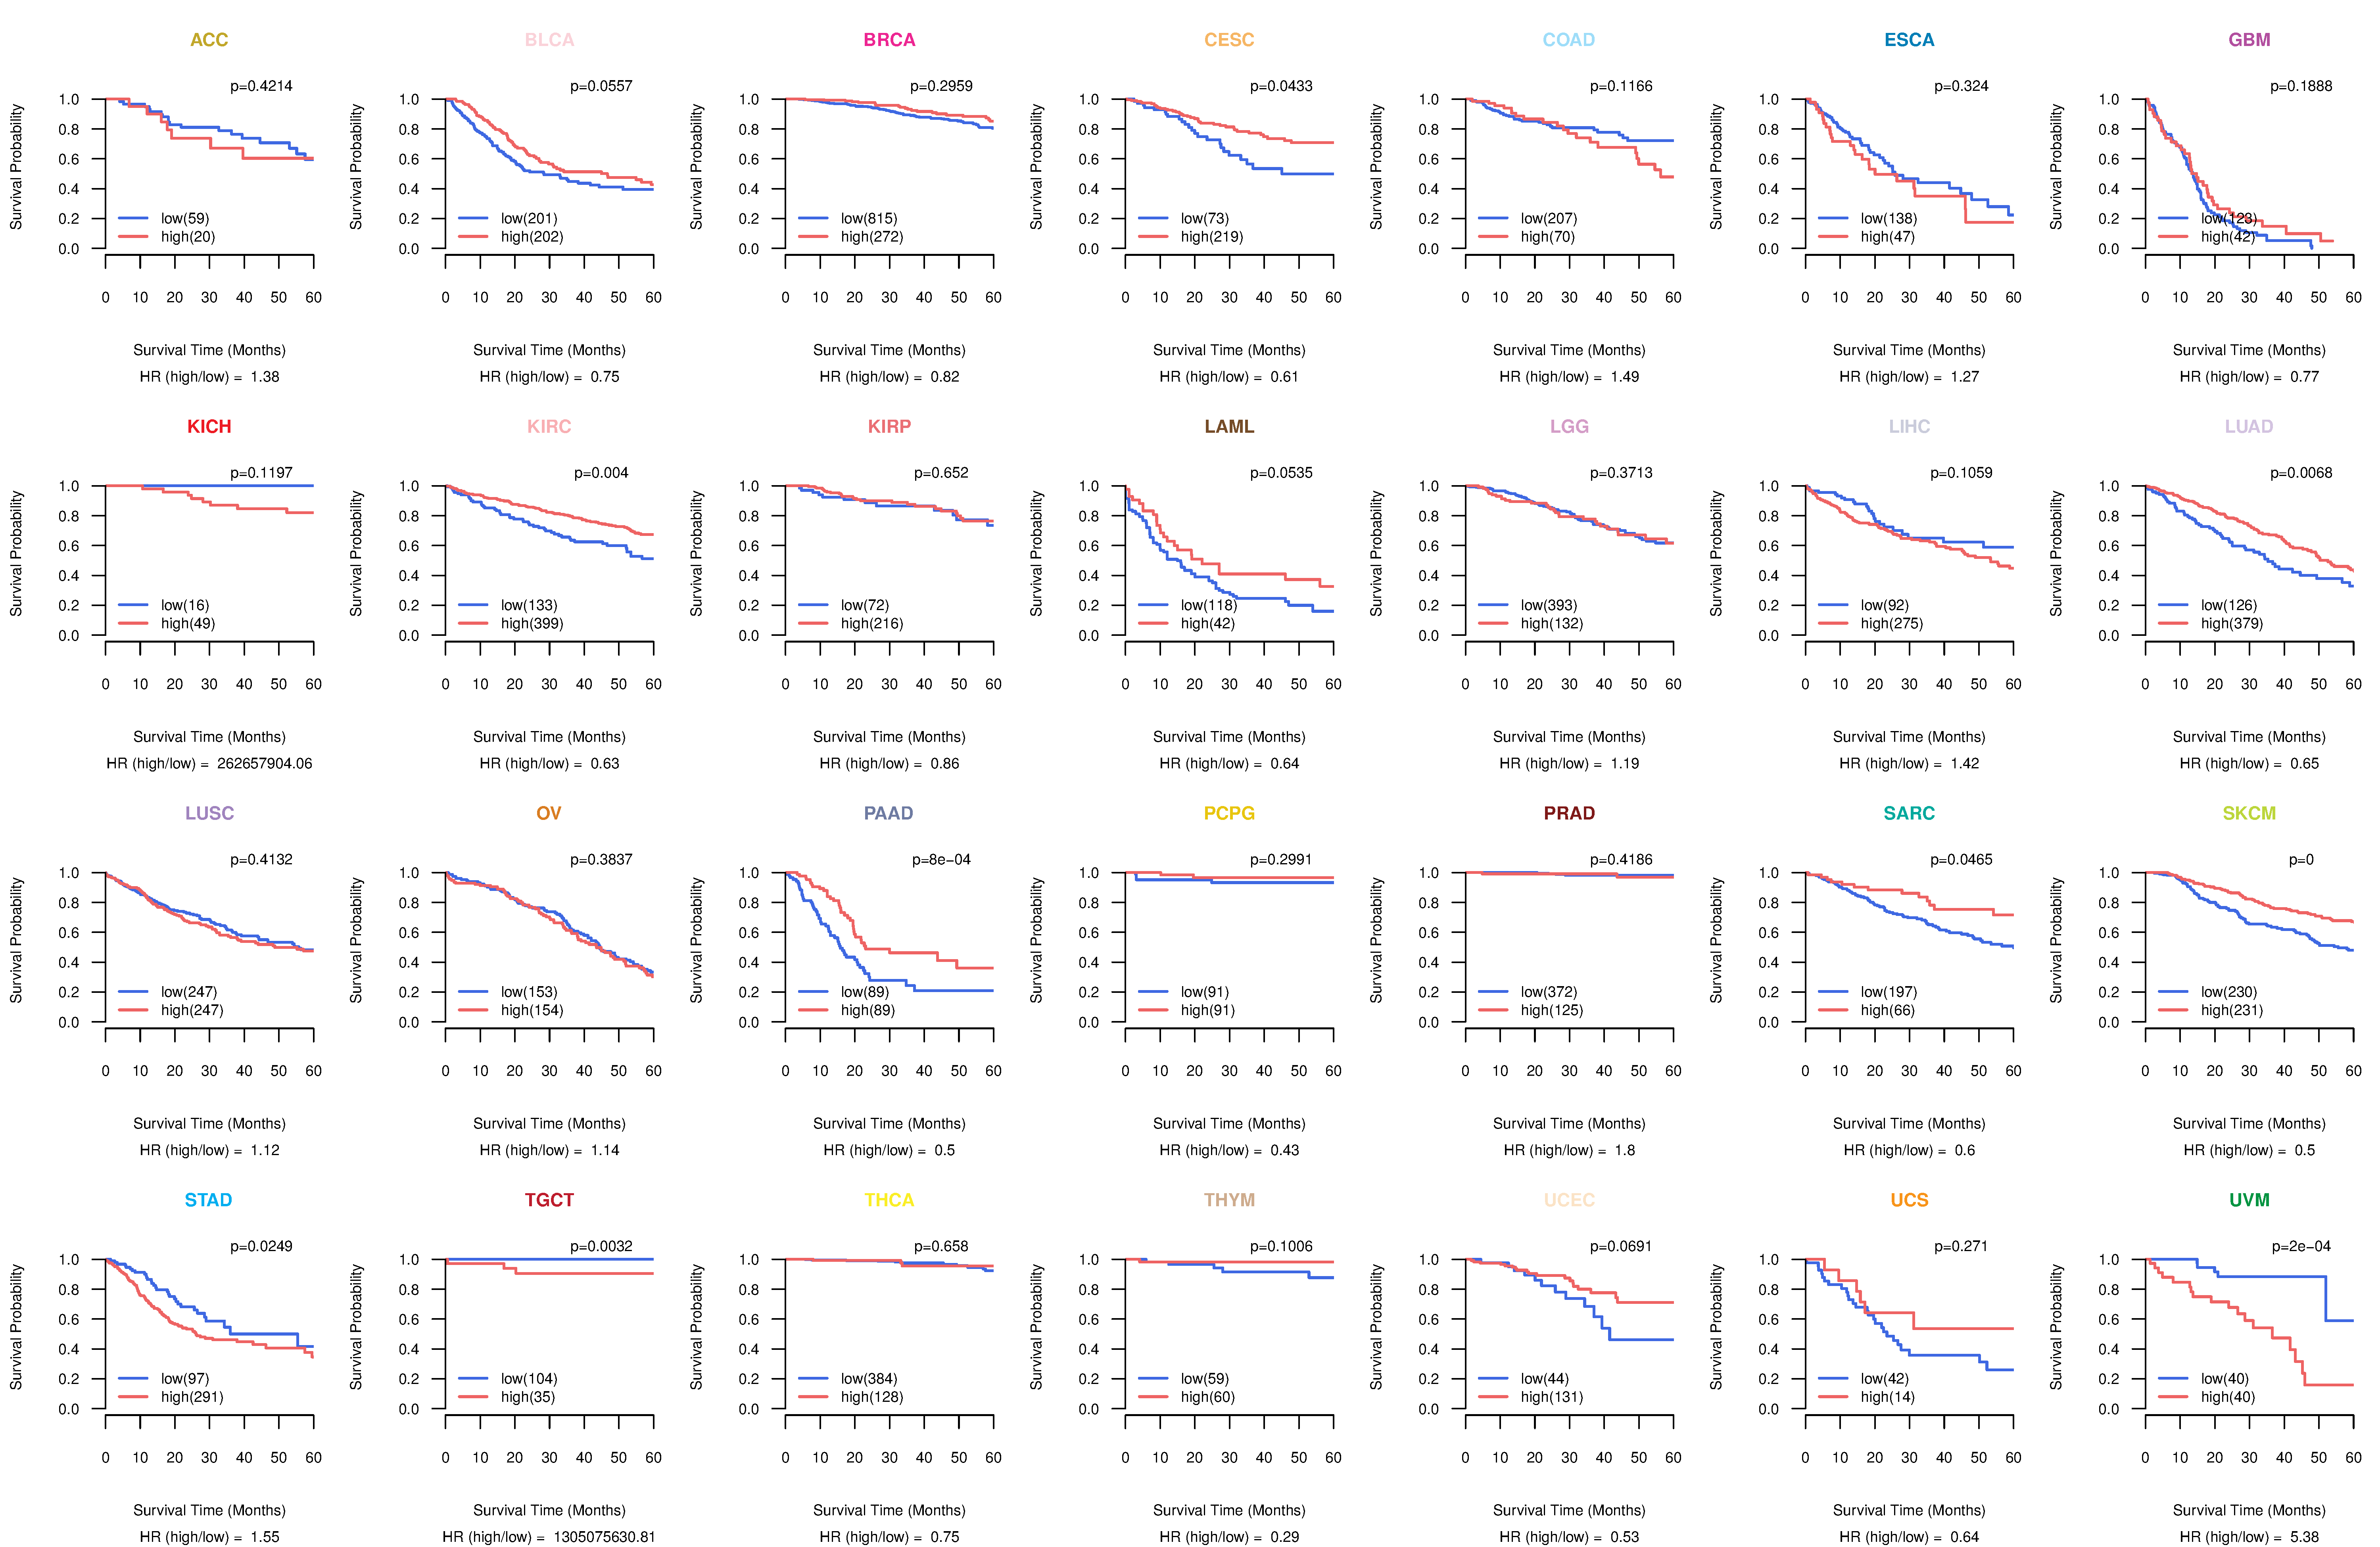
| Kaplan-Meier plots with logrank tests of overall survival (OS) using 28 cancer types (TCGA IlluminaHiSeq_RNASeqV2, pan-cancer normalized log2(norm_counts+1) data, version 2016-08-16) (TCGA clinicalMatrix, phenotype data, version 2016-04-27) * Click on the image to enlarge it in a new window. |
 |
| Kaplan-Meier plots with logrank test of relapse free survival (RFS) using 28 cancer types (TCGA IlluminaHiSeq_RNASeqV2, pan-cancer normalized log2(norm_counts+1) data, version 2016-08-16) (TCGA clinicalMatrix, phenotype data, version 2016-04-27) * Click on the image enlarge it in a new window. |
 |
| Forest plot of Cox proportional hazard ratio (HR) and 95% CI of overall survival (OS) using 28 cancer types (TCGA IlluminaHiSeq_RNASeqV2, pan-cancer normalized log2(norm_counts+1) data, version 2016-08-16) (TCGA clinicalMatrix, phenotype data, version 2016-04-27) * Click on the image enlarge it in a new window. |
 |
| Forest plot of Cox proportional hazard ratio (HR) and 95% CI of relapse free survival (RFS) using 28 cancer types (TCGA IlluminaHiSeq_RNASeqV2, pan-cancer normalized log2(norm_counts+1) data, version 2016-08-16) (TCGA clinicalMatrix, phenotype data, version 2016-04-27) * Click on the image enlarge it in a new window. |
 |
| Top |
| TissGeneClin for FAM105A |
| TissGeneDrug for FAM105A |
| Drug information targeting TissGene (DrugBank Version 5.0.6, 2017-04-01) |
| DrugBank ID | Drug name | Drug activity | Drug type | Drug status |
| Top |
| TissGeneDisease for FAM105A |
| Disease information associated with TissGene (DisGeNet, 2016-06-01) |
| Disease ID | Disease name | # pubmeds | Source |
| umls:C0017661 | IGA Glomerulonephritis | 1 | CTD_human |
|
Copyright 2016-Present - The University of Texas Health Science Center at Houston (UTHealth) Web File Viewing | How to Report, Fraud, Waste and Abuse | State of Texas | Statewide Search | Texas Homeland Security | Site Policies |