 |
| |
| |
| |
| |
| |
| |
|

| TissGeneSummary for PPP1R14D |
 Gene summary Gene summary |
| Basic gene information | Gene symbol | PPP1R14D |
| Gene name | protein phosphatase 1, regulatory (inhibitor) subunit 14D | |
| Synonyms | CPI17-like|GBPI-1|GBPI1 | |
| Cytomap | UCSC genome browser: 15q15.1 | |
| Type of gene | protein-coding | |
| RefGenes | NM_001130143.1, NM_017726.7, | |
| Description | PKC-dependent PP1 inhibitory proteingastrointestinal and brain-specific PP1-inhibitory protein 1gut and brain phosphatase inhibitor 1protein phosphatase 1 regulatory subunit 14D | |
| Modification date | 20141207 | |
| dbXrefs | MIM : 613256 | |
| HGNC : HGNC | ||
| Ensembl : ENSG00000166143 | ||
| HPRD : 17891 | ||
| Vega : OTTHUMG00000130064 | ||
| Protein | UniProt: go to UniProt's Cross Reference DB Table | |
| Expression | CleanEX: HS_PPP1R14D | |
| BioGPS: 54866 | ||
| Pathway | NCI Pathway Interaction Database: PPP1R14D | |
| KEGG: PPP1R14D | ||
| REACTOME: PPP1R14D | ||
| Pathway Commons: PPP1R14D | ||
| Context | iHOP: PPP1R14D | |
| ligand binding site mutation search in PubMed: PPP1R14D | ||
| UCL Cancer Institute: PPP1R14D | ||
| Assigned class in TissGDB* | C | |
| Included tissue-specific gene expression resources | TiGER,GTEx | |
| Specific-tissues in normal samples (assigned by TissGDB using HPA, TiGER, and GTEx) | Colon | |
| Cancer types related to the specific-tissues in cancer samples (assigned by TissGDB using TCGA) | COAD | |
| Reference showing the relevant tissue of PPP1R14D | ||
| Description by TissGene annotations | ||
| * Class A consists of genes with literature evidence and is part of the cTissGenes. Class B consists of only cTissGenes without additional evidence. The remaining genes belong to Class C. |
| Gene ontology having evidence of Inferred from Direct Assay (IDA) from Entrez |
| GO ID | GO term | PubMed ID |
| Top |
| TissGeneExp for PPP1R14D |
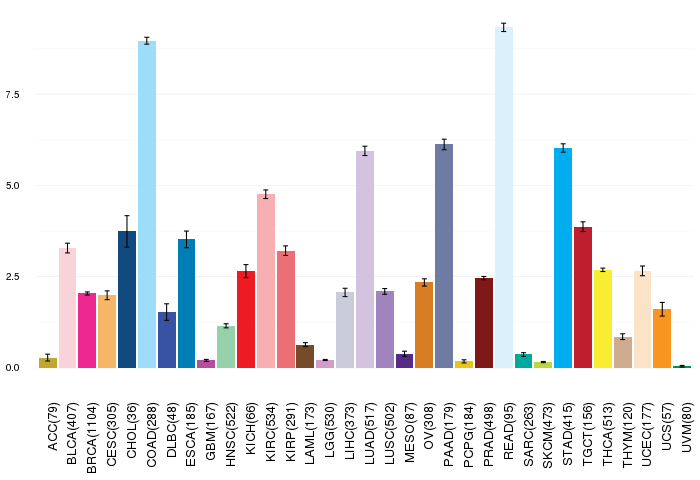
| Gene expressions across 28 cancer types (X-axis: cancer type and Y-axis: log2(norm_counts+1)) (TCGA IlluminaHiSeq_RNASeqV2, pan-cancer normalized log2(norm_counts+1) data, version 2016-08-16) |
 |
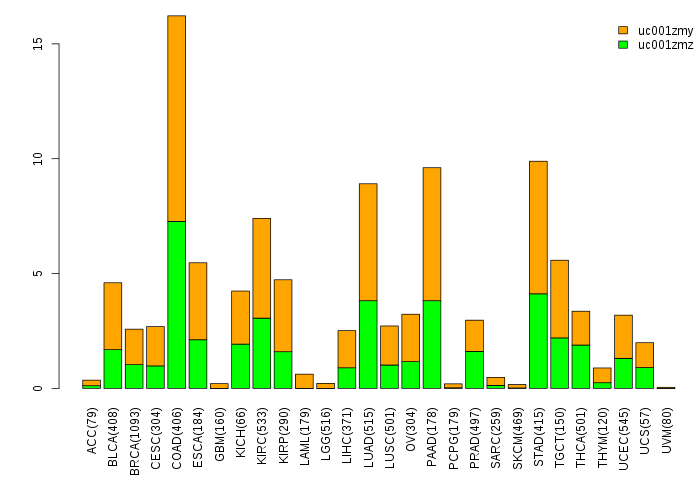
| Gene isoform expressions across 28 cancer types (X-axis: cancer type and Y-axis: log2(norm_counts+1)) (TCGA pan-cancer tcga_rsem_isoform_tpm, version 2016-09-01) |
 |
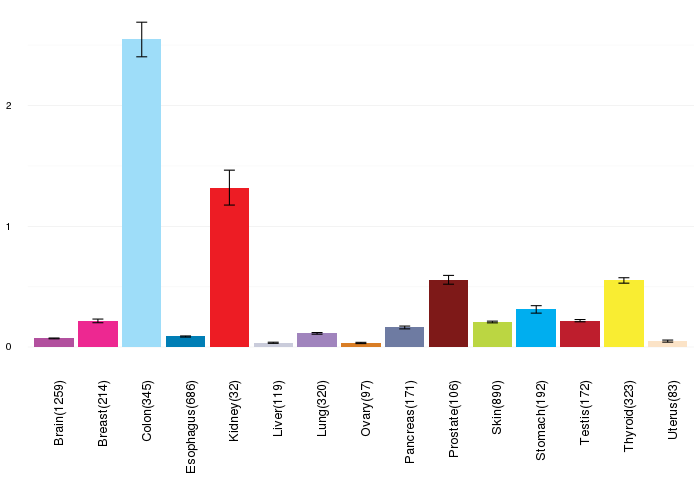
| Gene expressions across normal tissues of GTEx data (GTEx GTEx_Analysis_v6_RNA-seq_RNA-SeQCv1.1.8_gene_rpkm.gct) - Here, we shows the matched tissue types only among our 28 cancer types. |
 |
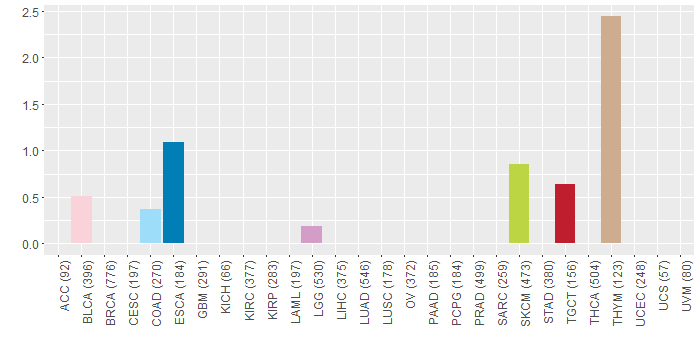
| Different expressions across 14 cancer types with more than 10 samples between matched tumors and normals (X-axis: cancer type and Y-axis: log2(norm_counts+1)) (TCGA IlluminaHiSeq_RNASeqV2, pan-cancer normalized log2(norm_counts+1) data, version 2016-08-16) |
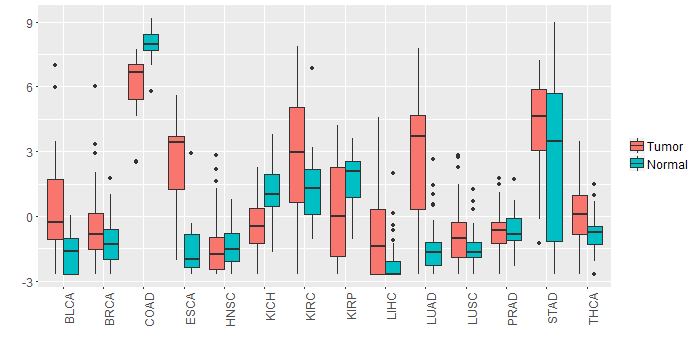 |
| - Significantly differentially expressed cancer types and information. (|Fold change|>1 and FDR<0.05) |
| Cancer type | Mean(exp) in tumor | Mean(exp) in matched normal | Log2FC | P-val. | FDR |
| LIHC | -0.745041136 | -2.241989136 | 1.496948 | 2.20E-05 | 8.62E-05 |
| COAD | 6.162049787 | 7.93782671 | -1.775776923 | 1.29E-06 | 7.12E-06 |
| LUAD | 2.765340105 | -1.505065067 | 4.270405172 | 4.51E-17 | 5.65E-16 |
| ESCA | 2.400168318 | -1.320049863 | 3.720218182 | 0.000989 | 0.014566464 |
| BLCA | 0.615417601 | -1.645813978 | 2.261231579 | 0.00224 | 0.014033127 |
| KIRP | 0.237063489 | 1.734944739 | -1.49788125 | 0.00114 | 0.003105565 |
| KICH | -0.361321136 | 1.158074864 | -1.519396 | 7.07E-05 | 0.000190726 |
| KIRC | 2.78137703 | 1.239793697 | 1.541583333 | 6.25E-05 | 0.000134675 |
| Top |
| TissGene-miRNA for PPP1R14D |
| Significantly anti-correlated miRNAs of TissGene across 28 cancer types (Gene-miRNA relations from TargetScanHuman Relsease 7.1, Conserved_Site_Context_Scores.txt.zip, 06.01.2016) (TCGA IlluminaHiSeq_miRNASeq, log2(RPM+1) data, version 2016-11-21) (TCGA IlluminaHiSeq_RNASeqV2, log2(normalized_count+1) data, version 2016-08-16) (Spearman’s Rank Correlation (p-value<0.05 and coefficient<-0.25)) |
| Cancer type | miRNA id | miRNA accession | P-val. | Coeff. | # samples |
| Top |
| TissGeneMut for PPP1R14D |
| TissGeneSNV for PPP1R14D |
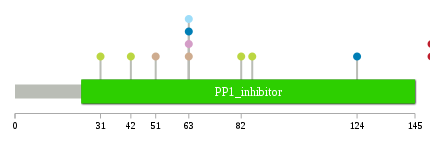
| nsSNV counts per each loci. Different colors of circles represent different cancer types. Circle size denotes number of samples. (TCGA somatic mutation (SNPs and small INDELs) data, version 2016-04-25) * Click on the image to enlarge it in a new window. |
 |
 |
| Somatic nucleotide variants of TissGene across 28 cancer types (X-axis: cancer type and Y-axis: % of mutated samples) The numbers in parentheses are numbers of samples with mutation (nsSNVs). (TCGA somatic mutation (SNPs and small INDELs) data, version 2016-04-25) |
 |
| - nsSNVs sorted by frequency. |
| AAchange | Cancer type | # samples |
| p.S170L | BLCA | 2 |
| p.W151* | TGCT | 1 |
| p.G181D | THYM | 1 |
| p.H42R | SKCM | 1 |
| p.R63L | ESCA | 1 |
| p.E17D | READ | 1 |
| p.D86N | SKCM | 1 |
| p.S55R | DLBC | 1 |
| p.R63W | THYM | 1 |
| p.E82K | SKCM | 1 |
| p.E124K | ESCA | 1 |
| p.R63W | LGG | 1 |
| p.R31M | SKCM | 1 |
| p.S51F | THYM | 1 |
| p.R63W | COAD | 1 |
| p.E187K | HNSC | 1 |
| p.W151X | TGCT | 1 |
| Top |
| TissGeneCNV for PPP1R14D |
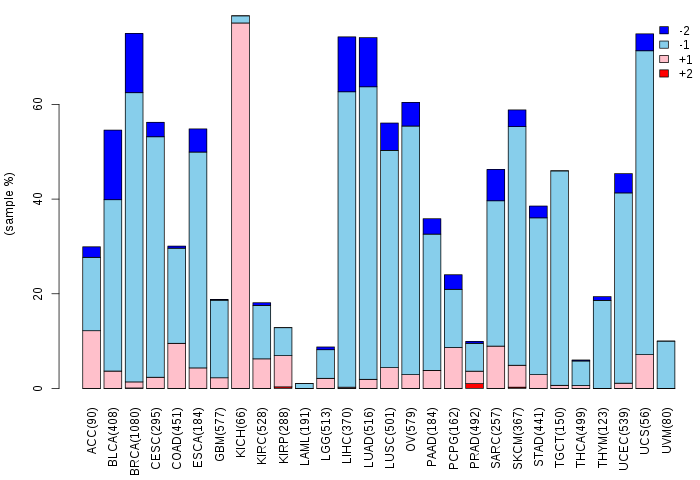
| Copy number variations of TissGene across 28 cancer types (X-axis: cancer type and Y-axis: % of CNV samples) (TCGA Gistic2_CopyNumber_Gistic2_all_data_by_genes, Gistic2 copy number data, version 2016-08-16) |
 |
| Top |
| TissGeneFusions for PPP1R14D |
| Fusion genes including TissGene (ChimerDB 3.0, 2016-12-01 and TCGA fusion Portal 2015-12-01) |
| Database | Src | Cancer type | Sample | Fusion gene | ORF | 5'-gene BP | 3'-gene BP |
| Chimerdb3.0 | FusionScan | UCEC | TCGA-KP-A3W0-01A | DNAJC17-PPP1R14D | In-Frame | chr15:41099566 | chr15:41108451 |
| TCGAfusionPortal | PRADA | LUAD | TCGA-55-6986-01A | DNAJC17-PPP1R14D | In-frame | Chr15:41099567 | Chr15:41109545 |
| Top |
| TissGeneNet for PPP1R14D |
| Co-expressed gene networks based on protein-protein interaction data (CePIN) (TCGA IlluminaHiSeq_RNASeqV2, pan-cancer normalized log2(norm_counts+1) data, version 2016-08-16) (PINA2 ppi data) |
| Top |
| TissGeneProg for PPP1R14D |
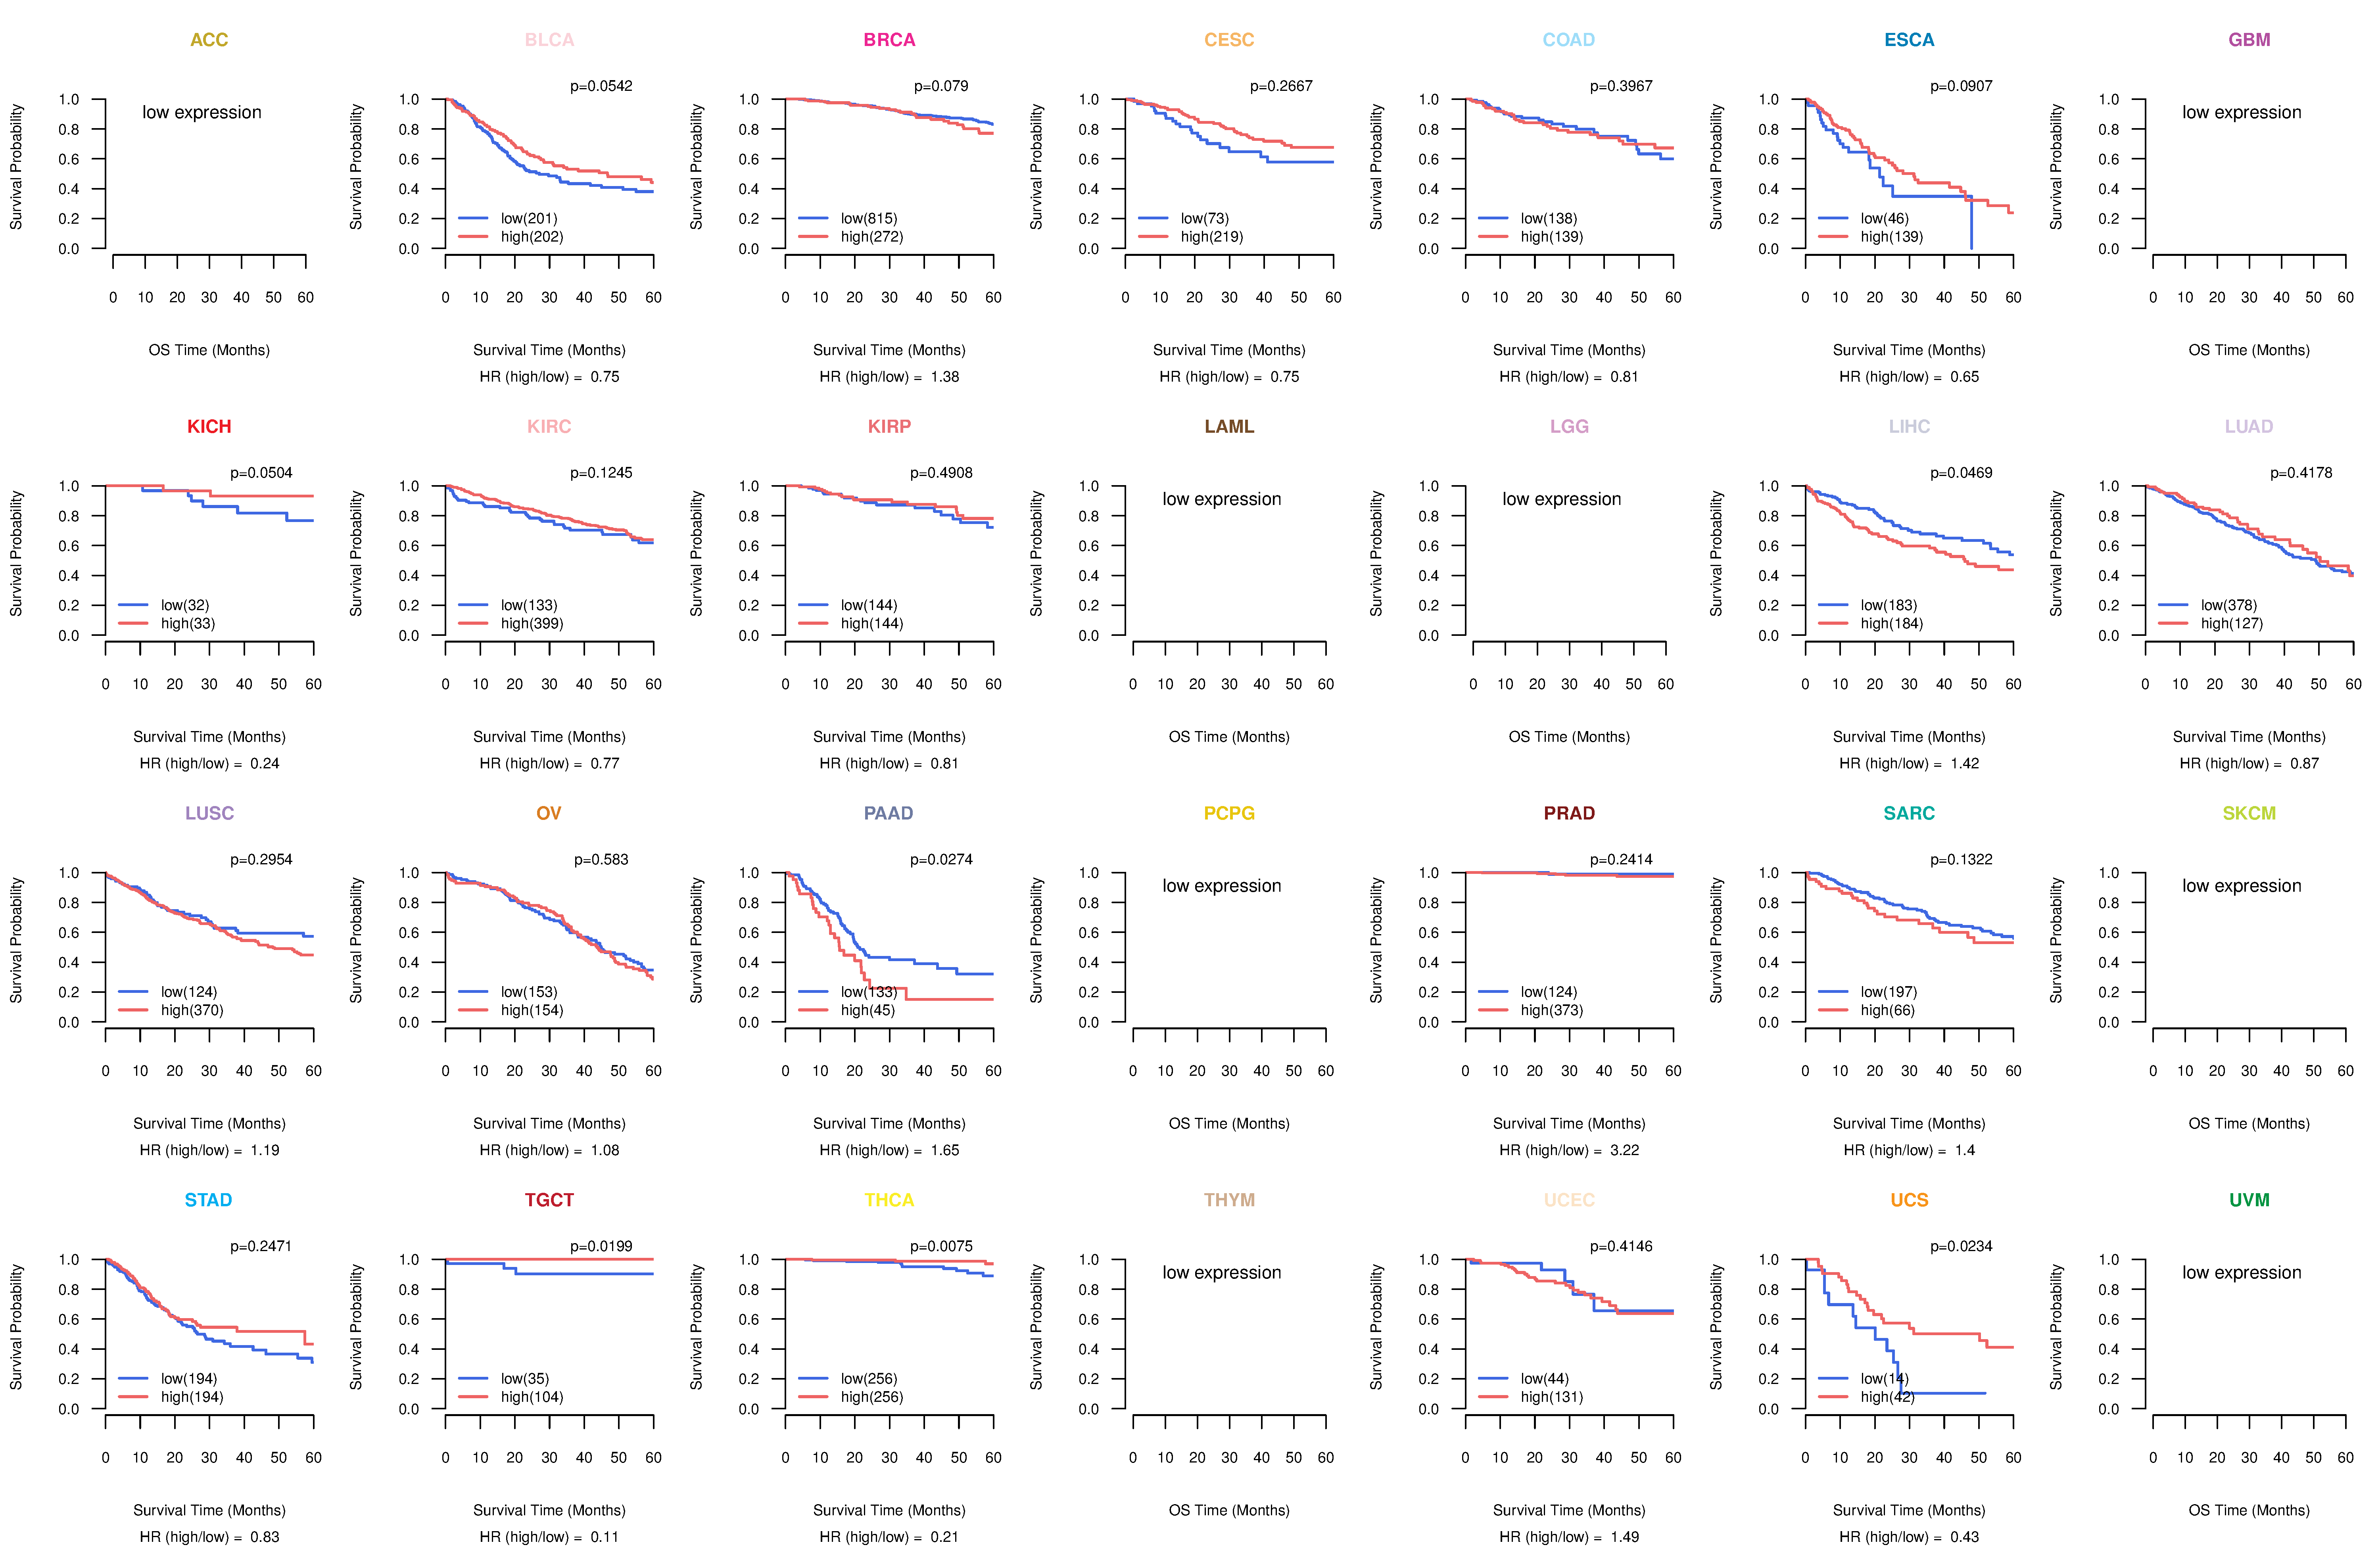
| Kaplan-Meier plots with logrank tests of overall survival (OS) using 28 cancer types (TCGA IlluminaHiSeq_RNASeqV2, pan-cancer normalized log2(norm_counts+1) data, version 2016-08-16) (TCGA clinicalMatrix, phenotype data, version 2016-04-27) * Click on the image to enlarge it in a new window. |
 |
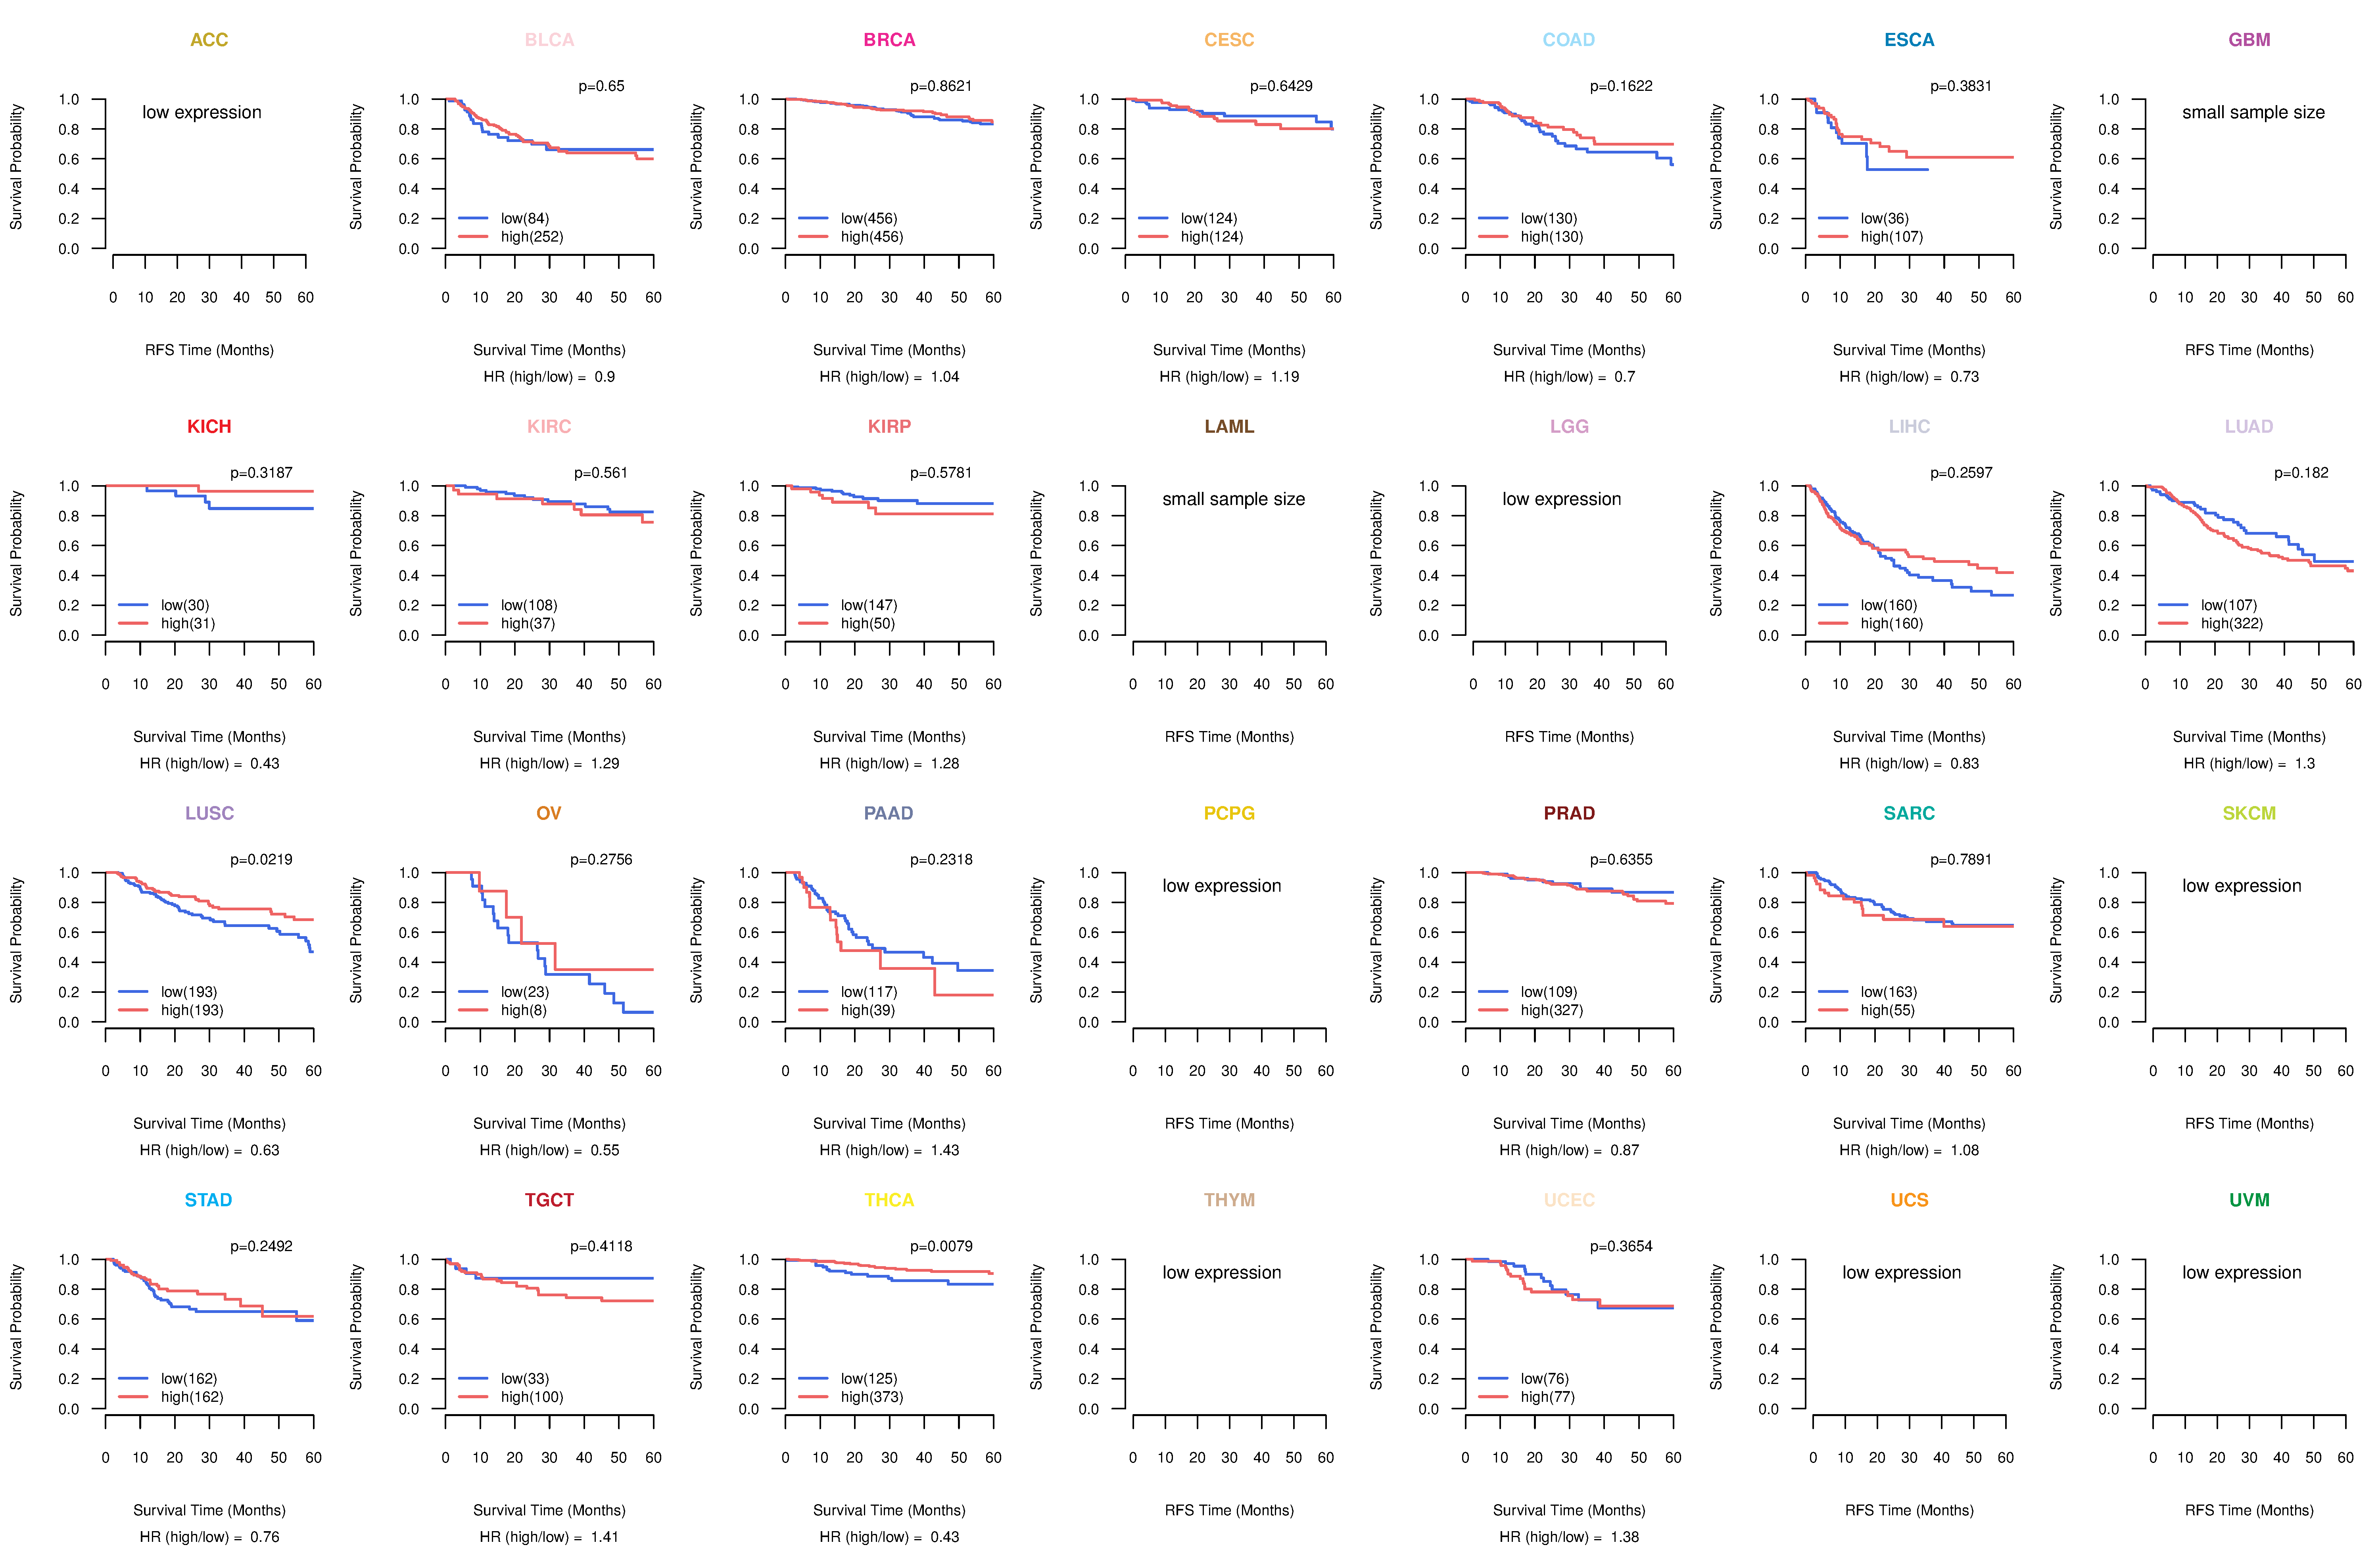
| Kaplan-Meier plots with logrank test of relapse free survival (RFS) using 28 cancer types (TCGA IlluminaHiSeq_RNASeqV2, pan-cancer normalized log2(norm_counts+1) data, version 2016-08-16) (TCGA clinicalMatrix, phenotype data, version 2016-04-27) * Click on the image enlarge it in a new window. |
 |
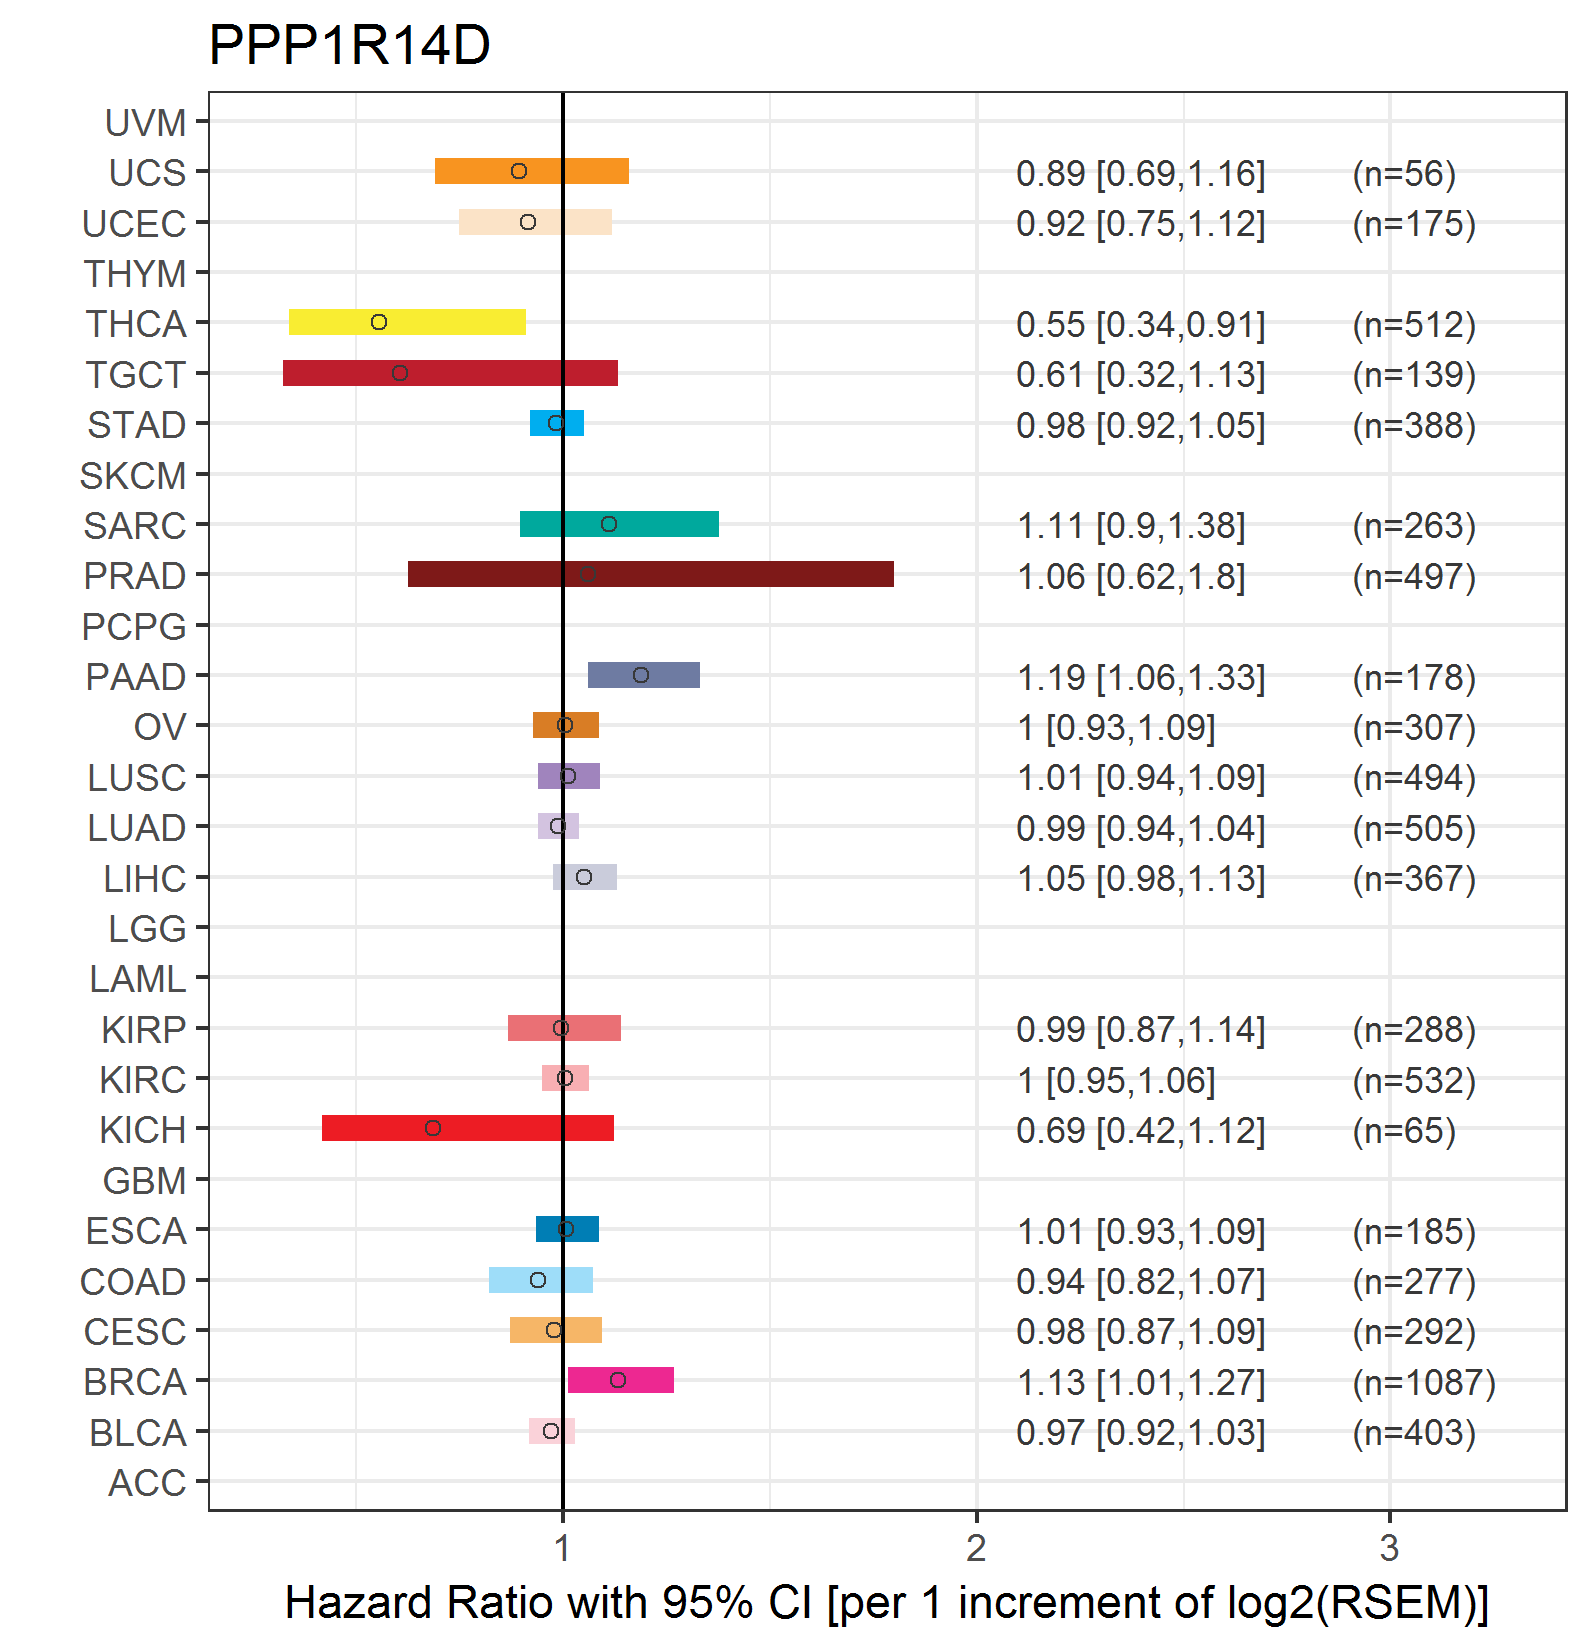
| Forest plot of Cox proportional hazard ratio (HR) and 95% CI of overall survival (OS) using 28 cancer types (TCGA IlluminaHiSeq_RNASeqV2, pan-cancer normalized log2(norm_counts+1) data, version 2016-08-16) (TCGA clinicalMatrix, phenotype data, version 2016-04-27) * Click on the image enlarge it in a new window. |
 |
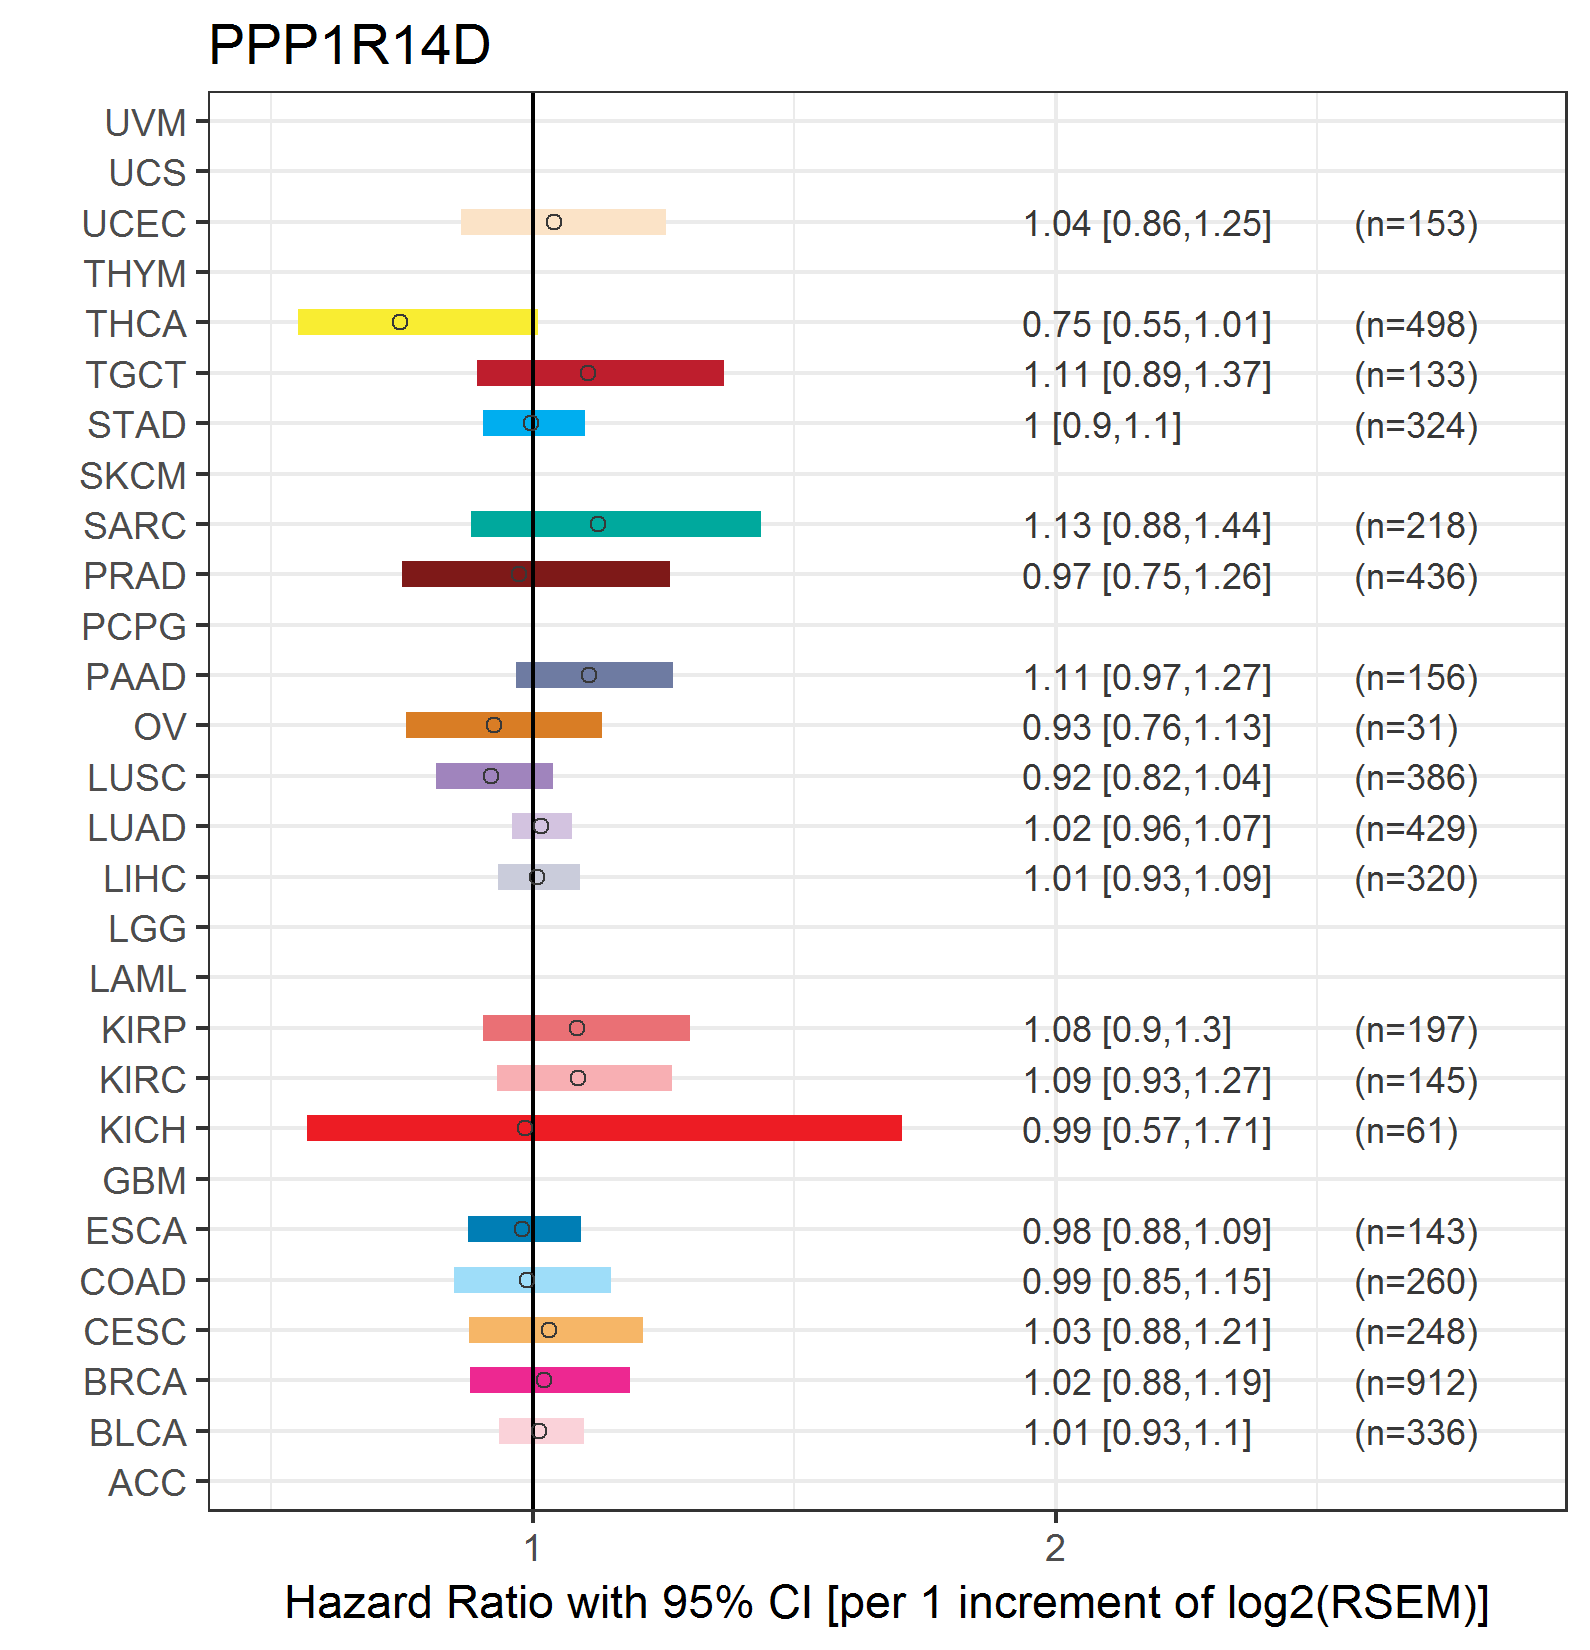
| Forest plot of Cox proportional hazard ratio (HR) and 95% CI of relapse free survival (RFS) using 28 cancer types (TCGA IlluminaHiSeq_RNASeqV2, pan-cancer normalized log2(norm_counts+1) data, version 2016-08-16) (TCGA clinicalMatrix, phenotype data, version 2016-04-27) * Click on the image enlarge it in a new window. |
 |
| Top |
| TissGeneClin for PPP1R14D |
| TissGeneDrug for PPP1R14D |
| Drug information targeting TissGene (DrugBank Version 5.0.6, 2017-04-01) |
| DrugBank ID | Drug name | Drug activity | Drug type | Drug status |
| Top |
| TissGeneDisease for PPP1R14D |
| Disease information associated with TissGene (DisGeNet, 2016-06-01) |
| Disease ID | Disease name | # pubmeds | Source |
|
Copyright 2016-Present - The University of Texas Health Science Center at Houston (UTHealth) Web File Viewing | How to Report, Fraud, Waste and Abuse | State of Texas | Statewide Search | Texas Homeland Security | Site Policies |