 |
| |
| |
| |
| |
| |
| |
|

| TissGeneSummary for ACSM5 |
 Gene summary Gene summary |
| Basic gene information | Gene symbol | ACSM5 |
| Gene name | acyl-CoA synthetase medium-chain family member 5 | |
| Synonyms | - | |
| Cytomap | UCSC genome browser: 16p12.3 | |
| Type of gene | protein-coding | |
| RefGenes | NM_017888.2, | |
| Description | acyl-coenzyme A synthetase ACSM5, mitochondrial | |
| Modification date | 20141211 | |
| dbXrefs | MIM : 614361 | |
| HGNC : HGNC | ||
| Ensembl : ENSG00000183549 | ||
| HPRD : 08627 | ||
| Vega : OTTHUMG00000131551 | ||
| Protein | UniProt: go to UniProt's Cross Reference DB Table | |
| Expression | CleanEX: HS_ACSM5 | |
| BioGPS: 54988 | ||
| Pathway | NCI Pathway Interaction Database: ACSM5 | |
| KEGG: ACSM5 | ||
| REACTOME: ACSM5 | ||
| Pathway Commons: ACSM5 | ||
| Context | iHOP: ACSM5 | |
| ligand binding site mutation search in PubMed: ACSM5 | ||
| UCL Cancer Institute: ACSM5 | ||
| Assigned class in TissGDB* | C | |
| Included tissue-specific gene expression resources | TiGER,GTEx | |
| Specific-tissues in normal samples (assigned by TissGDB using HPA, TiGER, and GTEx) | KidneyLiver | |
| Cancer types related to the specific-tissues in cancer samples (assigned by TissGDB using TCGA) | KIRC,KIRP,KICHLIHC | |
| Reference showing the relevant tissue of ACSM5 | ||
| Description by TissGene annotations | ||
| * Class A consists of genes with literature evidence and is part of the cTissGenes. Class B consists of only cTissGenes without additional evidence. The remaining genes belong to Class C. |
| Gene ontology having evidence of Inferred from Direct Assay (IDA) from Entrez |
| GO ID | GO term | PubMed ID |
| Top |
| TissGeneExp for ACSM5 |
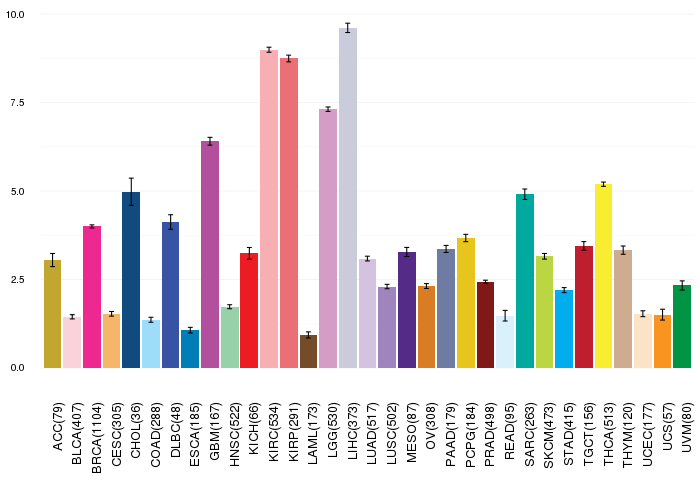
| Gene expressions across 28 cancer types (X-axis: cancer type and Y-axis: log2(norm_counts+1)) (TCGA IlluminaHiSeq_RNASeqV2, pan-cancer normalized log2(norm_counts+1) data, version 2016-08-16) |
 |
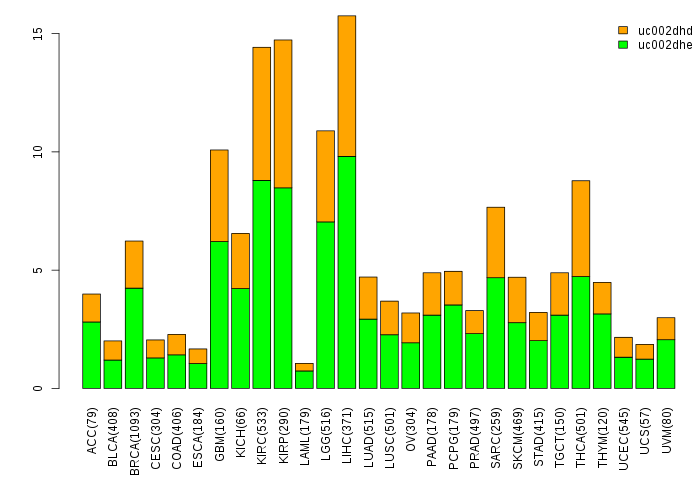
| Gene isoform expressions across 28 cancer types (X-axis: cancer type and Y-axis: log2(norm_counts+1)) (TCGA pan-cancer tcga_rsem_isoform_tpm, version 2016-09-01) |
 |
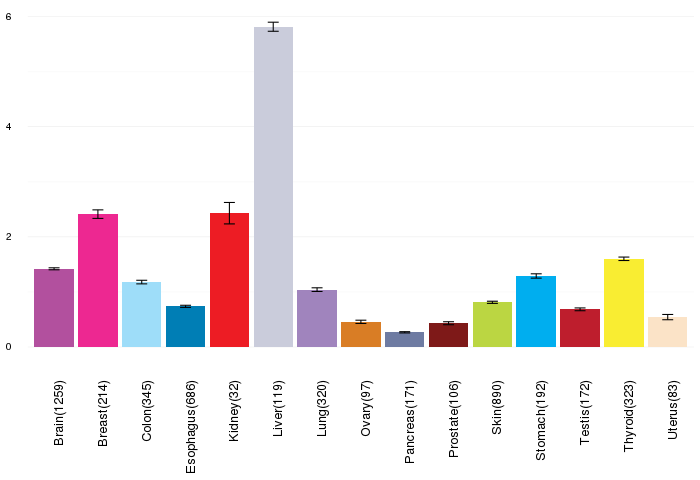
| Gene expressions across normal tissues of GTEx data (GTEx GTEx_Analysis_v6_RNA-seq_RNA-SeQCv1.1.8_gene_rpkm.gct) - Here, we shows the matched tissue types only among our 28 cancer types. |
 |
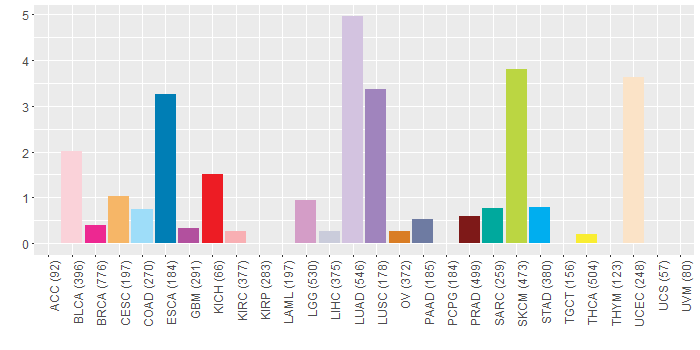
| Different expressions across 14 cancer types with more than 10 samples between matched tumors and normals (X-axis: cancer type and Y-axis: log2(norm_counts+1)) (TCGA IlluminaHiSeq_RNASeqV2, pan-cancer normalized log2(norm_counts+1) data, version 2016-08-16) |
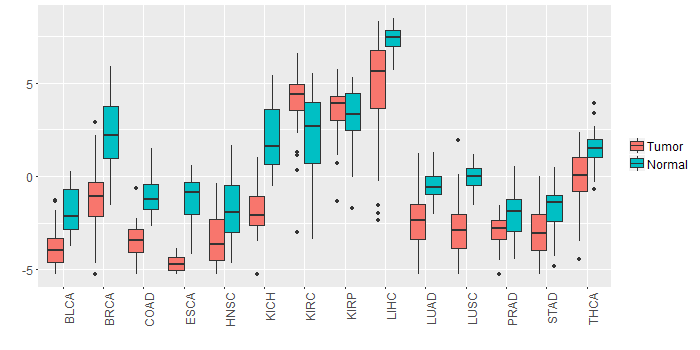 |
| - Significantly differentially expressed cancer types and information. (|Fold change|>1 and FDR<0.05) |
| Cancer type | Mean(exp) in tumor | Mean(exp) in matched normal | Log2FC | P-val. | FDR |
| LIHC | 4.66280908 | 7.38911708 | -2.726308 | 1.07E-08 | 9.28E-08 |
| COAD | -3.397737997 | -1.126184151 | -2.271553846 | 6.08E-11 | 9.06E-10 |
| BRCA | -1.168902639 | 2.332142975 | -3.501045614 | 2.09E-40 | 6.45E-39 |
| KIRC | 4.089969802 | 2.364132302 | 1.7258375 | 2.10E-08 | 6.18E-08 |
| THCA | -0.09631831 | 1.413742707 | -1.510061017 | 9.71E-10 | 5.64E-09 |
| LUAD | -2.366773541 | -0.476078713 | -1.890694828 | 3.38E-14 | 3.15E-13 |
| KICH | -1.99548692 | 1.97454108 | -3.970028 | 1.83E-12 | 2.07E-11 |
| LUSC | -2.898418842 | -0.067981587 | -2.830437255 | 1.57E-20 | 1.96E-19 |
| HNSC | -3.466754455 | -1.808466083 | -1.658288372 | 2.81E-06 | 1.88E-05 |
| STAD | -2.94207117 | -1.757686795 | -1.184384375 | 0.00171 | 0.008113481 |
| ESCA | -4.686869465 | -1.358796738 | -3.328072727 | 3.45E-05 | 0.001565878 |
| BLCA | -3.698335973 | -1.866099131 | -1.832236842 | 4.59E-05 | 0.000596968 |
| Top |
| TissGene-miRNA for ACSM5 |
| Significantly anti-correlated miRNAs of TissGene across 28 cancer types (Gene-miRNA relations from TargetScanHuman Relsease 7.1, Conserved_Site_Context_Scores.txt.zip, 06.01.2016) (TCGA IlluminaHiSeq_miRNASeq, log2(RPM+1) data, version 2016-11-21) (TCGA IlluminaHiSeq_RNASeqV2, log2(normalized_count+1) data, version 2016-08-16) (Spearman’s Rank Correlation (p-value<0.05 and coefficient<-0.25)) |
| Cancer type | miRNA id | miRNA accession | P-val. | Coeff. | # samples |
| Top |
| TissGeneMut for ACSM5 |
| TissGeneSNV for ACSM5 |
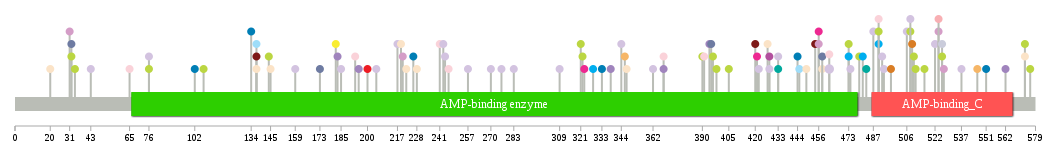
| nsSNV counts per each loci. Different colors of circles represent different cancer types. Circle size denotes number of samples. (TCGA somatic mutation (SNPs and small INDELs) data, version 2016-04-25) * Click on the image to enlarge it in a new window. |
 |
 |
| Somatic nucleotide variants of TissGene across 28 cancer types (X-axis: cancer type and Y-axis: % of mutated samples) The numbers in parentheses are numbers of samples with mutation (nsSNVs). (TCGA somatic mutation (SNPs and small INDELs) data, version 2016-04-25) |
 |
| - nsSNVs sorted by frequency. |
| AAchange | Cancer type | # samples |
| p.D462E | LUAD | 2 |
| p.P398L | SKCM | 1 |
| p.G346R | CESC | 1 |
| p.E576K | SKCM | 1 |
| p.G107R | SKCM | 1 |
| p.D462E | BLCA | 1 |
| p.P144S | SKCM | 1 |
| p.S185Y | LUAD | 1 |
| p.D473N | SKCM | 1 |
| p.E493D | LUAD | 1 |
| p.K220R | LGG | 1 |
| p.S195I | LUSC | 1 |
| p.R137W | COAD | 1 |
| p.P522T | LUAD | 1 |
| p.Q338H | LUSC | 1 |
| p.A444S | ESCA | 1 |
| p.E205K | LUAD | 1 |
| p.C183Y | LUSC | 1 |
| p.G511E | SKCM | 1 |
| p.P32L | SKCM | 1 |
| p.P508S | SKCM | 1 |
| p.Q244K | HNSC | 1 |
| p.I323F | BRCA | 1 |
| p.Q537L | LUAD | 1 |
| p.L344M | LUAD | 1 |
| p.T333N | ESCA | 1 |
| p.S246R | BLCA | 1 |
| p.G454V | PRAD | 1 |
| p.R137Q | UCEC | 1 |
| p.V474A | LUAD | 1 |
| p.G145D | UCEC | 1 |
| p.K34N | SKCM | 1 |
| p.G347* | UCEC | 1 |
| p.I509M | OV | 1 |
| p.N433D | LUAD | 1 |
| p.P76S | SKCM | 1 |
| p.R222* | UCEC | 1 |
| p.E368K | BLCA | 1 |
| p.M217I | LUAD | 1 |
| p.S526C | LIHC | 1 |
| p.P506T | LUAD | 1 |
| p.A490S | BLCA | 1 |
| p.P508H | LUAD | 1 |
| p.A134G | ESCA | 1 |
| p.V421I | BRCA | 1 |
| p.A173V | PAAD | 1 |
| p.E368G | LUSC | 1 |
| p.T322I | SKCM | 1 |
| p.R510K | SKCM | 1 |
| p.A226S | ESCA | 1 |
| p.T219A | UCEC | 1 |
| p.R458H | UCEC | 1 |
| p.P428T | LUAD | 1 |
| p.R65W | BLCA | 1 |
| p.S479N | SKCM | 1 |
| p.S391F | BLCA | 1 |
| p.Q329* | HNSC | 1 |
| p.R456Q | LGG | 1 |
| p.H527P | LGG | 1 |
| p.R257L | LUAD | 1 |
| p.E182D | THCA | 1 |
| p.G390E | SKCM | 1 |
| p.R422L | LUAD | 1 |
| p.V497A | OV | 1 |
| p.T362S | LUAD | 1 |
| p.A420T | PRAD | 1 |
| p.R456* | BRCA | 1 |
| p.T270M | LUAD | 1 |
| p.F283I | LUAD | 1 |
| p.A545T | HNSC | 1 |
| p.A490V | STAD | 1 |
| p.R427Q | UCEC | 1 |
| p.G417E | HNSC | 1 |
| p.V328A | STAD | 1 |
| p.S43R | LUAD | 1 |
| p.Q244H | LUAD | 1 |
| p.E416D | CHOL | 1 |
| p.S396F | SKCM | 1 |
| p.G483E | SARC | 1 |
| p.R456Q | READ | 1 |
| p.V31L | LGG | 1 |
| p.S445X | COAD | 1 |
| p.R551M | ESCA | 1 |
| p.Y524H | KIRC | 1 |
| p.A102T | ESCA | 1 |
| p.C20Y | UCEC | 1 |
| p.R422H | HNSC | 1 |
| p.W200X | KICH | 1 |
| p.N433S | SARC | 1 |
| p.Y228C | UCEC | 1 |
| p.S243Y | LUAD | 1 |
| p.S193* | BLCA | 1 |
| p.S526F | SKCM | 1 |
| p.K394M | LUSC | 1 |
| p.D405N | SKCM | 1 |
| p.E241Q | BLCA | 1 |
| p.P428S | GBM | 1 |
| p.Y524* | LGG | 1 |
| p.A492T | LUAD | 1 |
| p.L309F | LUAD | 1 |
| p.R481W | STAD | 1 |
| p.A395V | PAAD | 1 |
| p.Q159H | LUAD | 1 |
| p.P76T | LUAD | 1 |
| p.D449N | UCEC | 1 |
| p.R573Q | SKCM | 1 |
| p.S500L | READ | 1 |
| p.R458H | PAAD | 1 |
| p.P546T | CESC | 1 |
| p.A516T | SKCM | 1 |
| p.D170N | HNSC | 1 |
| p.D473N | STAD | 1 |
| p.P32H | PAAD | 1 |
| p.V276L | LUAD | 1 |
| p.P321S | SKCM | 1 |
| p.T562R | LUSC | 1 |
| p.R573* | UCEC | 1 |
| p.A490V | SKCM | 1 |
| p.V487L | LUAD | 1 |
| p.R137Q | PRAD | 1 |
| Top |
| TissGeneCNV for ACSM5 |
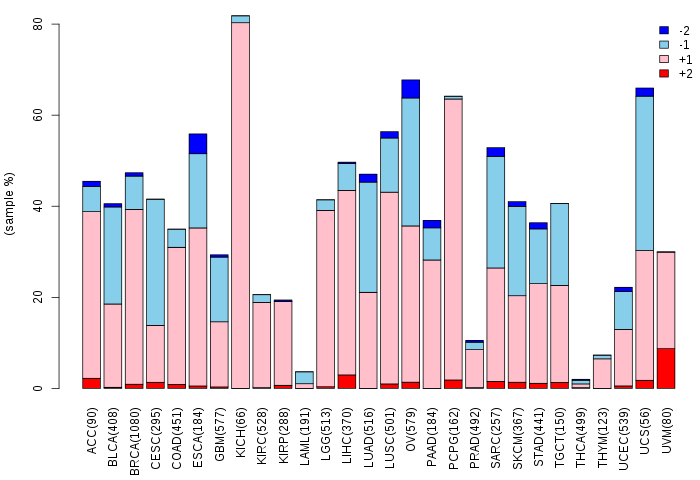
| Copy number variations of TissGene across 28 cancer types (X-axis: cancer type and Y-axis: % of CNV samples) (TCGA Gistic2_CopyNumber_Gistic2_all_data_by_genes, Gistic2 copy number data, version 2016-08-16) |
 |
| Top |
| TissGeneFusions for ACSM5 |
| Fusion genes including TissGene (ChimerDB 3.0, 2016-12-01 and TCGA fusion Portal 2015-12-01) |
| Database | Src | Cancer type | Sample | Fusion gene | ORF | 5'-gene BP | 3'-gene BP |
| Top |
| TissGeneNet for ACSM5 |
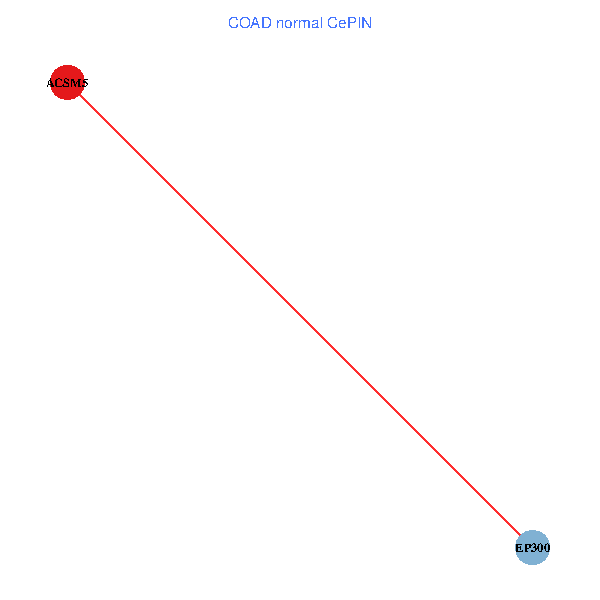
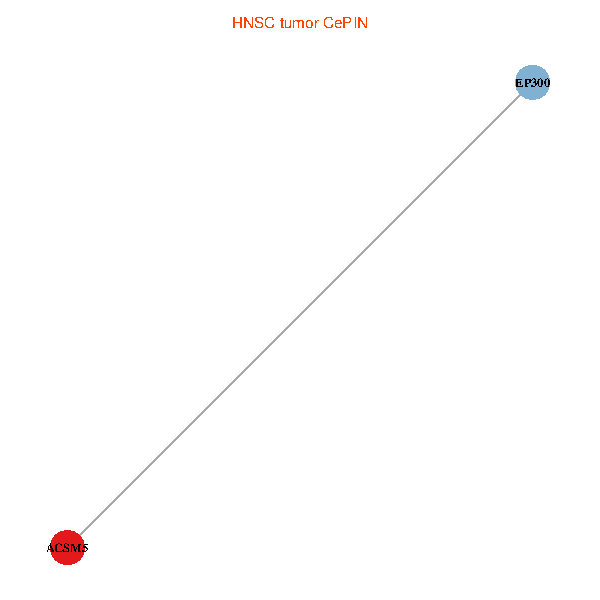
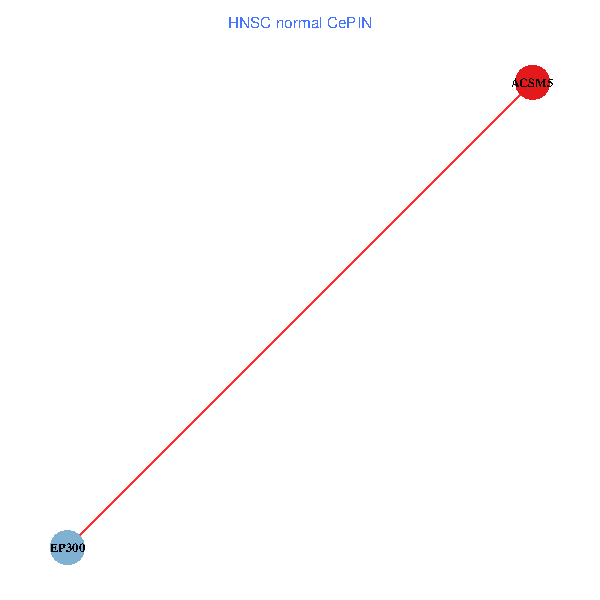
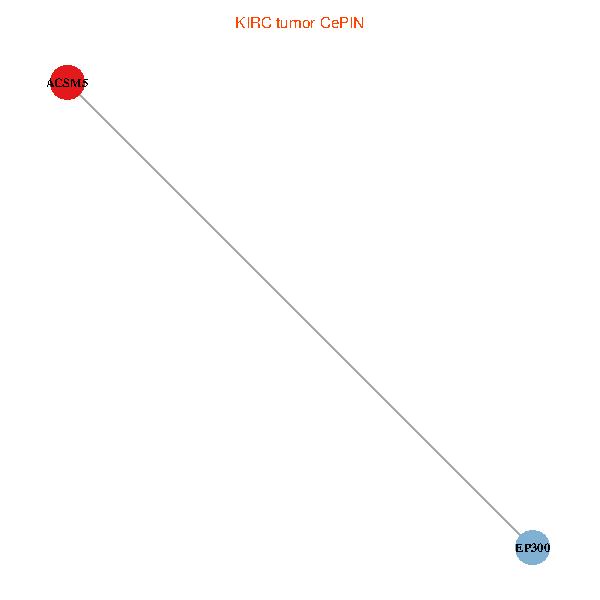
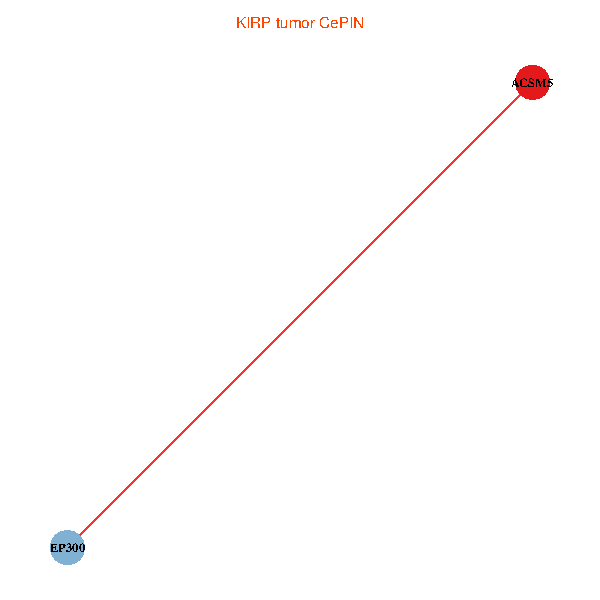
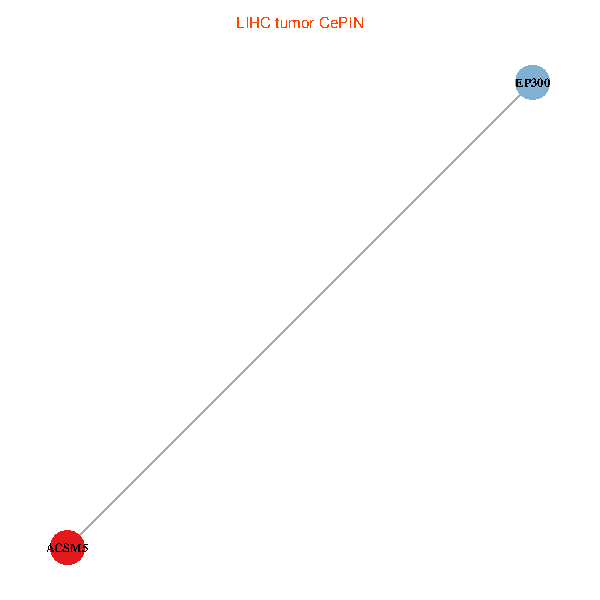
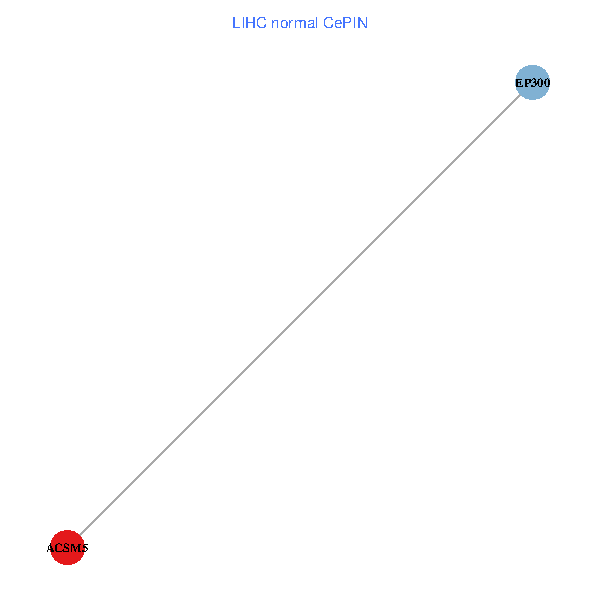
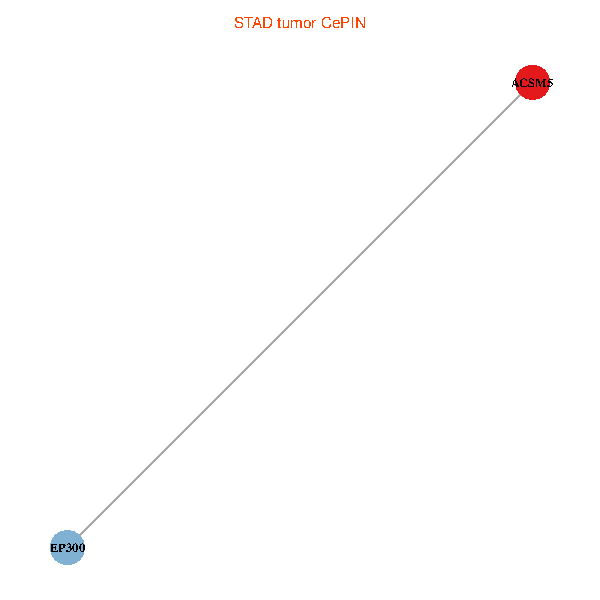
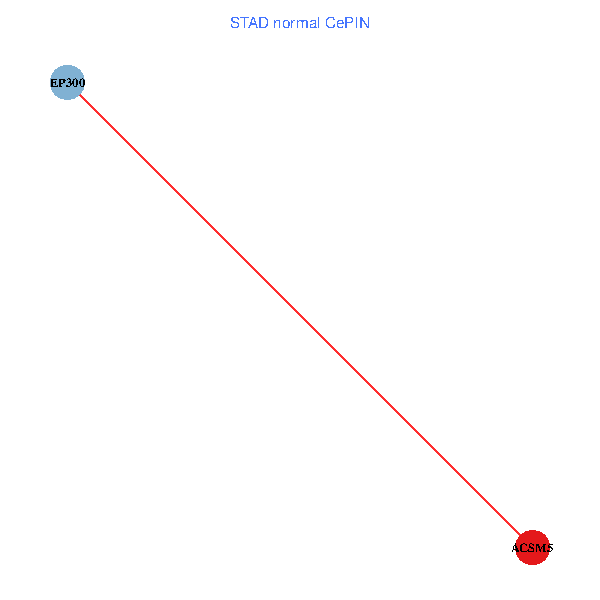
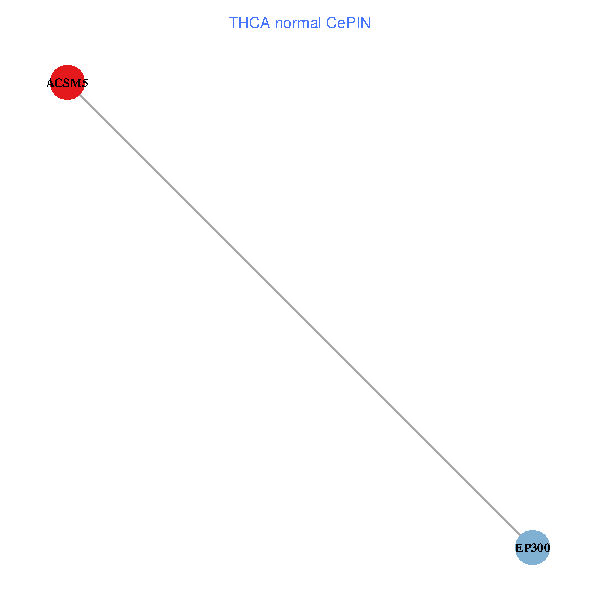
| Co-expressed gene networks based on protein-protein interaction data (CePIN) (TCGA IlluminaHiSeq_RNASeqV2, pan-cancer normalized log2(norm_counts+1) data, version 2016-08-16) (PINA2 ppi data) |
| BRCA (tumor) | BRCA (normal) |
| ACSM5, EP300 (tumor) | ACSM5, EP300 (normal) |
 |  |
| COAD (tumor) | COAD (normal) |
| ACSM5, EP300 (tumor) | ACSM5, EP300 (normal) |
 |  |
| HNSC (tumor) | HNSC (normal) |
| ACSM5, EP300 (tumor) | ACSM5, EP300 (normal) |
 |  |
| KICH (tumor) | KICH (normal) |
| ACSM5, EP300 (tumor) | ACSM5, EP300 (normal) |
 |  |
| KIRC (tumor) | KIRC (normal) |
| ACSM5, EP300 (tumor) | ACSM5, EP300 (normal) |
 |  |
| KIRP (tumor) | KIRP (normal) |
| ACSM5, EP300 (tumor) | ACSM5, EP300 (normal) |
 |  |
| LIHC (tumor) | LIHC (normal) |
| ACSM5, EP300 (tumor) | ACSM5, EP300 (normal) |
 |  |
| LUAD (tumor) | LUAD (normal) |
| ACSM5, EP300 (tumor) | ACSM5, EP300 (normal) |
 |  |
| LUSC (tumor) | LUSC (normal) |
| ACSM5, EP300 (tumor) | ACSM5, EP300 (normal) |
 |  |
| PRAD (tumor) | PRAD (normal) |
| ACSM5, EP300 (tumor) | ACSM5, EP300 (normal) |
 |  |
| STAD (tumor) | STAD (normal) |
| ACSM5, EP300 (tumor) | ACSM5, EP300 (normal) |
 |  |
| THCA (tumor) | THCA (normal) |
| ACSM5, EP300 (tumor) | ACSM5, EP300 (normal) |
 |  |
| Top |
| TissGeneProg for ACSM5 |
| Kaplan-Meier plots with logrank tests of overall survival (OS) using 28 cancer types (TCGA IlluminaHiSeq_RNASeqV2, pan-cancer normalized log2(norm_counts+1) data, version 2016-08-16) (TCGA clinicalMatrix, phenotype data, version 2016-04-27) * Click on the image to enlarge it in a new window. |
 |
| Kaplan-Meier plots with logrank test of relapse free survival (RFS) using 28 cancer types (TCGA IlluminaHiSeq_RNASeqV2, pan-cancer normalized log2(norm_counts+1) data, version 2016-08-16) (TCGA clinicalMatrix, phenotype data, version 2016-04-27) * Click on the image enlarge it in a new window. |
 |
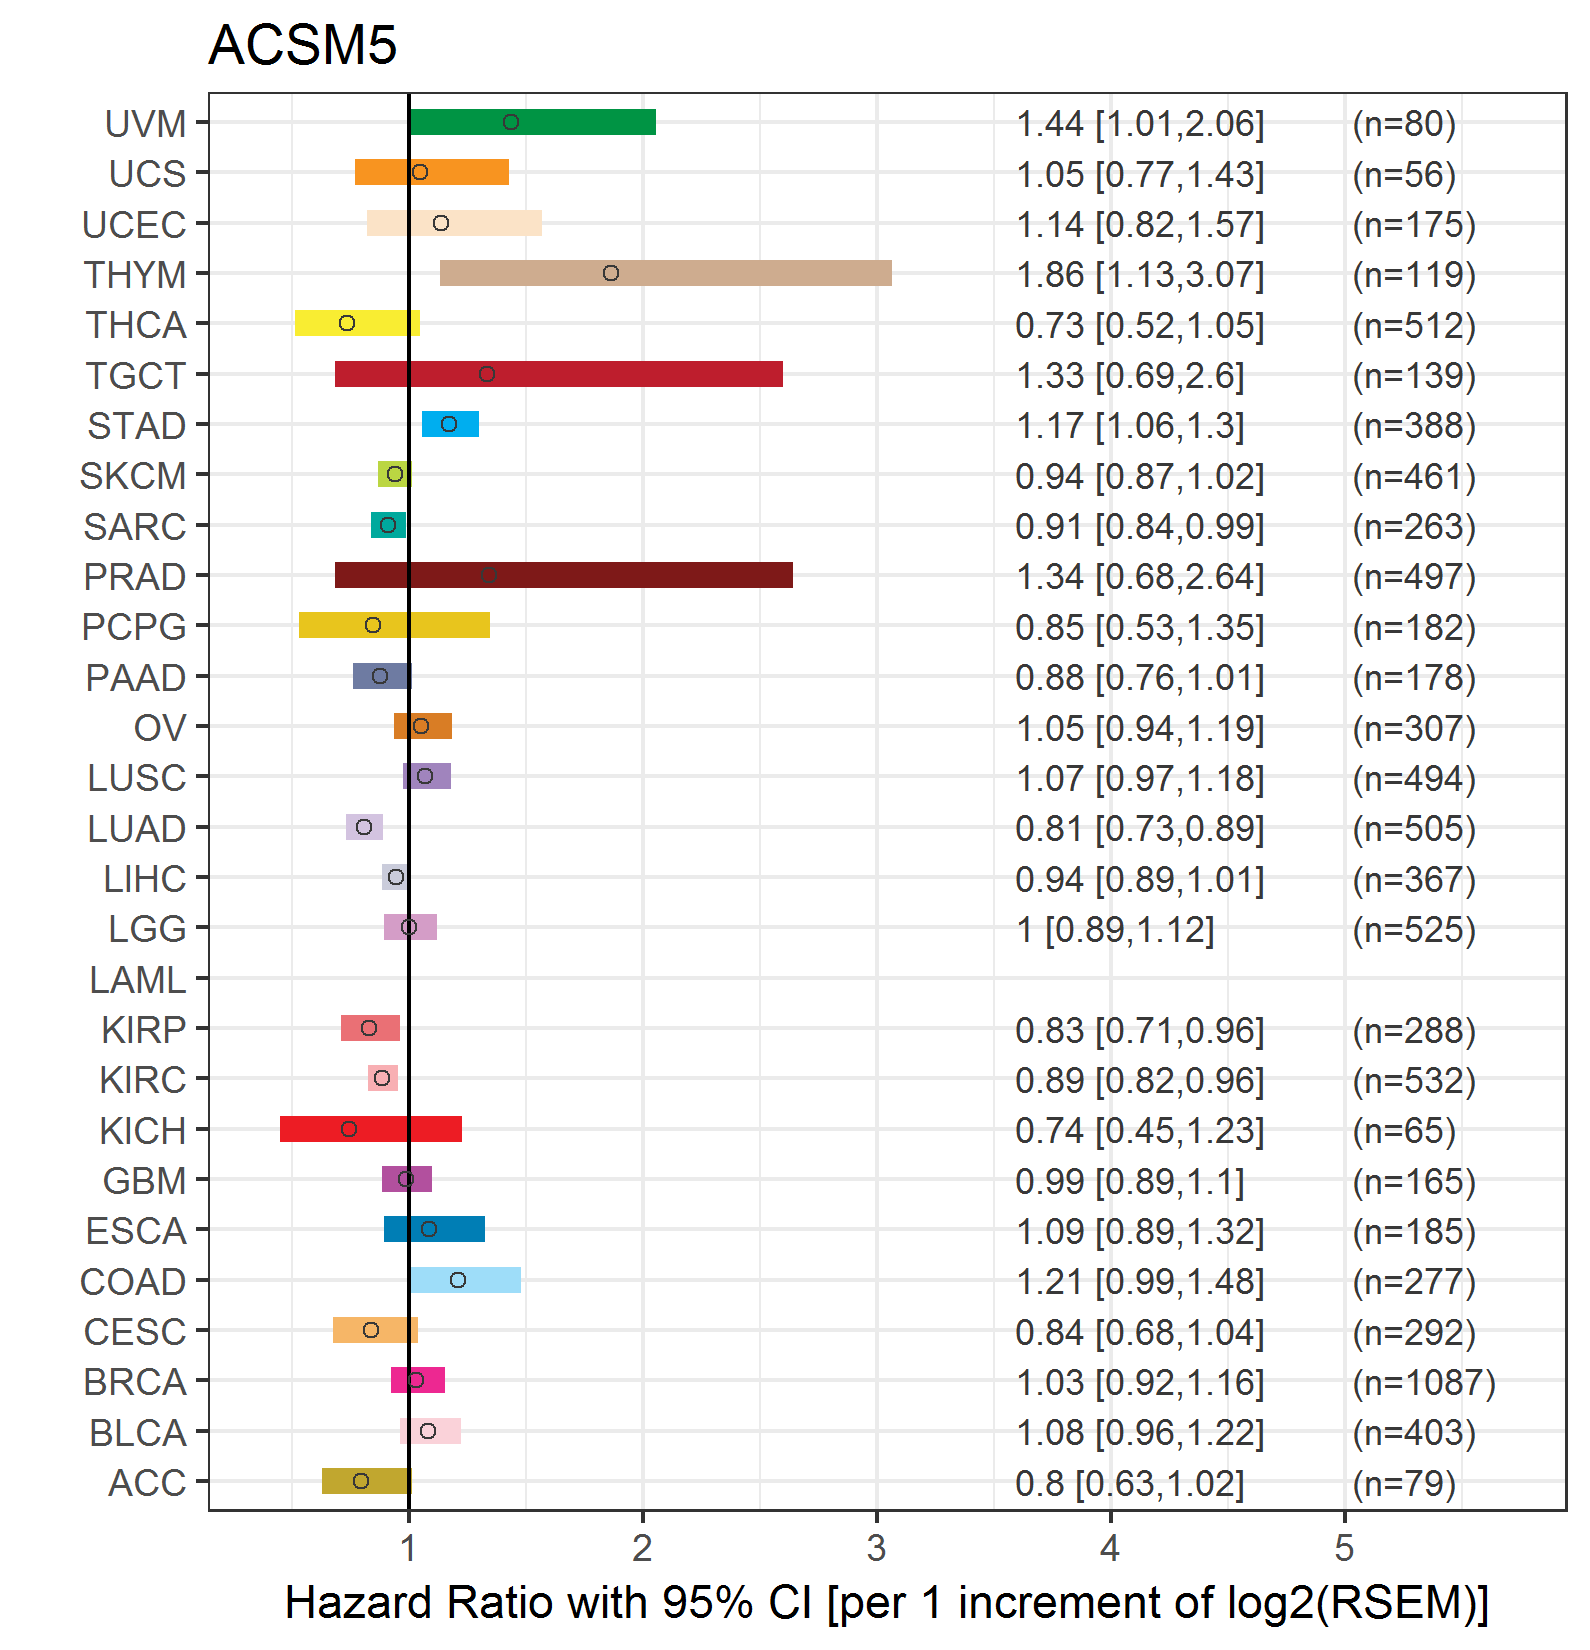
| Forest plot of Cox proportional hazard ratio (HR) and 95% CI of overall survival (OS) using 28 cancer types (TCGA IlluminaHiSeq_RNASeqV2, pan-cancer normalized log2(norm_counts+1) data, version 2016-08-16) (TCGA clinicalMatrix, phenotype data, version 2016-04-27) * Click on the image enlarge it in a new window. |
 |
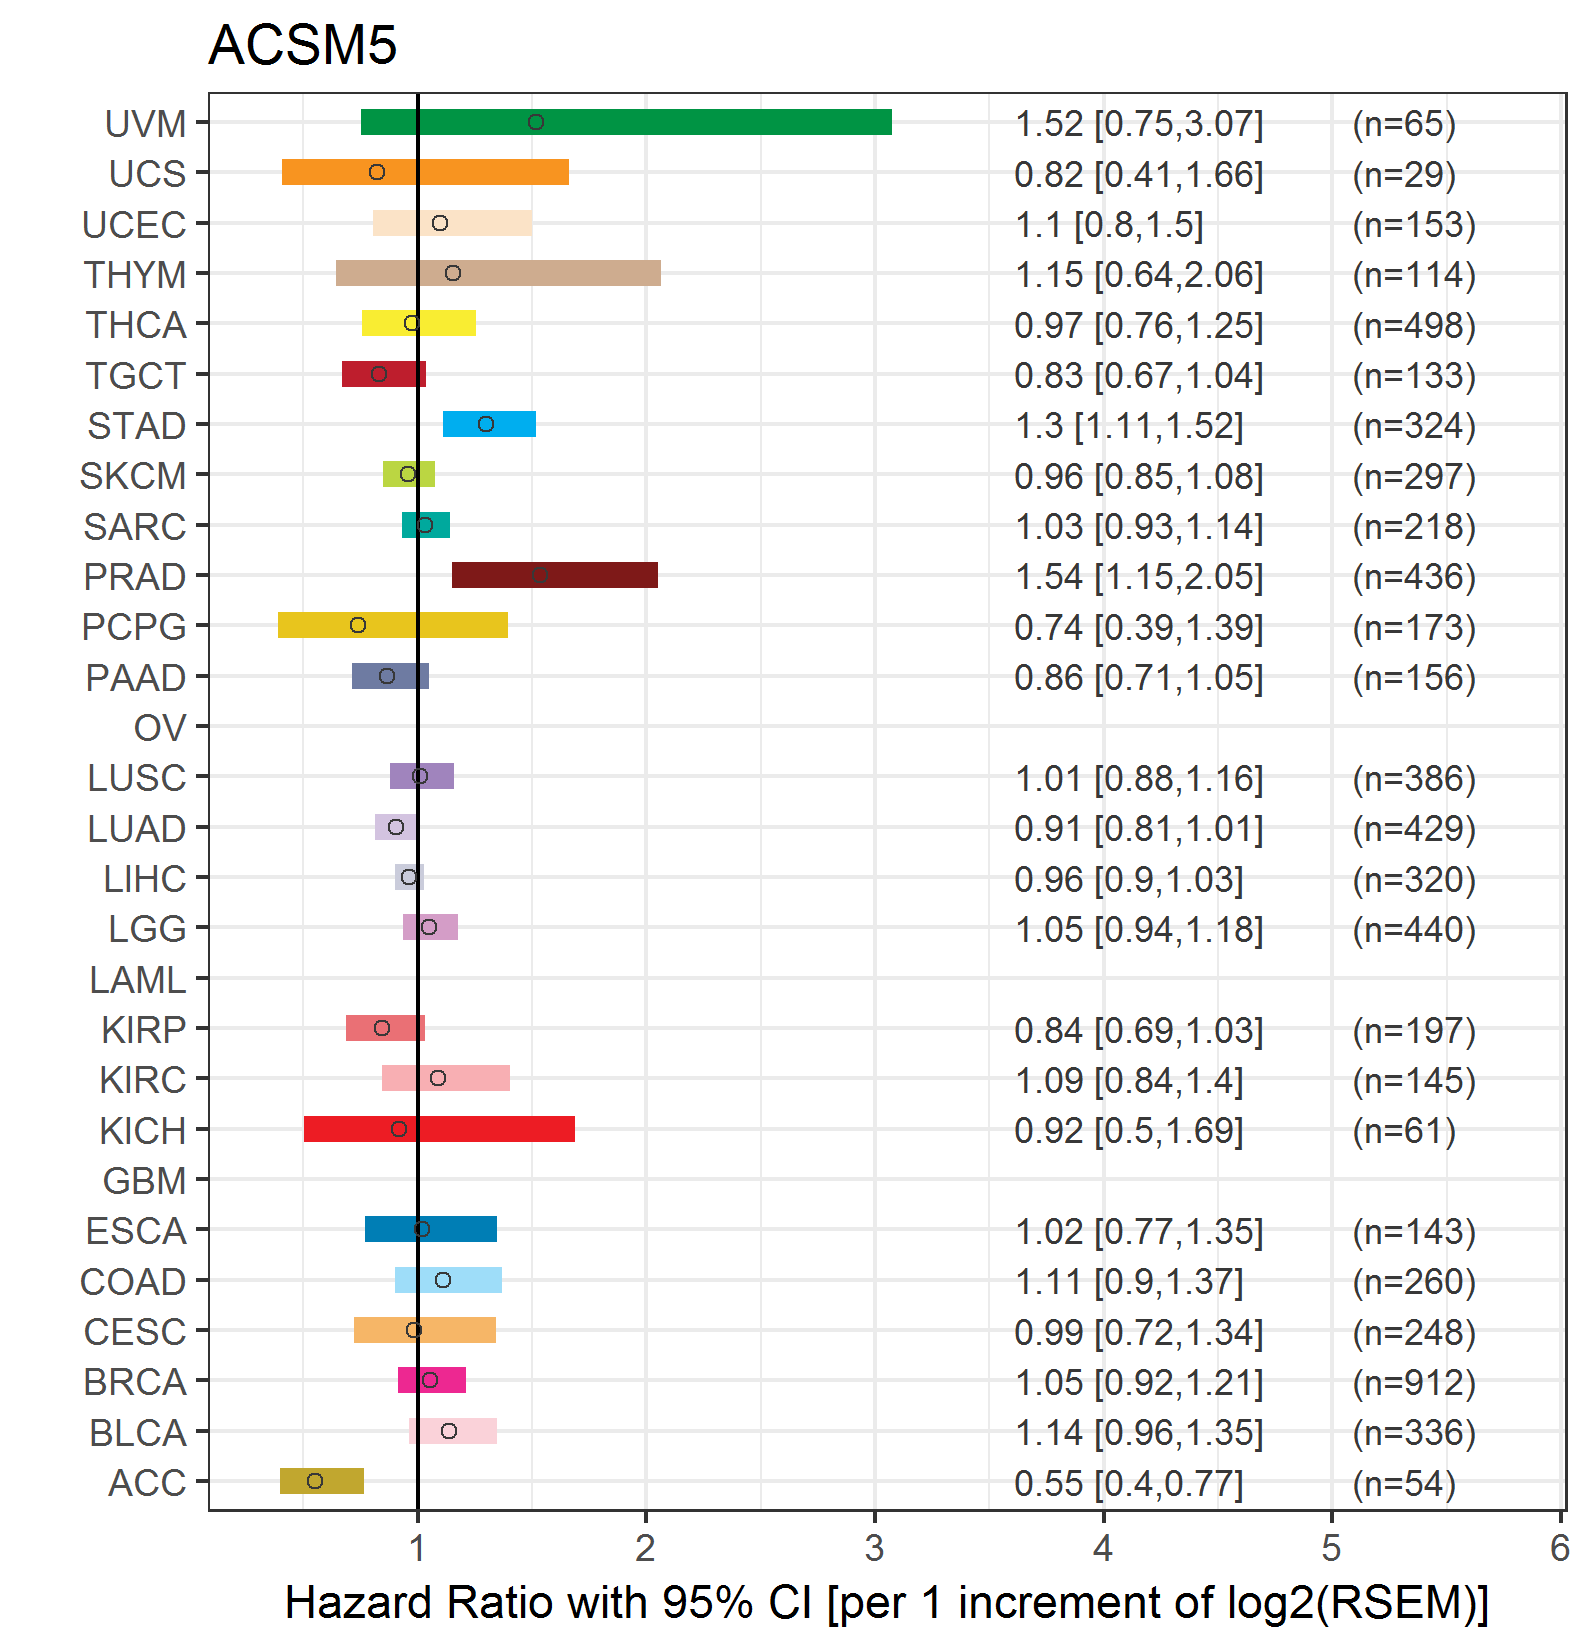
| Forest plot of Cox proportional hazard ratio (HR) and 95% CI of relapse free survival (RFS) using 28 cancer types (TCGA IlluminaHiSeq_RNASeqV2, pan-cancer normalized log2(norm_counts+1) data, version 2016-08-16) (TCGA clinicalMatrix, phenotype data, version 2016-04-27) * Click on the image enlarge it in a new window. |
 |
| Top |
| TissGeneClin for ACSM5 |
| TissGeneDrug for ACSM5 |
| Drug information targeting TissGene (DrugBank Version 5.0.6, 2017-04-01) |
| DrugBank ID | Drug name | Drug activity | Drug type | Drug status |
| Top |
| TissGeneDisease for ACSM5 |
| Disease information associated with TissGene (DisGeNet, 2016-06-01) |
| Disease ID | Disease name | # pubmeds | Source |
|
Copyright 2016-Present - The University of Texas Health Science Center at Houston (UTHealth) Web File Viewing | How to Report, Fraud, Waste and Abuse | State of Texas | Statewide Search | Texas Homeland Security | Site Policies |