 |
| |
| |
| |
| |
| |
| |
|

| TissGeneSummary for KLHDC8A |
 Gene summary Gene summary |
| Basic gene information | Gene symbol | KLHDC8A |
| Gene name | kelch domain containing 8A | |
| Synonyms | - | |
| Cytomap | UCSC genome browser: 1q32.1 | |
| Type of gene | protein-coding | |
| RefGenes | NM_001271863.1, NM_001271864.1,NM_001271865.1,NM_018203.2, | |
| Description | S-delta-E1kelch domain-containing protein 8Asubstitute for delta-EGFR expression 1 | |
| Modification date | 20141207 | |
| dbXrefs | MIM : 614503 | |
| HGNC : HGNC | ||
| Ensembl : ENSG00000162873 | ||
| HPRD : 07696 | ||
| Vega : OTTHUMG00000037199 | ||
| Protein | UniProt: go to UniProt's Cross Reference DB Table | |
| Expression | CleanEX: HS_KLHDC8A | |
| BioGPS: 55220 | ||
| Pathway | NCI Pathway Interaction Database: KLHDC8A | |
| KEGG: KLHDC8A | ||
| REACTOME: KLHDC8A | ||
| Pathway Commons: KLHDC8A | ||
| Context | iHOP: KLHDC8A | |
| ligand binding site mutation search in PubMed: KLHDC8A | ||
| UCL Cancer Institute: KLHDC8A | ||
| Assigned class in TissGDB* | C | |
| Included tissue-specific gene expression resources | HPA,GTEx | |
| Specific-tissues in normal samples (assigned by TissGDB using HPA, TiGER, and GTEx) | Ovary | |
| Cancer types related to the specific-tissues in cancer samples (assigned by TissGDB using TCGA) | OV | |
| Reference showing the relevant tissue of KLHDC8A | ||
| Description by TissGene annotations | Have significant anti-correlated miRNA | |
| * Class A consists of genes with literature evidence and is part of the cTissGenes. Class B consists of only cTissGenes without additional evidence. The remaining genes belong to Class C. |
| Gene ontology having evidence of Inferred from Direct Assay (IDA) from Entrez |
| GO ID | GO term | PubMed ID |
| Top |
| TissGeneExp for KLHDC8A |
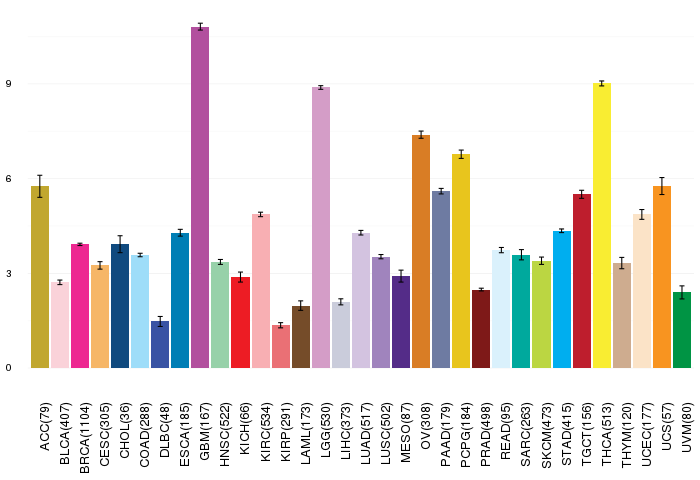
| Gene expressions across 28 cancer types (X-axis: cancer type and Y-axis: log2(norm_counts+1)) (TCGA IlluminaHiSeq_RNASeqV2, pan-cancer normalized log2(norm_counts+1) data, version 2016-08-16) |
 |
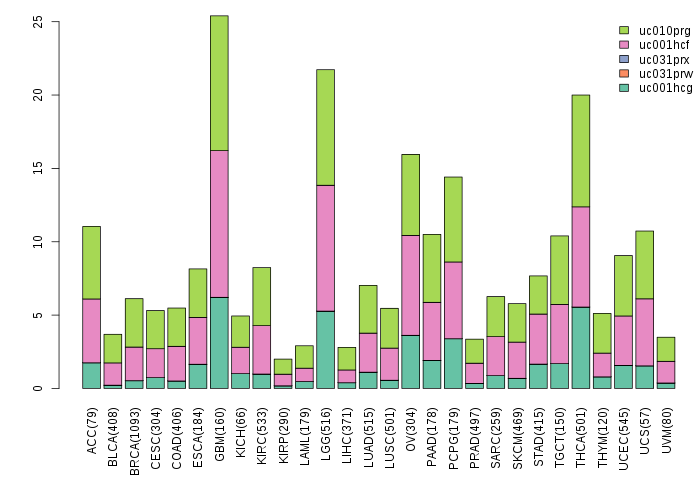
| Gene isoform expressions across 28 cancer types (X-axis: cancer type and Y-axis: log2(norm_counts+1)) (TCGA pan-cancer tcga_rsem_isoform_tpm, version 2016-09-01) |
 |
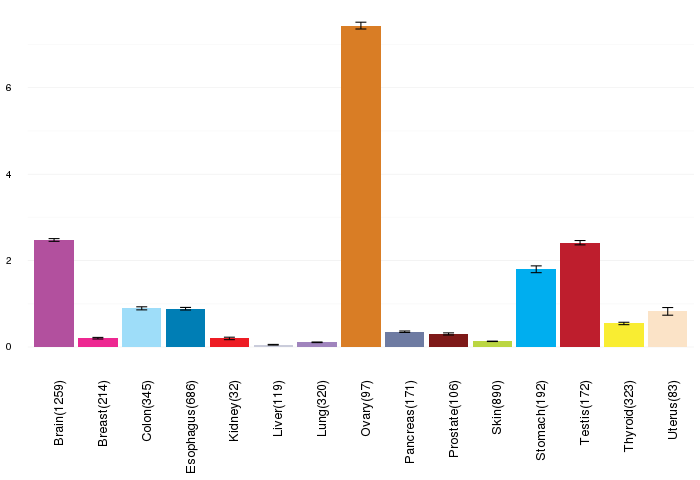
| Gene expressions across normal tissues of GTEx data (GTEx GTEx_Analysis_v6_RNA-seq_RNA-SeQCv1.1.8_gene_rpkm.gct) - Here, we shows the matched tissue types only among our 28 cancer types. |
 |
| Different expressions across 14 cancer types with more than 10 samples between matched tumors and normals (X-axis: cancer type and Y-axis: log2(norm_counts+1)) (TCGA IlluminaHiSeq_RNASeqV2, pan-cancer normalized log2(norm_counts+1) data, version 2016-08-16) |
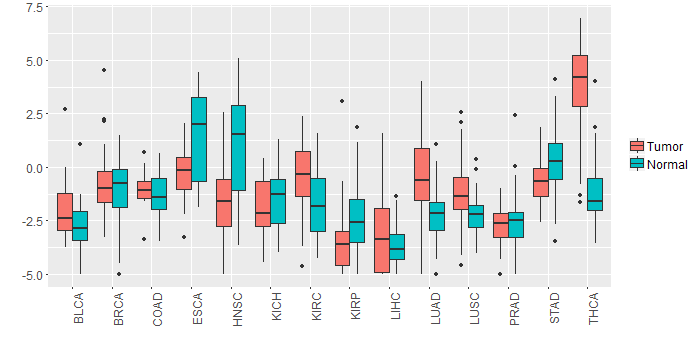 |
| - Significantly differentially expressed cancer types and information. (|Fold change|>1 and FDR<0.05) |
| Cancer type | Mean(exp) in tumor | Mean(exp) in matched normal | Log2FC | P-val. | FDR |
| LUAD | -0.264641797 | -2.233900417 | 1.969258621 | 1.27E-09 | 6.62E-09 |
| KIRC | -0.382925657 | -1.738477046 | 1.355551389 | 1.79E-07 | 4.89E-07 |
| LUSC | -1.211427699 | -2.299517895 | 1.088090196 | 1.53E-05 | 3.42E-05 |
| THCA | 3.832711184 | -1.174193901 | 5.006905085 | 3.06E-29 | 2.26E-26 |
| HNSC | -1.662925237 | 0.863318949 | -2.526244186 | 2.27E-07 | 2.03E-06 |
| KIRP | -3.463178434 | -2.278472184 | -1.18470625 | 0.0062 | 0.014300823 |
| STAD | -0.663456559 | 0.436377816 | -1.099834375 | 0.00203 | 0.009260588 |
| Top |
| TissGene-miRNA for KLHDC8A |
| Significantly anti-correlated miRNAs of TissGene across 28 cancer types (Gene-miRNA relations from TargetScanHuman Relsease 7.1, Conserved_Site_Context_Scores.txt.zip, 06.01.2016) (TCGA IlluminaHiSeq_miRNASeq, log2(RPM+1) data, version 2016-11-21) (TCGA IlluminaHiSeq_RNASeqV2, log2(normalized_count+1) data, version 2016-08-16) (Spearman’s Rank Correlation (p-value<0.05 and coefficient<-0.25)) |
| Cancer type | miRNA id | miRNA accession | P-val. | Coeff. | # samples |
| ACC | hsa-miR-454-3p | MIMAT0003885 | 0.0051 | -0.32 | 78 |
| ACC | hsa-miR-454-3p | MIMAT0003885 | 0.0051 | -0.32 | 78 |
| UCS | hsa-miR-377-3p | MIMAT0000730 | 0.027 | -0.32 | 56 |
| Top |
| TissGeneMut for KLHDC8A |
| TissGeneSNV for KLHDC8A |
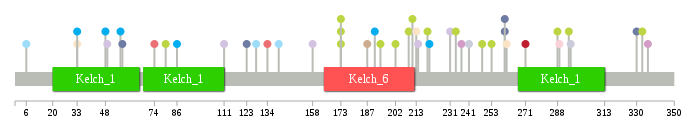
| nsSNV counts per each loci. Different colors of circles represent different cancer types. Circle size denotes number of samples. (TCGA somatic mutation (SNPs and small INDELs) data, version 2016-04-25) * Click on the image to enlarge it in a new window. |
 |
 |
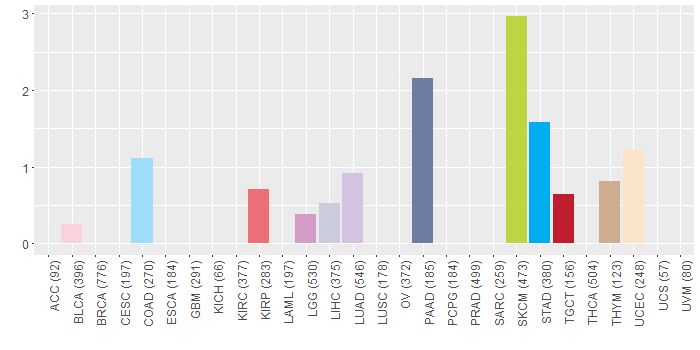
| Somatic nucleotide variants of TissGene across 28 cancer types (X-axis: cancer type and Y-axis: % of mutated samples) The numbers in parentheses are numbers of samples with mutation (nsSNVs). (TCGA somatic mutation (SNPs and small INDELs) data, version 2016-04-25) |
 |
| - nsSNVs sorted by frequency. |
| AAchange | Cancer type | # samples |
| p.T219I | SKCM | 1 |
| p.A330T | HNSC | 1 |
| p.D153E | HNSC | 1 |
| p.V74I | KIRP | 1 |
| p.V331M | HNSC | 1 |
| p.R140H | COAD | 1 |
| p.F49L | LUAD | 1 |
| p.R80Q | SKCM | 1 |
| p.Q289* | HNSC | 1 |
| p.Q336H | LGG | 1 |
| p.F248Y | SKCM | 1 |
| p.F214V | LUAD | 1 |
| p.E294K | SKCM | 1 |
| p.R234C | SKCM | 1 |
| p.G134R | KIRP | 1 |
| p.A330T | PAAD | 1 |
| p.R173X | SKCM | 1 |
| p.R173Q | SKCM | 1 |
| p.A213V | UCEC | 1 |
| p.W202* | SKCM | 1 |
| p.R260X | PAAD | 1 |
| p.A191T | STAD | 1 |
| p.S111N | LUAD | 1 |
| p.F241L | LIHC | 1 |
| p.Q289E | BLCA | 1 |
| p.S261* | UCEC | 1 |
| p.R173* | SKCM | 1 |
| p.V194I | SKCM | 1 |
| p.R128Q | COAD | 1 |
| p.E307Q | MESO | 1 |
| p.C48Y | STAD | 1 |
| p.D57N | PAAD | 1 |
| p.V33A | UCEC | 1 |
| p.R260* | PAAD | 1 |
| p.V6A | COAD | 1 |
| p.F271L | TGCT | 1 |
| p.L220M | STAD | 1 |
| p.V33I | STAD | 1 |
| p.P160L | HNSC | 1 |
| p.N288S | SKCM | 1 |
| p.Y187X | THYM | 1 |
| p.R231P | LUAD | 1 |
| p.P209L | SKCM | 1 |
| p.L158I | LUAD | 1 |
| p.G86C | STAD | 1 |
| p.T295M | LIHC | 1 |
| p.R260* | HNSC | 1 |
| p.K211R | SKCM | 1 |
| p.T123M | PAAD | 1 |
| p.G253E | SKCM | 1 |
| p.L309F | HNSC | 1 |
| p.R237W | LGG | 1 |
| p.G333S | SKCM | 1 |
| p.A56D | STAD | 1 |
| Top |
| TissGeneCNV for KLHDC8A |
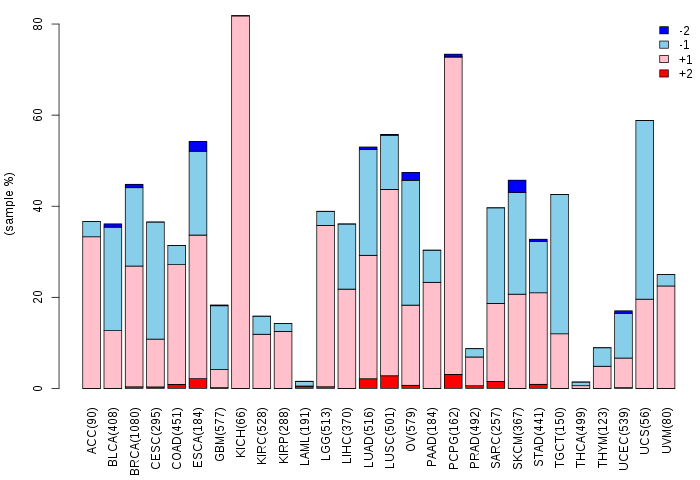
| Copy number variations of TissGene across 28 cancer types (X-axis: cancer type and Y-axis: % of CNV samples) (TCGA Gistic2_CopyNumber_Gistic2_all_data_by_genes, Gistic2 copy number data, version 2016-08-16) |
 |
| Top |
| TissGeneFusions for KLHDC8A |
| Fusion genes including TissGene (ChimerDB 3.0, 2016-12-01 and TCGA fusion Portal 2015-12-01) |
| Database | Src | Cancer type | Sample | Fusion gene | ORF | 5'-gene BP | 3'-gene BP |
| TCGAfusionPortal | PRADA | OV | TCGA-29-2427-01A | PCMTD1-KLHDC8A | 5UTR-5UTR | Chr8:52811490 | Chr1:205312921 |
| Top |
| TissGeneNet for KLHDC8A |
| Co-expressed gene networks based on protein-protein interaction data (CePIN) (TCGA IlluminaHiSeq_RNASeqV2, pan-cancer normalized log2(norm_counts+1) data, version 2016-08-16) (PINA2 ppi data) |
| Top |
| TissGeneProg for KLHDC8A |
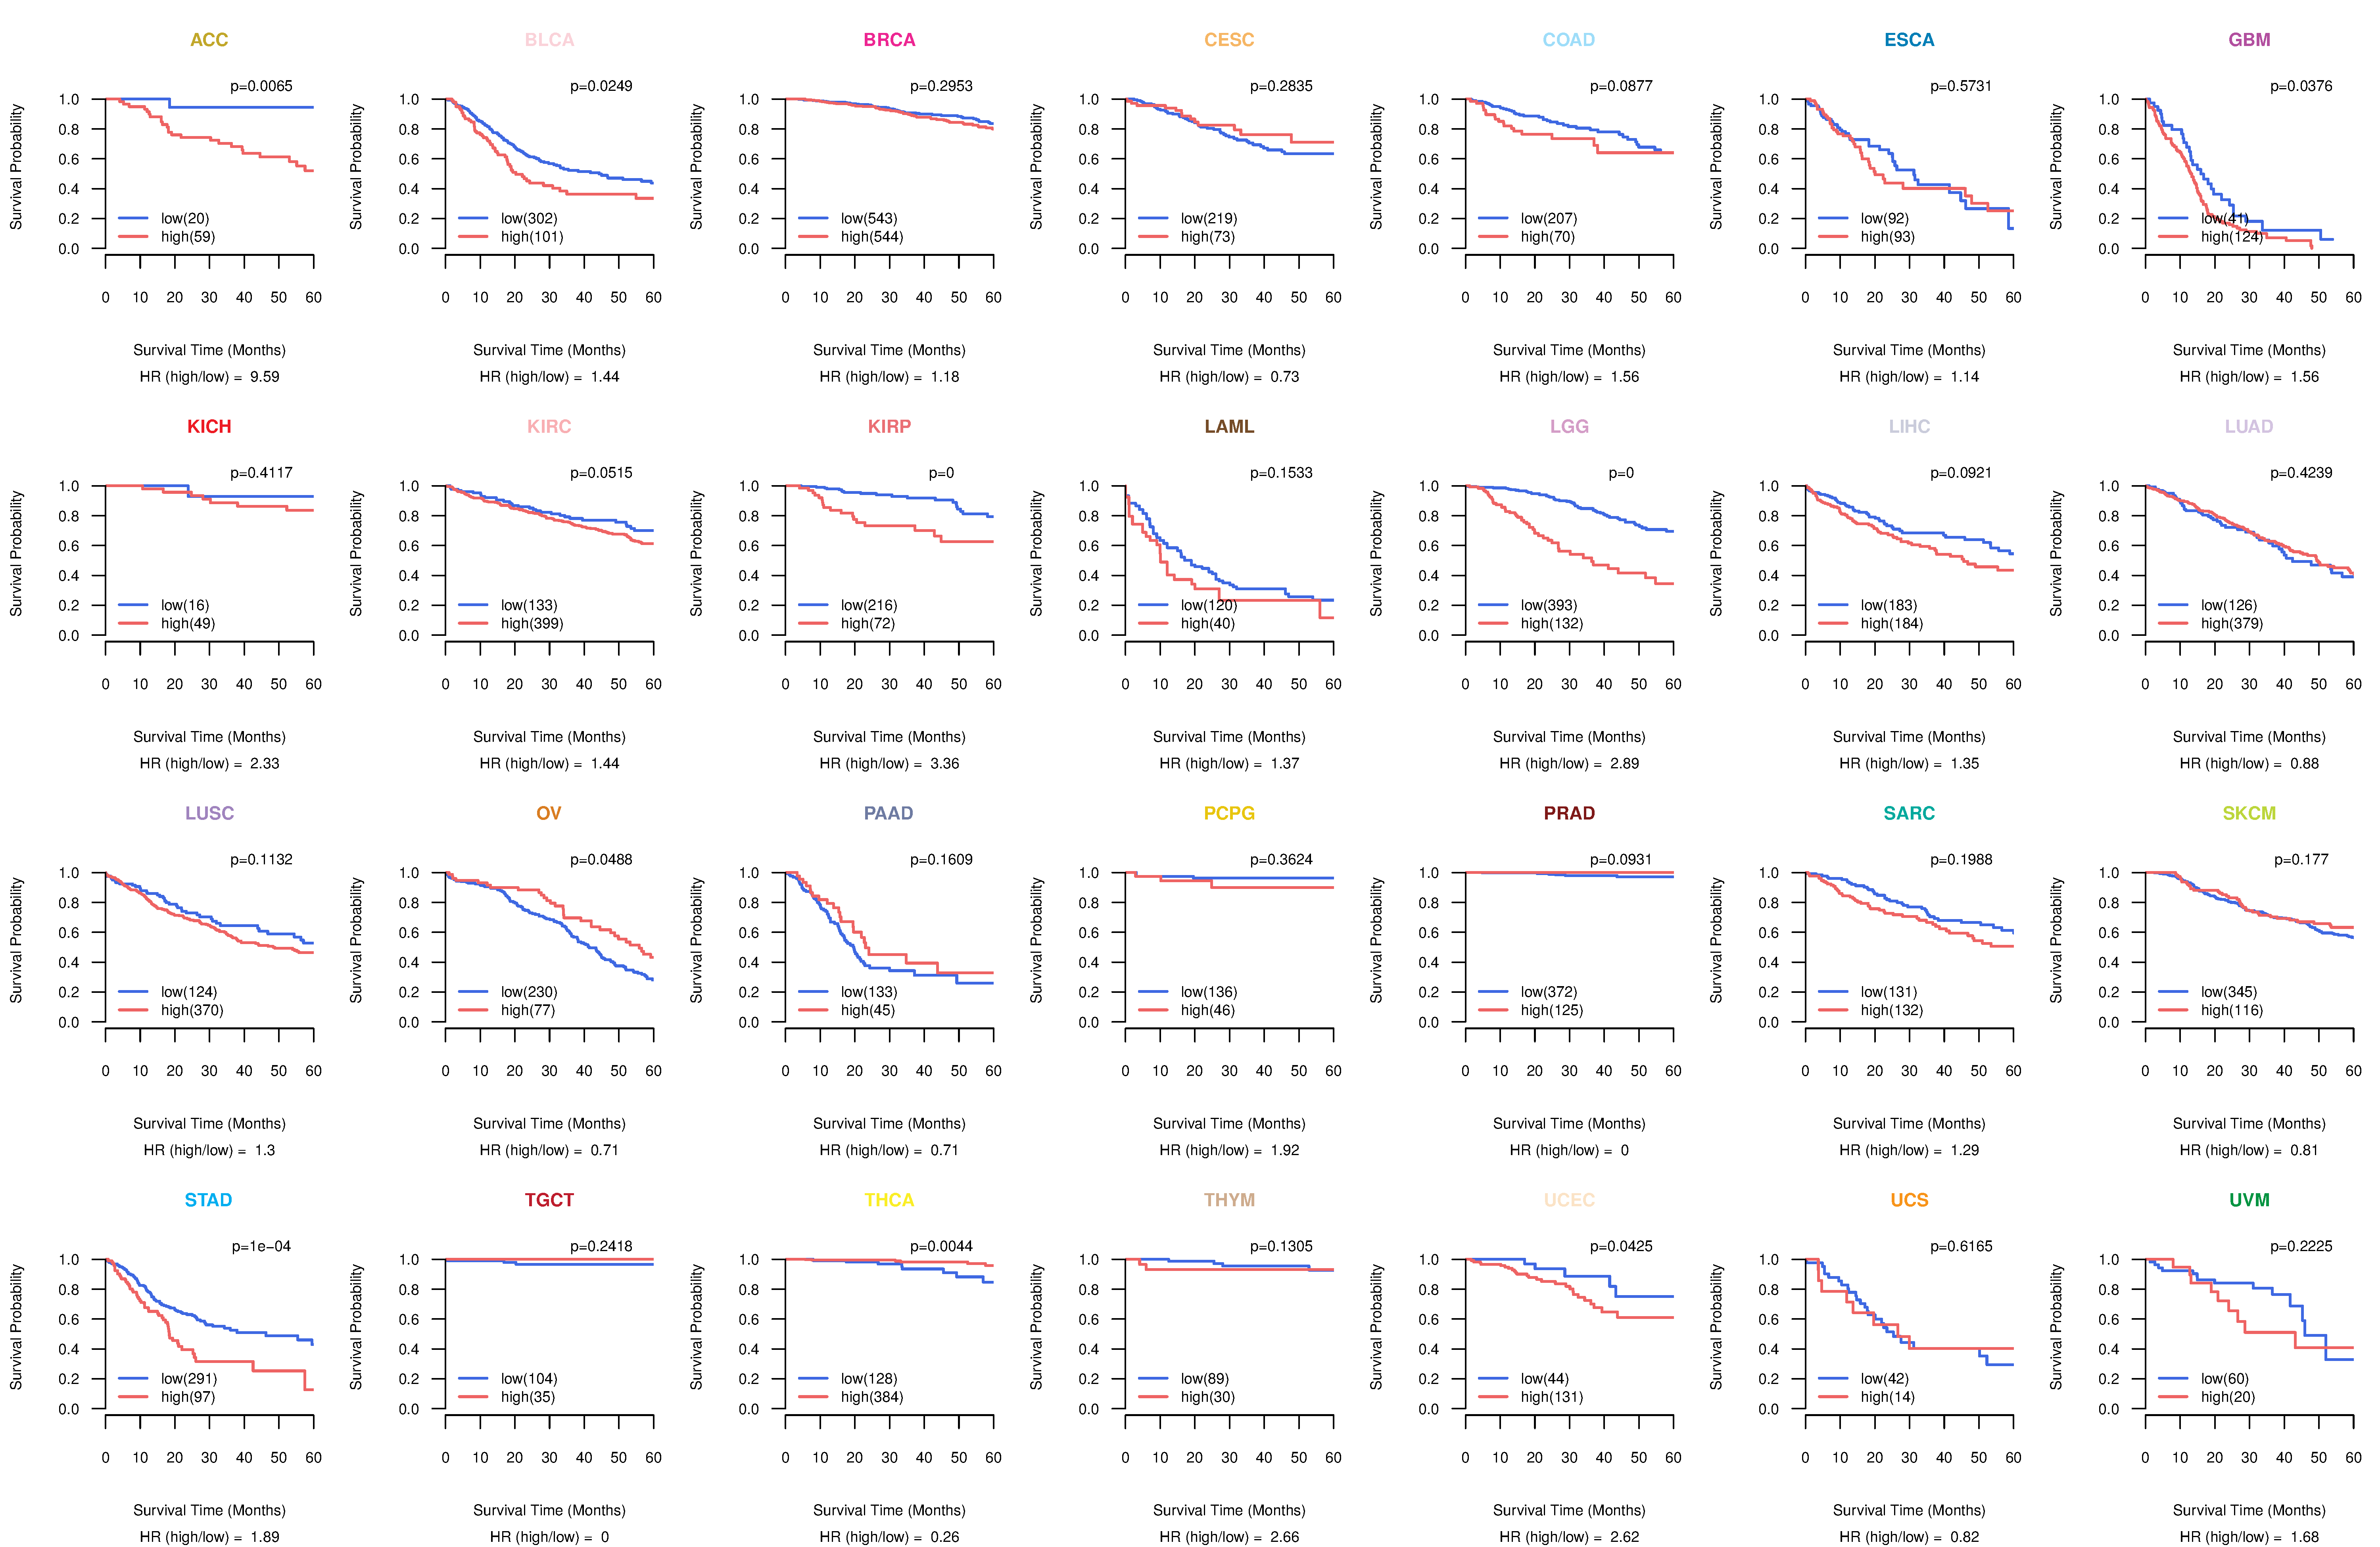
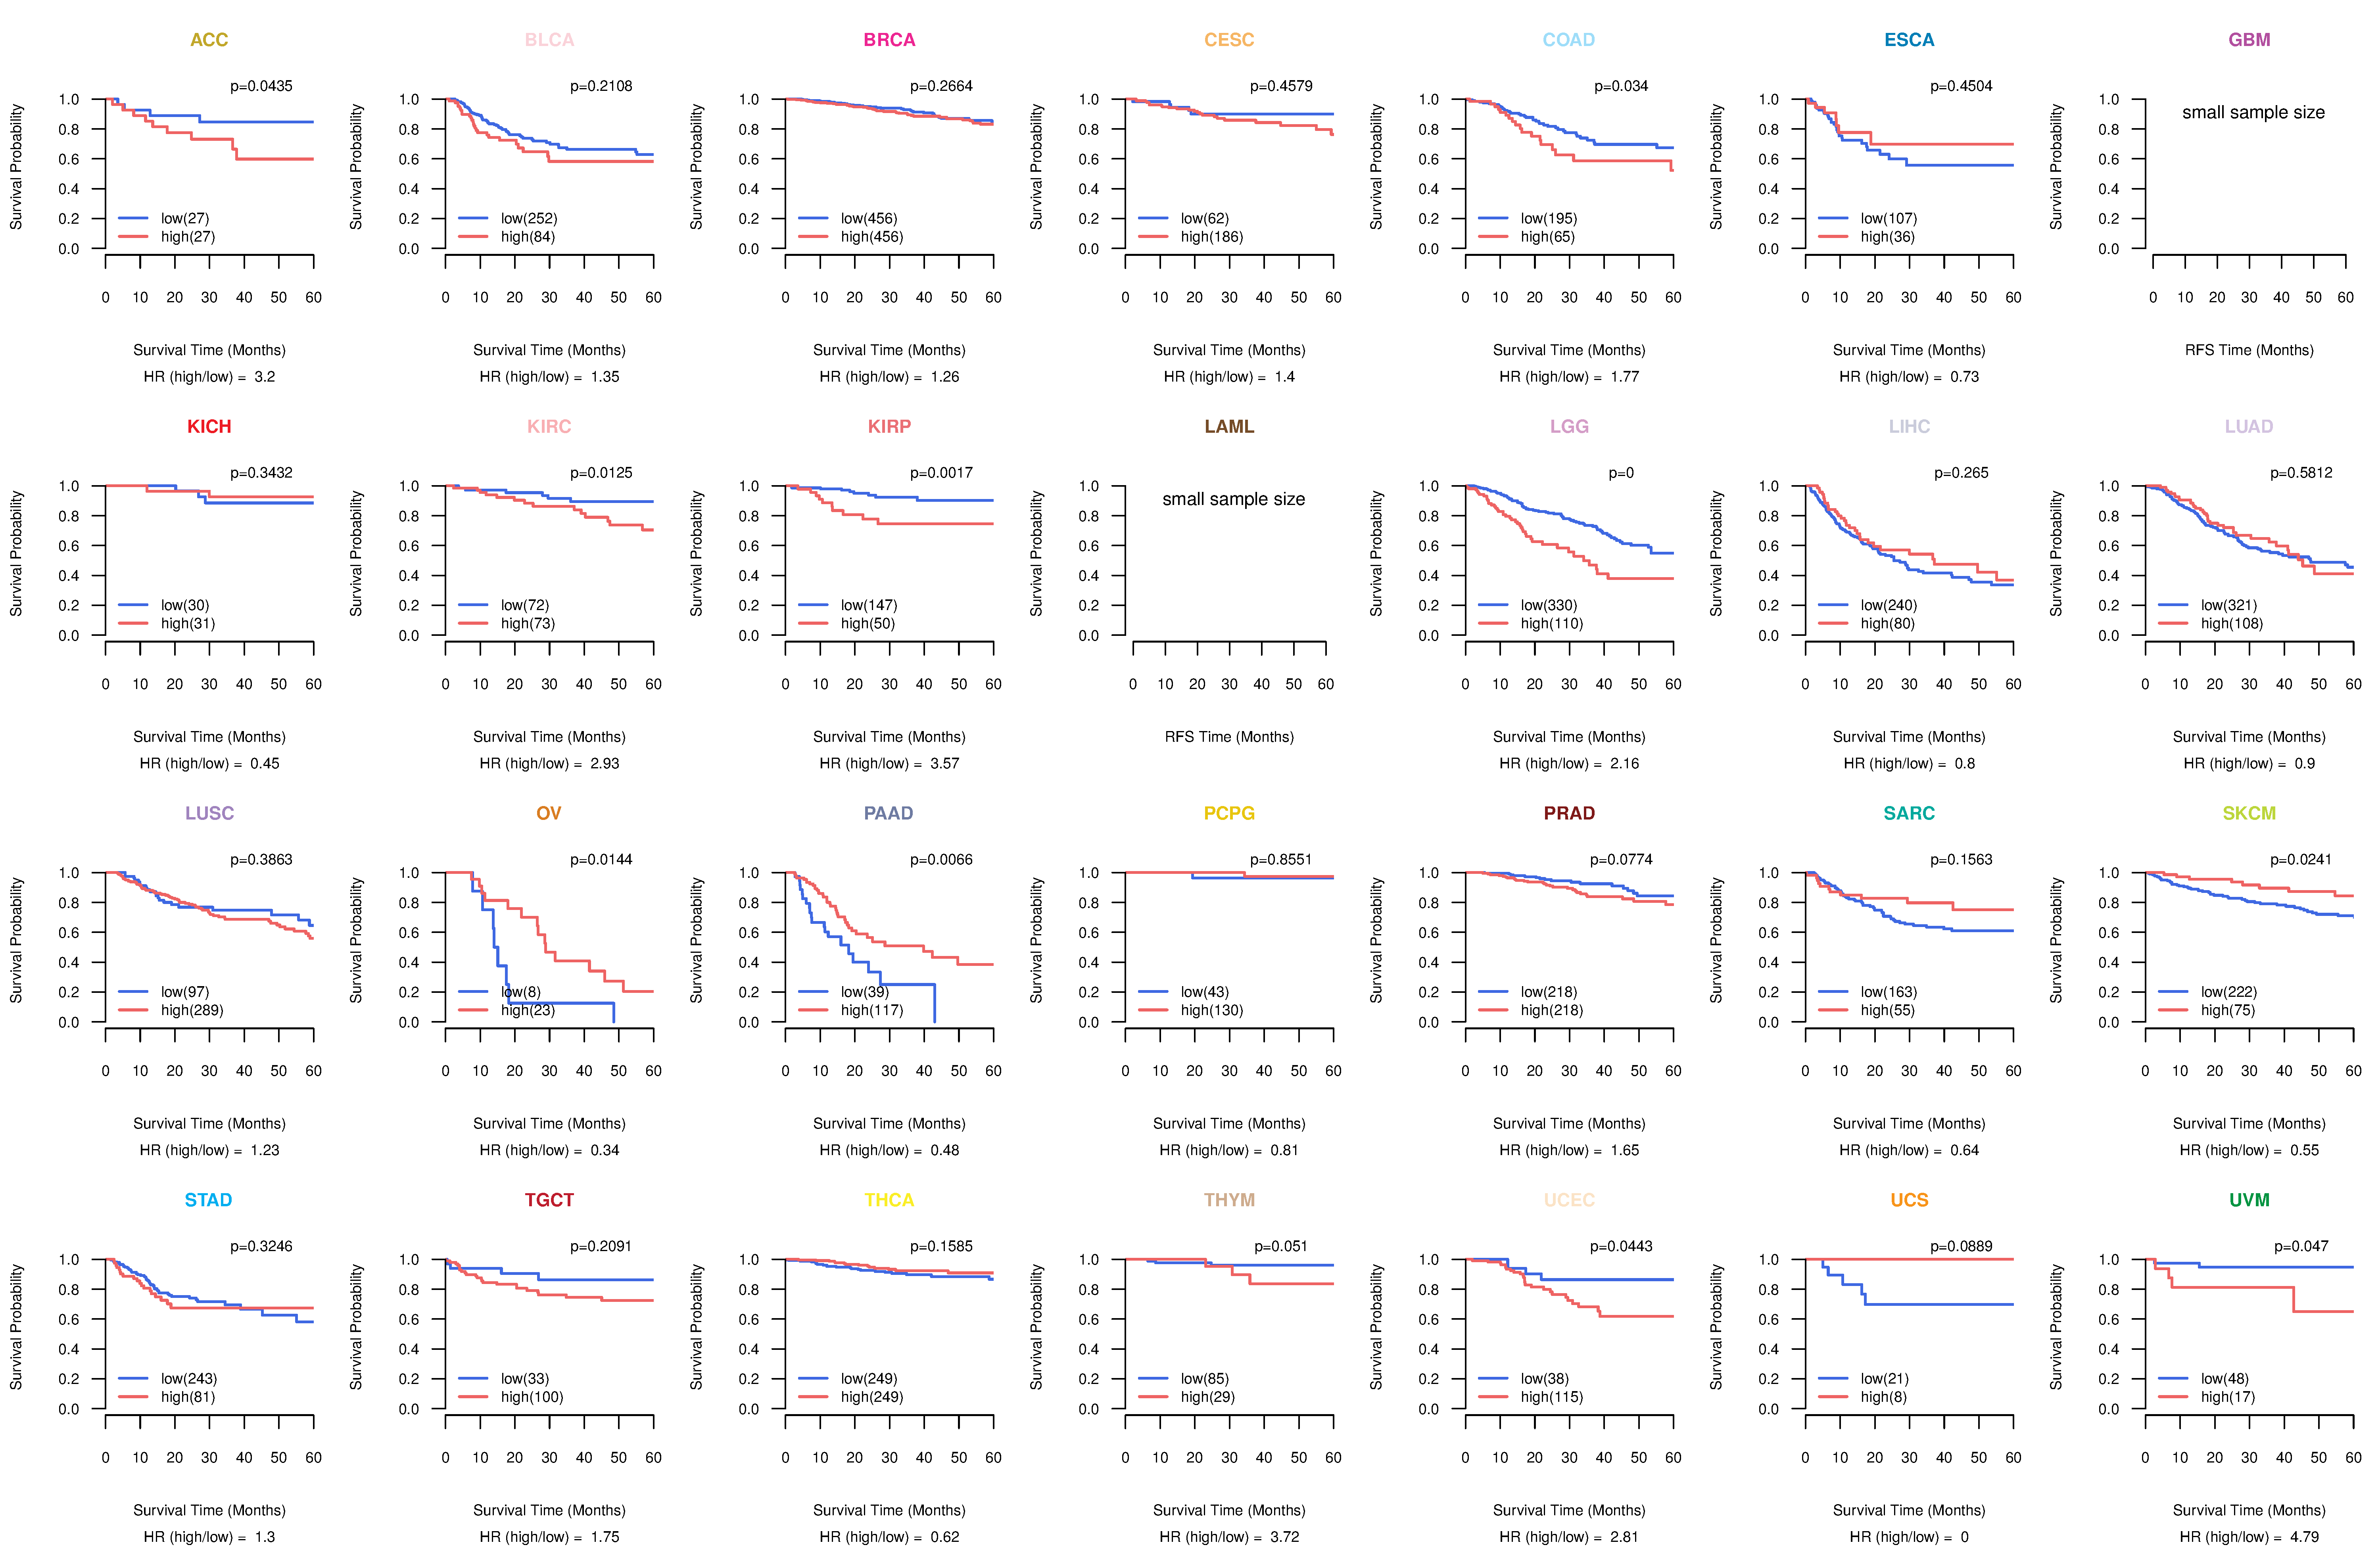
| Kaplan-Meier plots with logrank tests of overall survival (OS) using 28 cancer types (TCGA IlluminaHiSeq_RNASeqV2, pan-cancer normalized log2(norm_counts+1) data, version 2016-08-16) (TCGA clinicalMatrix, phenotype data, version 2016-04-27) * Click on the image to enlarge it in a new window. |
 |
| Kaplan-Meier plots with logrank test of relapse free survival (RFS) using 28 cancer types (TCGA IlluminaHiSeq_RNASeqV2, pan-cancer normalized log2(norm_counts+1) data, version 2016-08-16) (TCGA clinicalMatrix, phenotype data, version 2016-04-27) * Click on the image enlarge it in a new window. |
 |
| Forest plot of Cox proportional hazard ratio (HR) and 95% CI of overall survival (OS) using 28 cancer types (TCGA IlluminaHiSeq_RNASeqV2, pan-cancer normalized log2(norm_counts+1) data, version 2016-08-16) (TCGA clinicalMatrix, phenotype data, version 2016-04-27) * Click on the image enlarge it in a new window. |
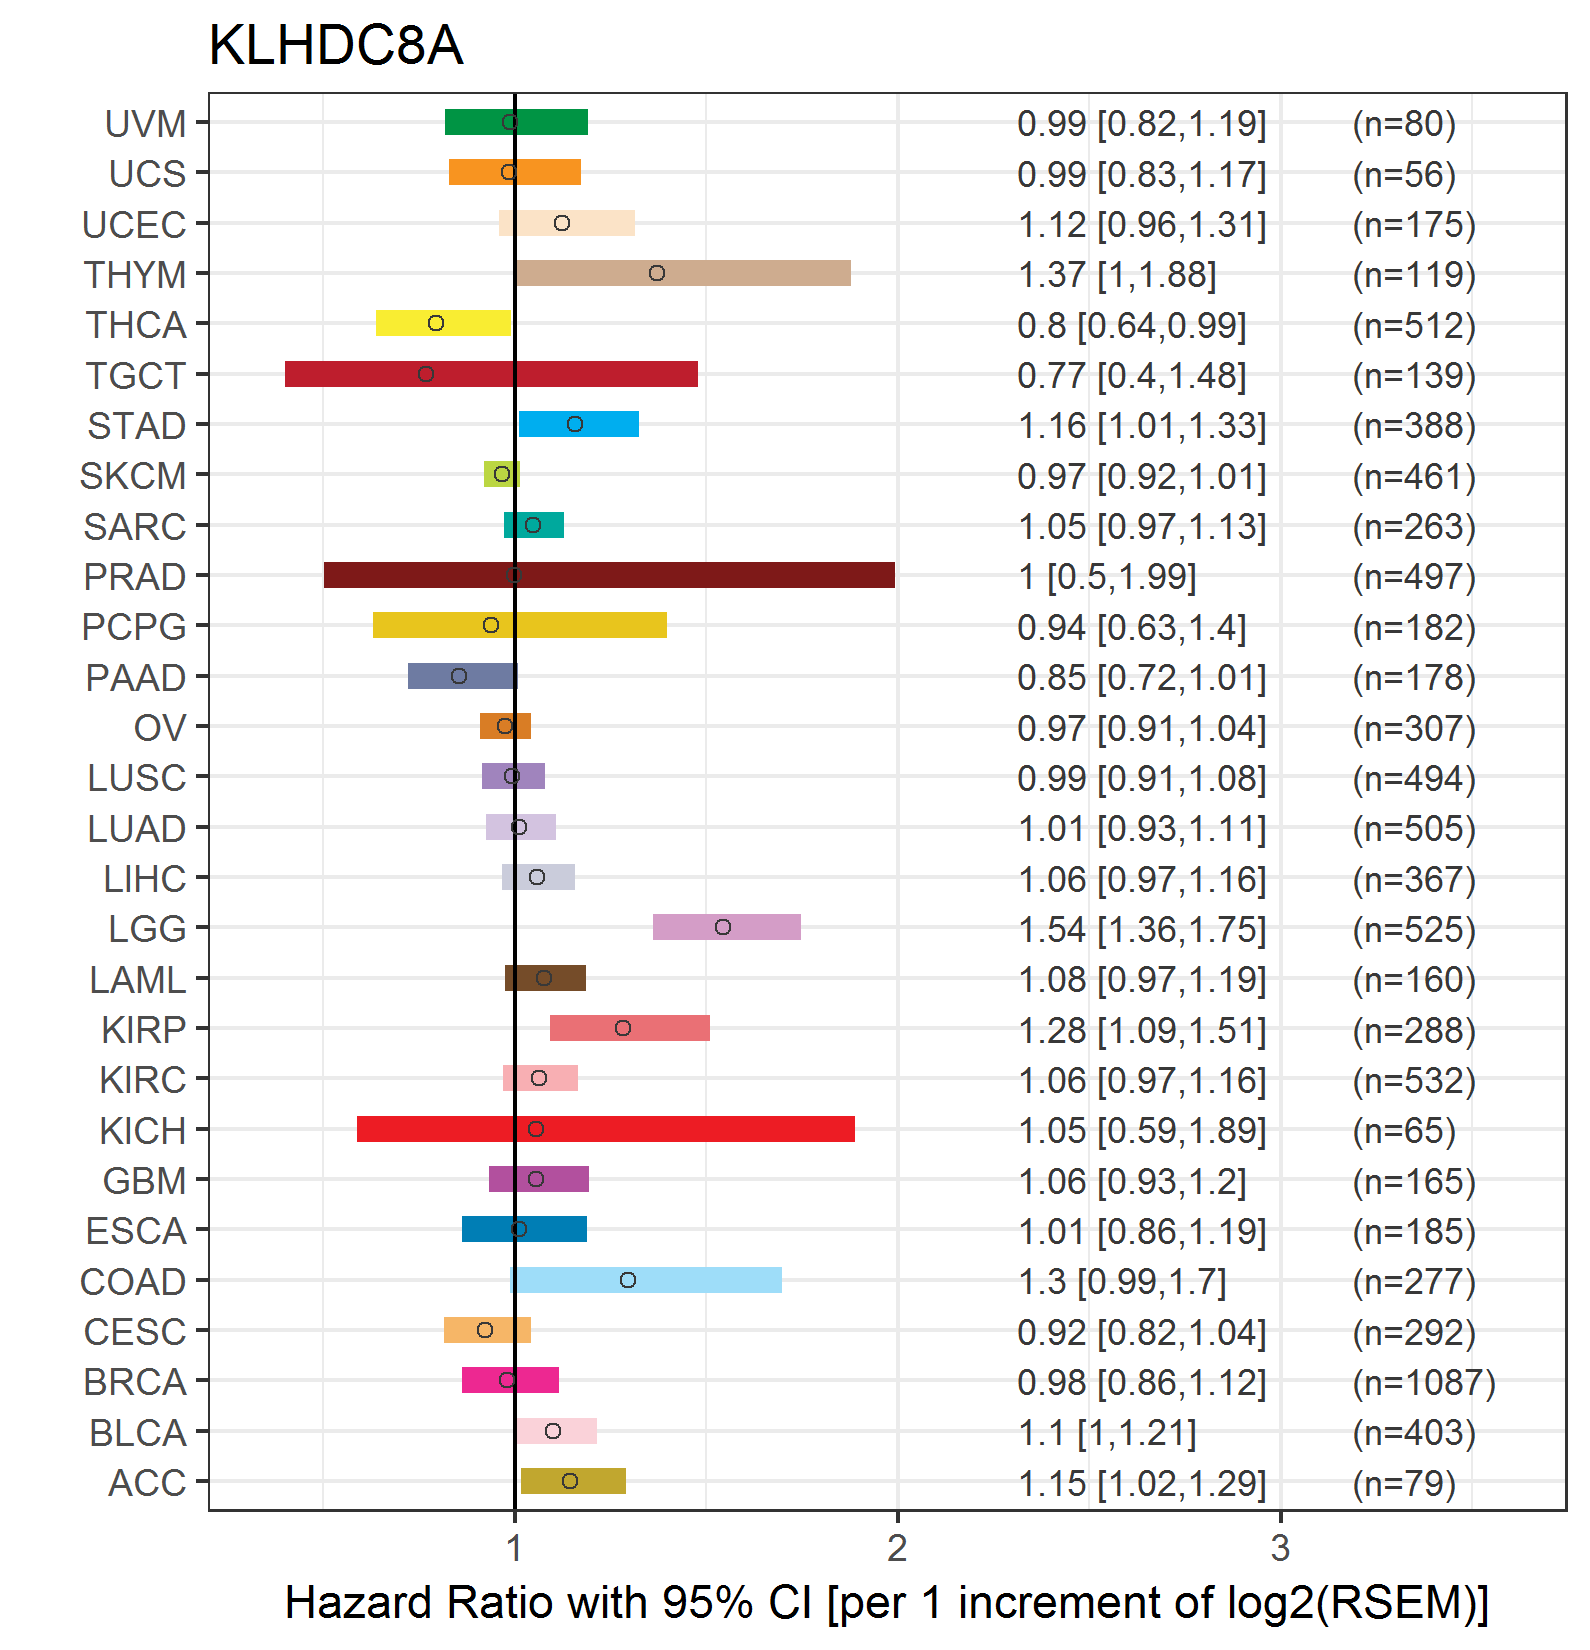 |
| Forest plot of Cox proportional hazard ratio (HR) and 95% CI of relapse free survival (RFS) using 28 cancer types (TCGA IlluminaHiSeq_RNASeqV2, pan-cancer normalized log2(norm_counts+1) data, version 2016-08-16) (TCGA clinicalMatrix, phenotype data, version 2016-04-27) * Click on the image enlarge it in a new window. |
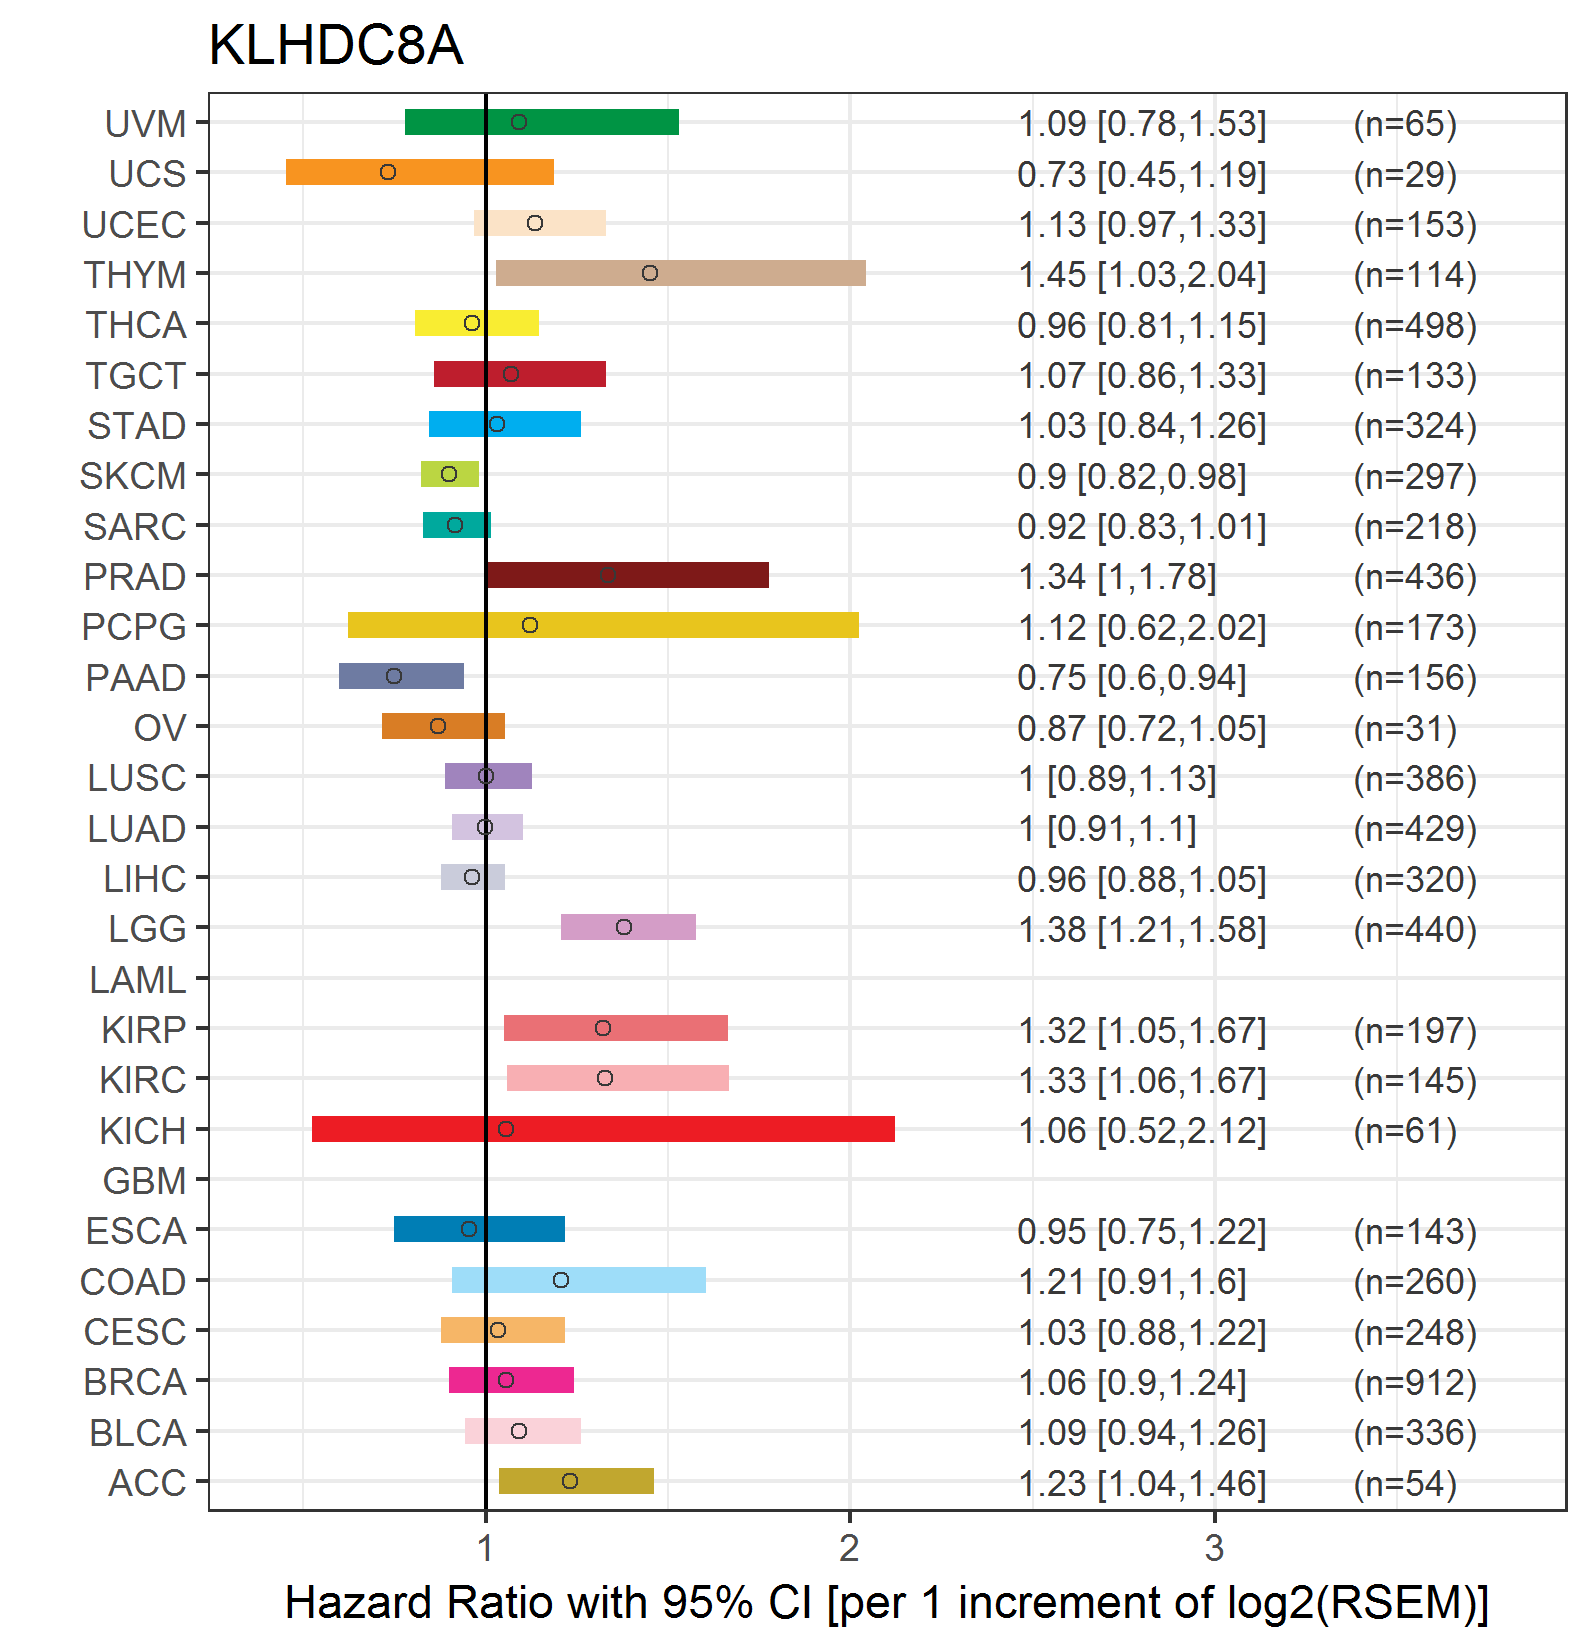 |
| Top |
| TissGeneClin for KLHDC8A |
| TissGeneDrug for KLHDC8A |
| Drug information targeting TissGene (DrugBank Version 5.0.6, 2017-04-01) |
| DrugBank ID | Drug name | Drug activity | Drug type | Drug status |
| Top |
| TissGeneDisease for KLHDC8A |
| Disease information associated with TissGene (DisGeNet, 2016-06-01) |
| Disease ID | Disease name | # pubmeds | Source |
| umls:C0031117 | Peripheral Neuropathy | 1 | CTD_human |
|
Copyright 2016-Present - The University of Texas Health Science Center at Houston (UTHealth) Web File Viewing | How to Report, Fraud, Waste and Abuse | State of Texas | Statewide Search | Texas Homeland Security | Site Policies |