 |
| |
| |
| |
| |
| |
| |
|

| TissGeneSummary for ETNK2 |
 Gene summary Gene summary |
| Basic gene information | Gene symbol | ETNK2 |
| Gene name | ethanolamine kinase 2 | |
| Synonyms | EKI2|HMFT1716 | |
| Cytomap | UCSC genome browser: 1q32.1 | |
| Type of gene | protein-coding | |
| RefGenes | NM_001297760.1, NM_001297761.1,NM_001297762.1,NM_018208.3, | |
| Description | ethanolamine kinase-like protein | |
| Modification date | 20141207 | |
| dbXrefs | MIM : 609859 | |
| HGNC : HGNC | ||
| Ensembl : ENSG00000143845 | ||
| HPRD : 13283 | ||
| Vega : OTTHUMG00000036061 | ||
| Protein | UniProt: go to UniProt's Cross Reference DB Table | |
| Expression | CleanEX: HS_ETNK2 | |
| BioGPS: 55224 | ||
| Pathway | NCI Pathway Interaction Database: ETNK2 | |
| KEGG: ETNK2 | ||
| REACTOME: ETNK2 | ||
| Pathway Commons: ETNK2 | ||
| Context | iHOP: ETNK2 | |
| ligand binding site mutation search in PubMed: ETNK2 | ||
| UCL Cancer Institute: ETNK2 | ||
| Assigned class in TissGDB* | C | |
| Included tissue-specific gene expression resources | TiGER,GTEx | |
| Specific-tissues in normal samples (assigned by TissGDB using HPA, TiGER, and GTEx) | Testis | |
| Cancer types related to the specific-tissues in cancer samples (assigned by TissGDB using TCGA) | TGCT | |
| Reference showing the relevant tissue of ETNK2 | ||
| Description by TissGene annotations | Have significant anti-correlated miRNA | |
| * Class A consists of genes with literature evidence and is part of the cTissGenes. Class B consists of only cTissGenes without additional evidence. The remaining genes belong to Class C. |
| Gene ontology having evidence of Inferred from Direct Assay (IDA) from Entrez |
| GO ID | GO term | PubMed ID |
| Top |
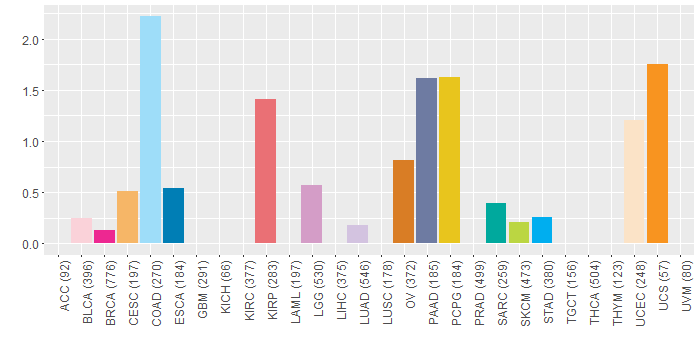
| TissGeneExp for ETNK2 |
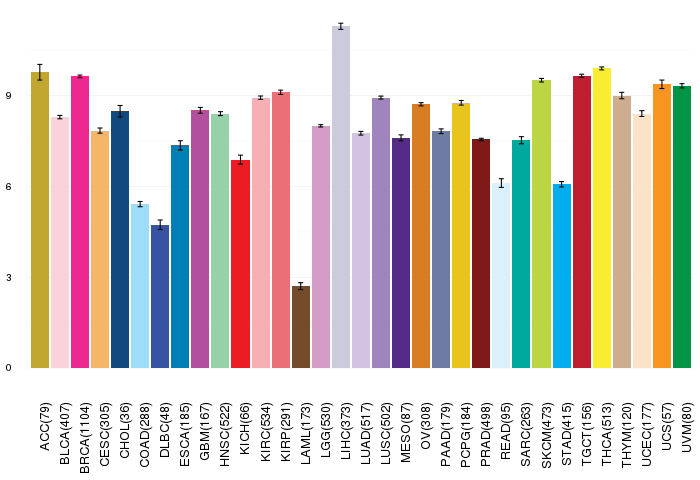
| Gene expressions across 28 cancer types (X-axis: cancer type and Y-axis: log2(norm_counts+1)) (TCGA IlluminaHiSeq_RNASeqV2, pan-cancer normalized log2(norm_counts+1) data, version 2016-08-16) |
 |
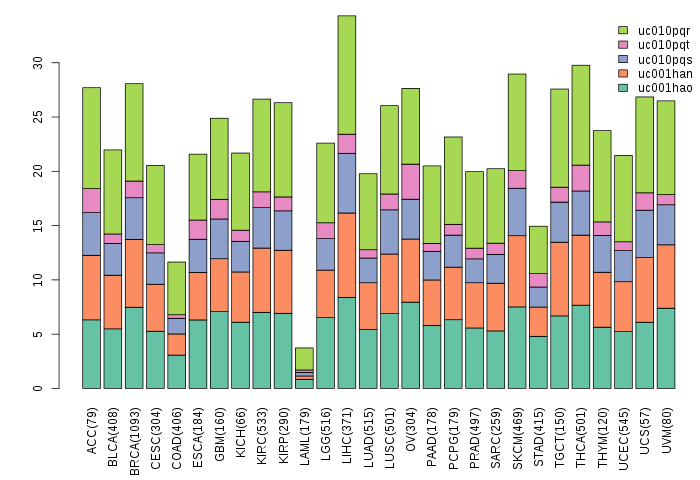
| Gene isoform expressions across 28 cancer types (X-axis: cancer type and Y-axis: log2(norm_counts+1)) (TCGA pan-cancer tcga_rsem_isoform_tpm, version 2016-09-01) |
 |
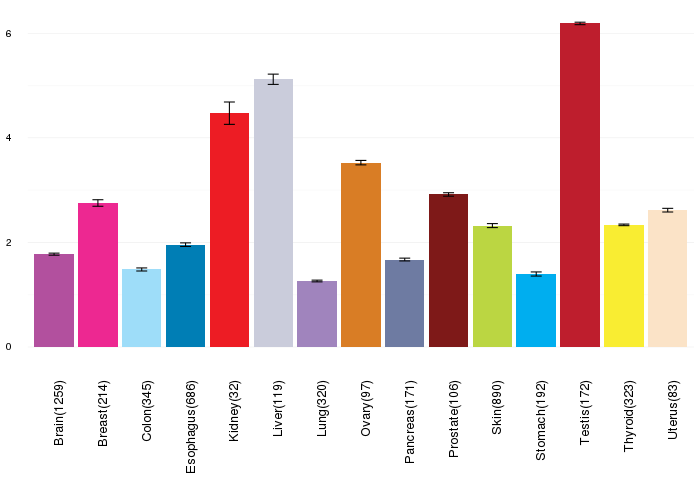
| Gene expressions across normal tissues of GTEx data (GTEx GTEx_Analysis_v6_RNA-seq_RNA-SeQCv1.1.8_gene_rpkm.gct) - Here, we shows the matched tissue types only among our 28 cancer types. |
 |
| Different expressions across 14 cancer types with more than 10 samples between matched tumors and normals (X-axis: cancer type and Y-axis: log2(norm_counts+1)) (TCGA IlluminaHiSeq_RNASeqV2, pan-cancer normalized log2(norm_counts+1) data, version 2016-08-16) |
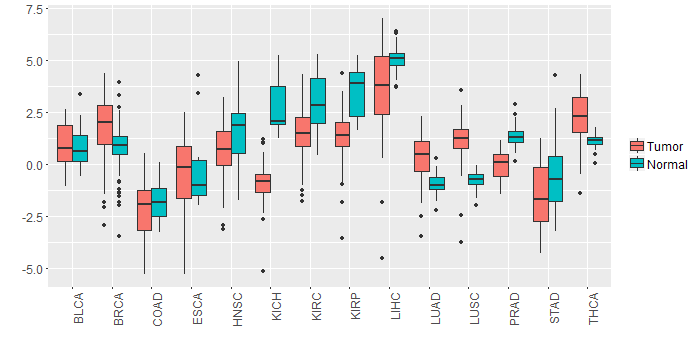 |
| - Significantly differentially expressed cancer types and information. (|Fold change|>1 and FDR<0.05) |
| Cancer type | Mean(exp) in tumor | Mean(exp) in matched normal | Log2FC | P-val. | FDR |
| KICH | -0.942276957 | 2.749751043 | -3.692028 | 6.25E-14 | 9.57E-13 |
| KIRC | 1.485938877 | 2.997863877 | -1.511925 | 9.18E-12 | 3.61E-11 |
| LUAD | 0.314282698 | -0.959393164 | 1.273675862 | 5.11E-11 | 3.17E-10 |
| LUSC | 1.082764612 | -0.783658917 | 1.866423529 | 4.45E-15 | 2.80E-14 |
| THCA | 2.202515925 | 1.117092196 | 1.085423729 | 4.42E-09 | 2.32E-08 |
| PRAD | -0.015297341 | 1.321577659 | -1.336875 | 2.09E-19 | 1.56E-16 |
| KIRP | 1.208171168 | 3.442824293 | -2.234653125 | 2.16E-08 | 1.53E-07 |
| STAD | -1.689460082 | -0.509675707 | -1.179784375 | 0.00747 | 0.027053188 |
| HNSC | 0.570966299 | 1.634489555 | -1.063523256 | 0.00156 | 0.005007133 |
| LIHC | 3.564983043 | 5.027757043 | -1.462774 | 6.85E-05 | 0.000246179 |
| Top |
| TissGene-miRNA for ETNK2 |
| Significantly anti-correlated miRNAs of TissGene across 28 cancer types (Gene-miRNA relations from TargetScanHuman Relsease 7.1, Conserved_Site_Context_Scores.txt.zip, 06.01.2016) (TCGA IlluminaHiSeq_miRNASeq, log2(RPM+1) data, version 2016-11-21) (TCGA IlluminaHiSeq_RNASeqV2, log2(normalized_count+1) data, version 2016-08-16) (Spearman’s Rank Correlation (p-value<0.05 and coefficient<-0.25)) |
| Cancer type | miRNA id | miRNA accession | P-val. | Coeff. | # samples |
| LUAD | hsa-let-7f-5p | MIMAT0000067 | 0.039 | -0.27 | 60 |
| LUAD | hsa-let-7a-5p | MIMAT0000062 | 0.024 | -0.29 | 60 |
| ACC | hsa-miR-485-5p | MIMAT0002175 | 0.0062 | -0.31 | 78 |
| ACC | hsa-miR-485-5p | MIMAT0002175 | 0.0062 | -0.31 | 78 |
| LUAD | hsa-let-7g-5p | MIMAT0000414 | 0.0034 | -0.38 | 60 |
| Top |
| TissGeneMut for ETNK2 |
| TissGeneSNV for ETNK2 |
| nsSNV counts per each loci. Different colors of circles represent different cancer types. Circle size denotes number of samples. (TCGA somatic mutation (SNPs and small INDELs) data, version 2016-04-25) * Click on the image to enlarge it in a new window. |
 |
| Somatic nucleotide variants of TissGene across 28 cancer types (X-axis: cancer type and Y-axis: % of mutated samples) The numbers in parentheses are numbers of samples with mutation (nsSNVs). (TCGA somatic mutation (SNPs and small INDELs) data, version 2016-04-25) |
 |
| - nsSNVs sorted by frequency. |
| AAchange | Cancer type | # samples |
| p.P10Q | READ | 4 |
| p.P10Q | COAD | 4 |
| p.P10Q | PCPG | 3 |
| p.P10Q | LGG | 2 |
| p.L280I | LGG | 1 |
| p.P213H | UCEC | 1 |
| p.K181N | PAAD | 1 |
| p.R265W | UCEC | 1 |
| p.D211N | BLCA | 1 |
| p.A187T | OV | 1 |
| p.P340A | LUAD | 1 |
| p.V291M | OV | 1 |
| p.F343L | BRCA | 1 |
| p.P10Q | UCS | 1 |
| p.G262R | CESC | 1 |
| p.E178X | COAD | 1 |
| p.G361A | KIRP | 1 |
| p.A289V | PAAD | 1 |
| p.A220V | PAAD | 1 |
| p.Y153H | KIRP | 1 |
| p.R265W | DLBC | 1 |
| p.P10Q | PAAD | 1 |
| p.P254L | HNSC | 1 |
| p.L196F | SARC | 1 |
| p.T23K | OV | 1 |
| p.P213S | SKCM | 1 |
| p.E74K | HNSC | 1 |
| p.V58M | COAD | 1 |
| p.E218G | LGG | 1 |
| p.Y153C | KIRP | 1 |
| p.E178* | UCEC | 1 |
| p.T205M | STAD | 1 |
| p.V291M | ESCA | 1 |
| p.M384K | KIRP | 1 |
| p.P10Q | KIRP | 1 |
| p.T205M | HNSC | 1 |
| Top |
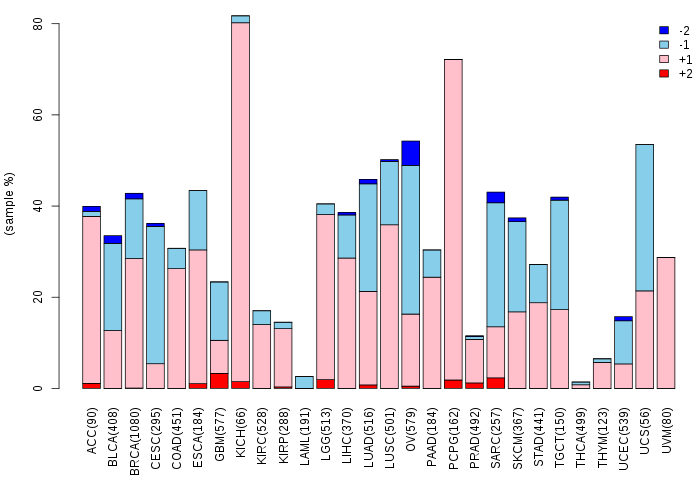
| TissGeneCNV for ETNK2 |
| Copy number variations of TissGene across 28 cancer types (X-axis: cancer type and Y-axis: % of CNV samples) (TCGA Gistic2_CopyNumber_Gistic2_all_data_by_genes, Gistic2 copy number data, version 2016-08-16) |
 |
| Top |
| TissGeneFusions for ETNK2 |
| Fusion genes including TissGene (ChimerDB 3.0, 2016-12-01 and TCGA fusion Portal 2015-12-01) |
| Database | Src | Cancer type | Sample | Fusion gene | ORF | 5'-gene BP | 3'-gene BP |
| Chimerdb3.0 | ChiTaRs | NA | BU624180 | ETNK2-MMP14 | chr1:204100544 | chr14:23315755 | |
| Chimerdb3.0 | ChiTaRs | NA | BF933482 | MBP-ETNK2 | chr18:74691618 | chr1:204110463 |
| Top |
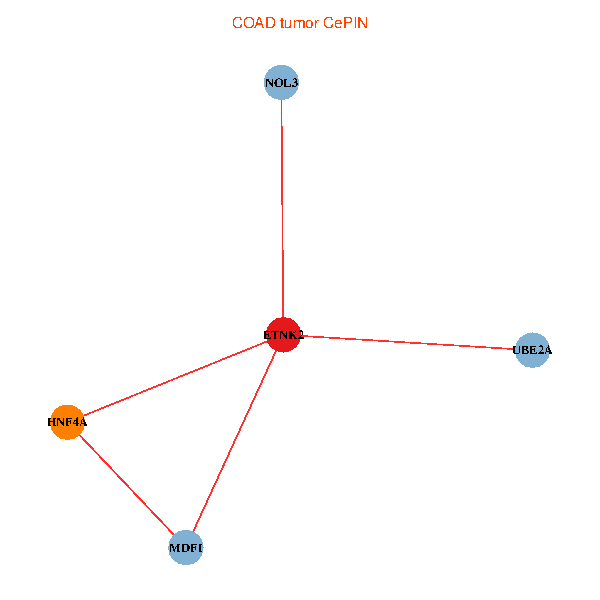
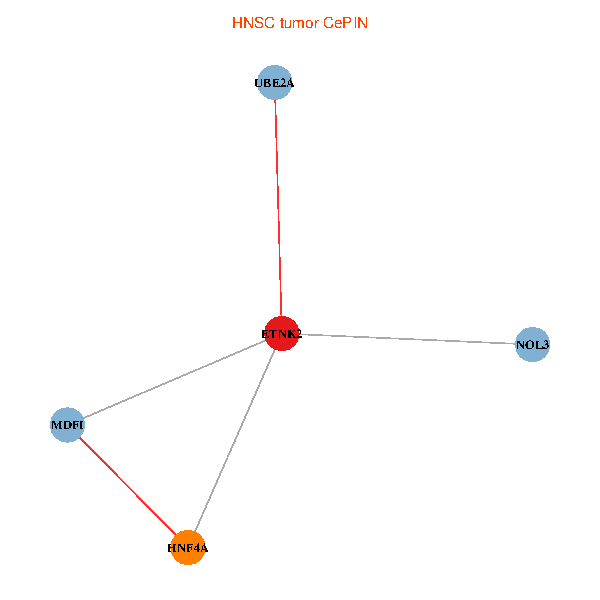
| TissGeneNet for ETNK2 |
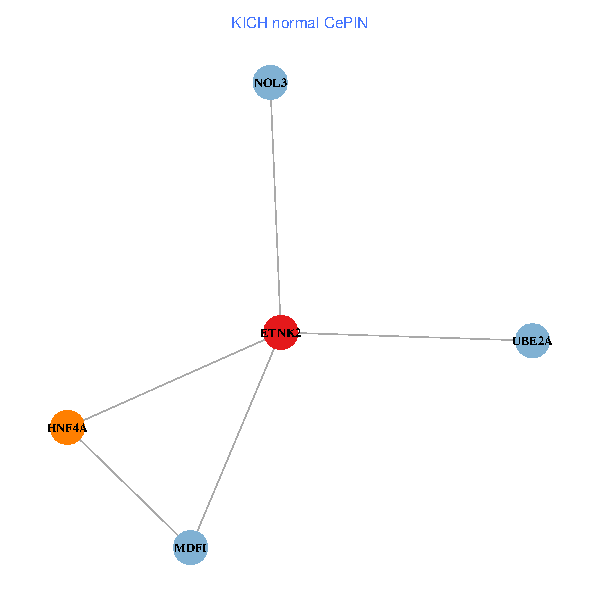
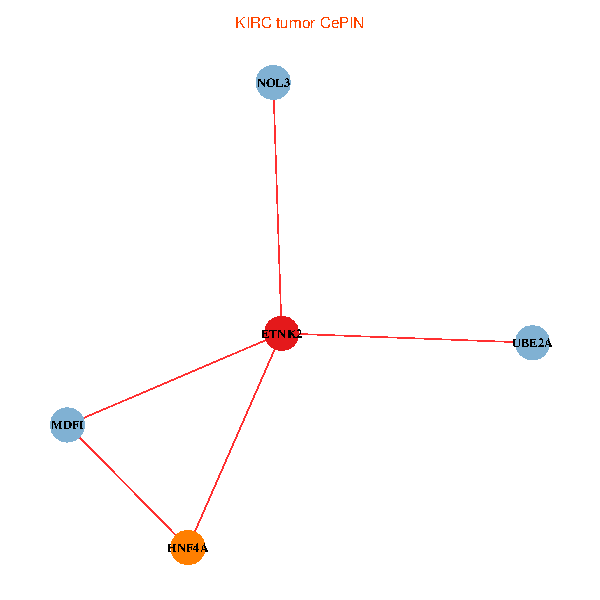
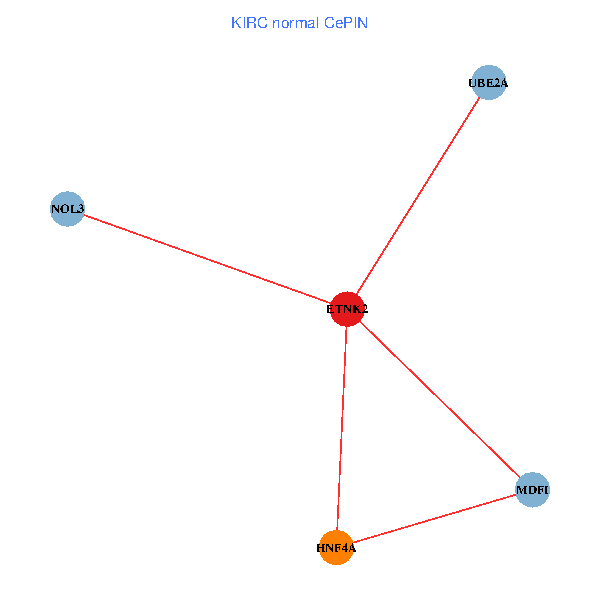
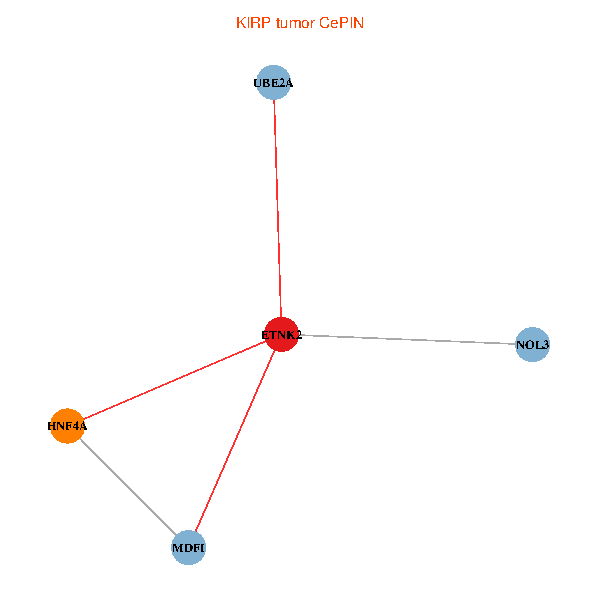
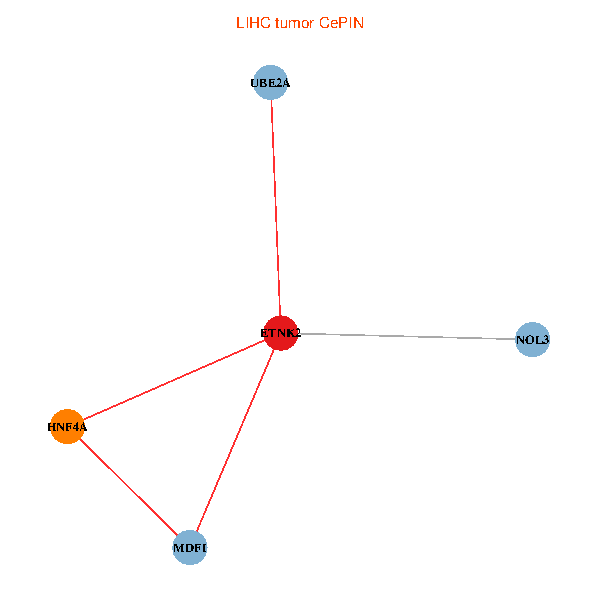
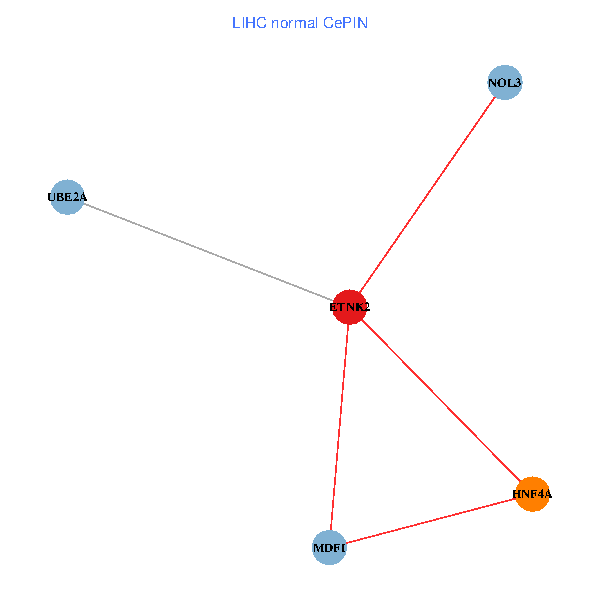
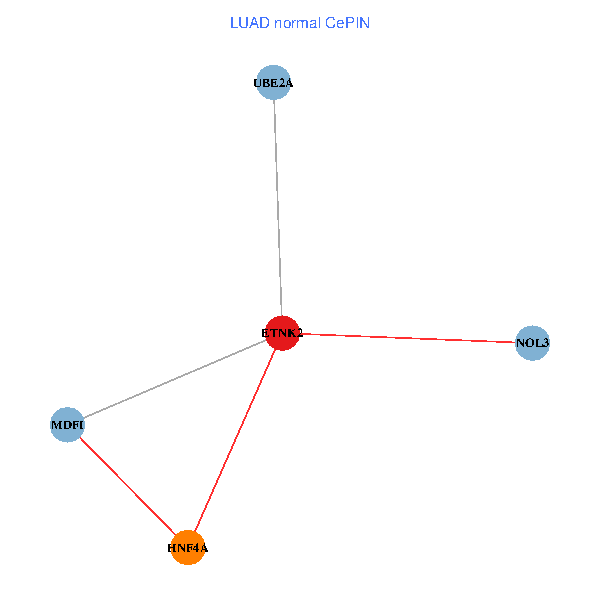
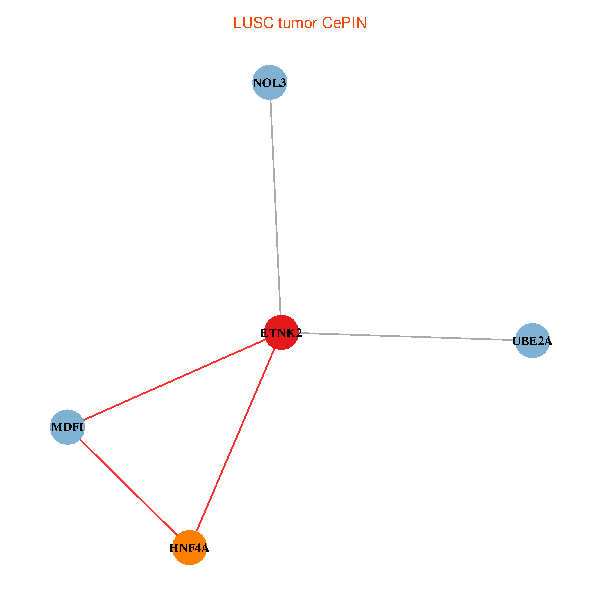
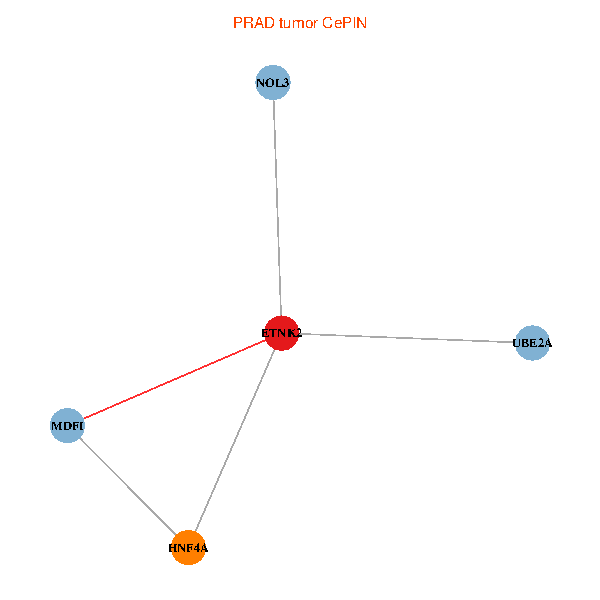
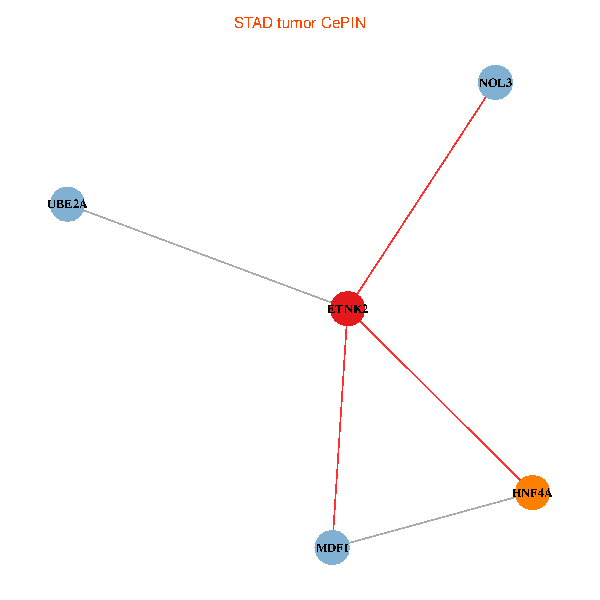
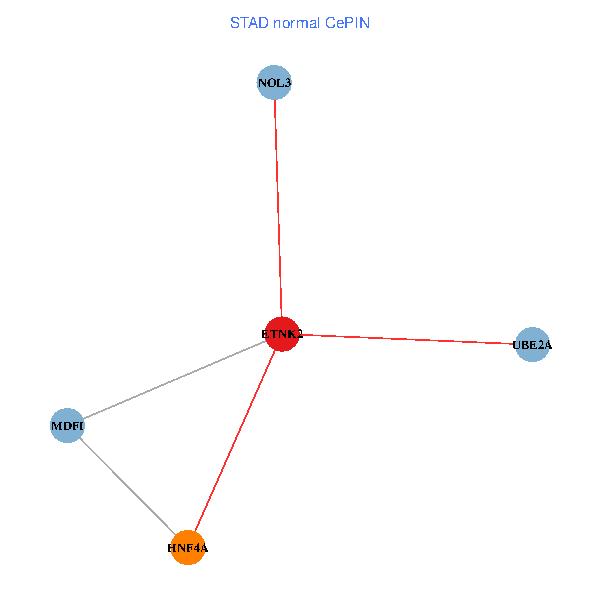
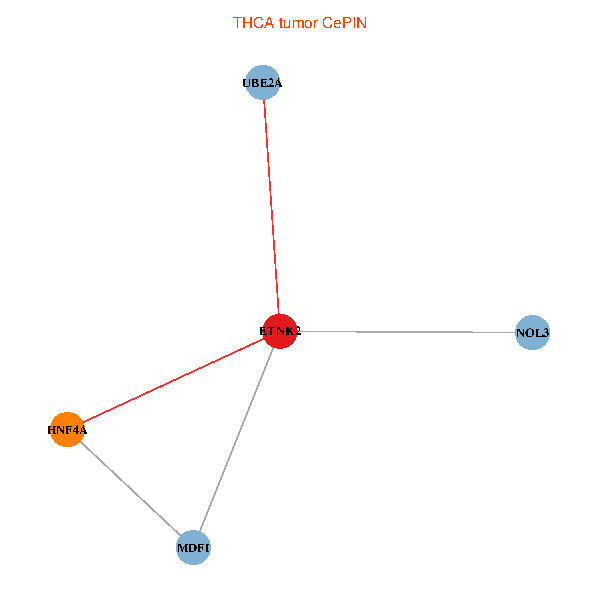
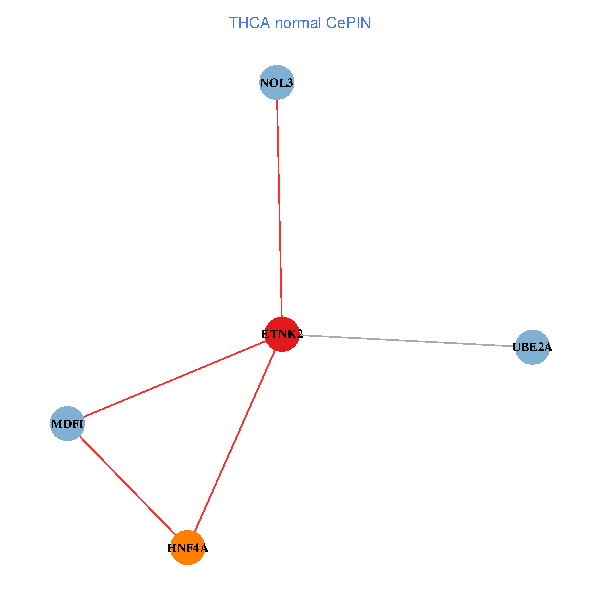
| Co-expressed gene networks based on protein-protein interaction data (CePIN) (TCGA IlluminaHiSeq_RNASeqV2, pan-cancer normalized log2(norm_counts+1) data, version 2016-08-16) (PINA2 ppi data) |
| BRCA (tumor) | BRCA (normal) |
| ETNK2, HNF4A, MDFI, UBE2A, NOL3 (tumor) | ETNK2, HNF4A, MDFI, UBE2A, NOL3 (normal) |
 |  |
| COAD (tumor) | COAD (normal) |
| ETNK2, HNF4A, MDFI, UBE2A, NOL3 (tumor) | ETNK2, HNF4A, MDFI, UBE2A, NOL3 (normal) |
 |  |
| HNSC (tumor) | HNSC (normal) |
| ETNK2, HNF4A, MDFI, UBE2A, NOL3 (tumor) | ETNK2, HNF4A, MDFI, UBE2A, NOL3 (normal) |
 |  |
| KICH (tumor) | KICH (normal) |
| ETNK2, HNF4A, MDFI, UBE2A, NOL3 (tumor) | ETNK2, HNF4A, MDFI, UBE2A, NOL3 (normal) |
 |  |
| KIRC (tumor) | KIRC (normal) |
| ETNK2, HNF4A, MDFI, UBE2A, NOL3 (tumor) | ETNK2, HNF4A, MDFI, UBE2A, NOL3 (normal) |
 |  |
| KIRP (tumor) | KIRP (normal) |
| ETNK2, HNF4A, MDFI, UBE2A, NOL3 (tumor) | ETNK2, HNF4A, MDFI, UBE2A, NOL3 (normal) |
 |  |
| LIHC (tumor) | LIHC (normal) |
| ETNK2, HNF4A, MDFI, UBE2A, NOL3 (tumor) | ETNK2, HNF4A, MDFI, UBE2A, NOL3 (normal) |
 |  |
| LUAD (tumor) | LUAD (normal) |
| ETNK2, HNF4A, MDFI, UBE2A, NOL3 (tumor) | ETNK2, HNF4A, MDFI, UBE2A, NOL3 (normal) |
 |  |
| LUSC (tumor) | LUSC (normal) |
| ETNK2, HNF4A, MDFI, UBE2A, NOL3 (tumor) | ETNK2, HNF4A, MDFI, UBE2A, NOL3 (normal) |
 |  |
| PRAD (tumor) | PRAD (normal) |
| ETNK2, HNF4A, MDFI, UBE2A, NOL3 (tumor) | ETNK2, HNF4A, MDFI, UBE2A, NOL3 (normal) |
 |  |
| STAD (tumor) | STAD (normal) |
| ETNK2, HNF4A, MDFI, UBE2A, NOL3 (tumor) | ETNK2, HNF4A, MDFI, UBE2A, NOL3 (normal) |
 |  |
| THCA (tumor) | THCA (normal) |
| ETNK2, HNF4A, MDFI, UBE2A, NOL3 (tumor) | ETNK2, HNF4A, MDFI, UBE2A, NOL3 (normal) |
 |  |
| Top |
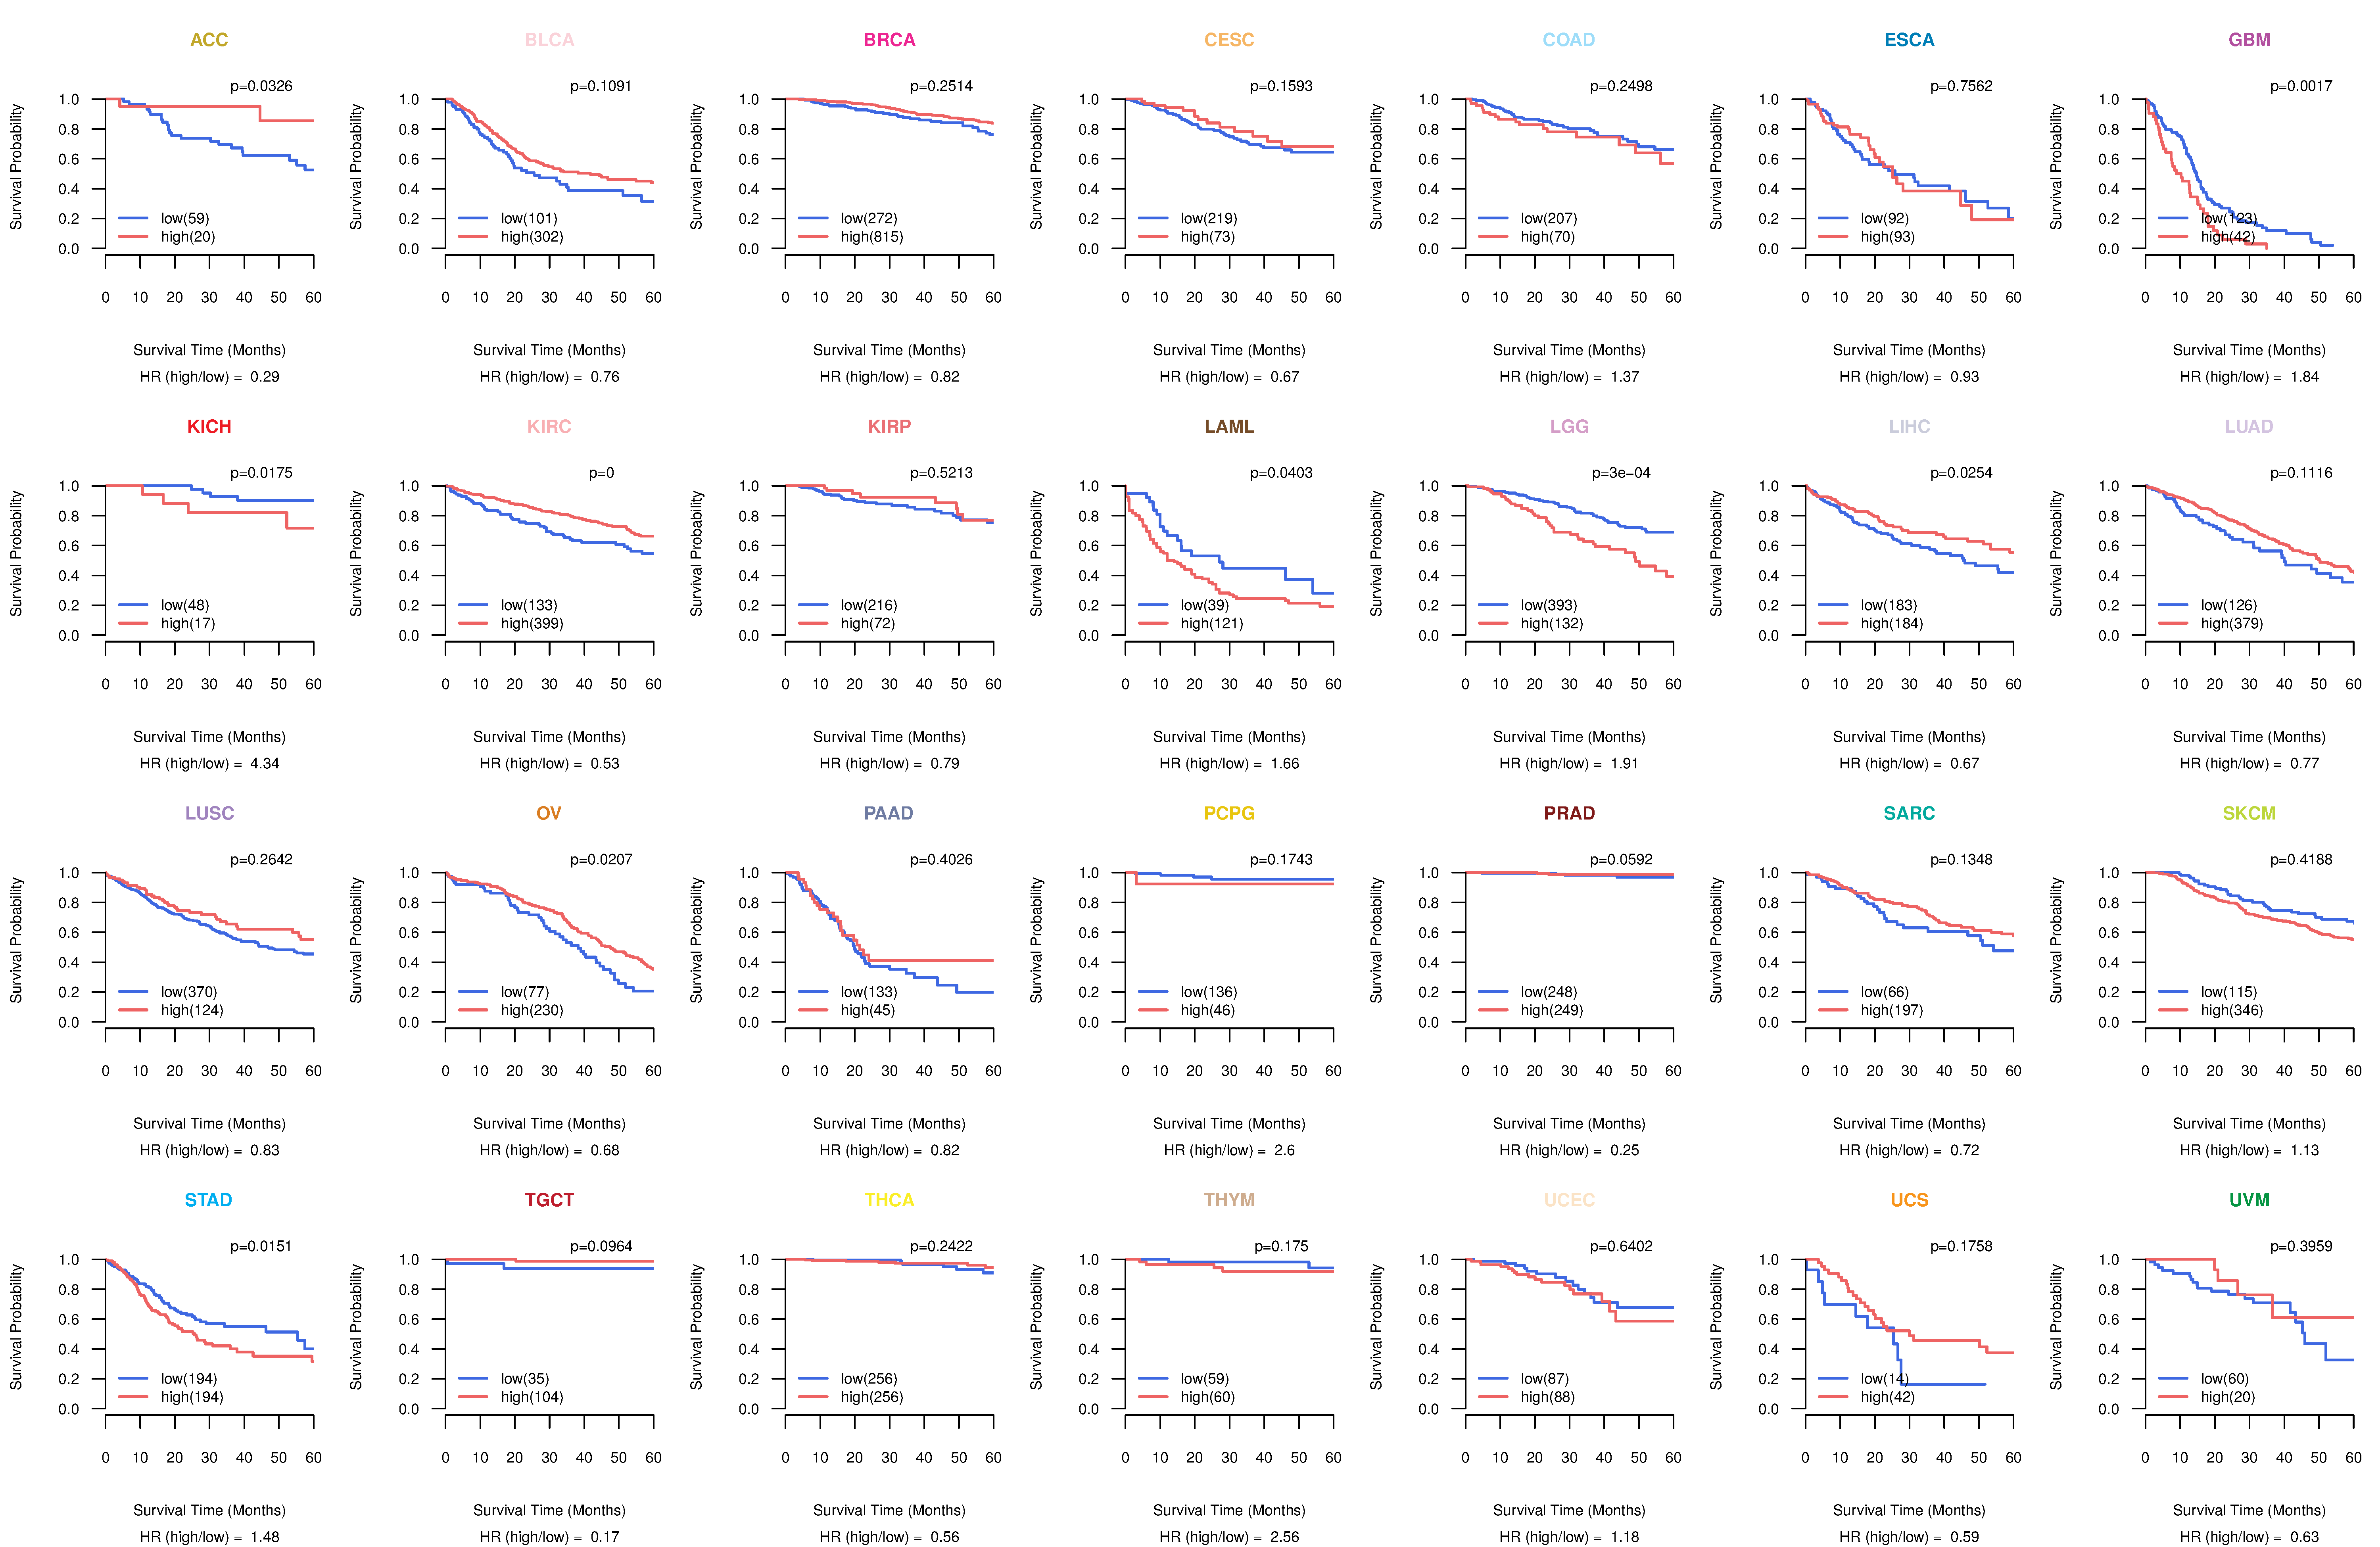
| TissGeneProg for ETNK2 |
| Kaplan-Meier plots with logrank tests of overall survival (OS) using 28 cancer types (TCGA IlluminaHiSeq_RNASeqV2, pan-cancer normalized log2(norm_counts+1) data, version 2016-08-16) (TCGA clinicalMatrix, phenotype data, version 2016-04-27) * Click on the image to enlarge it in a new window. |
 |
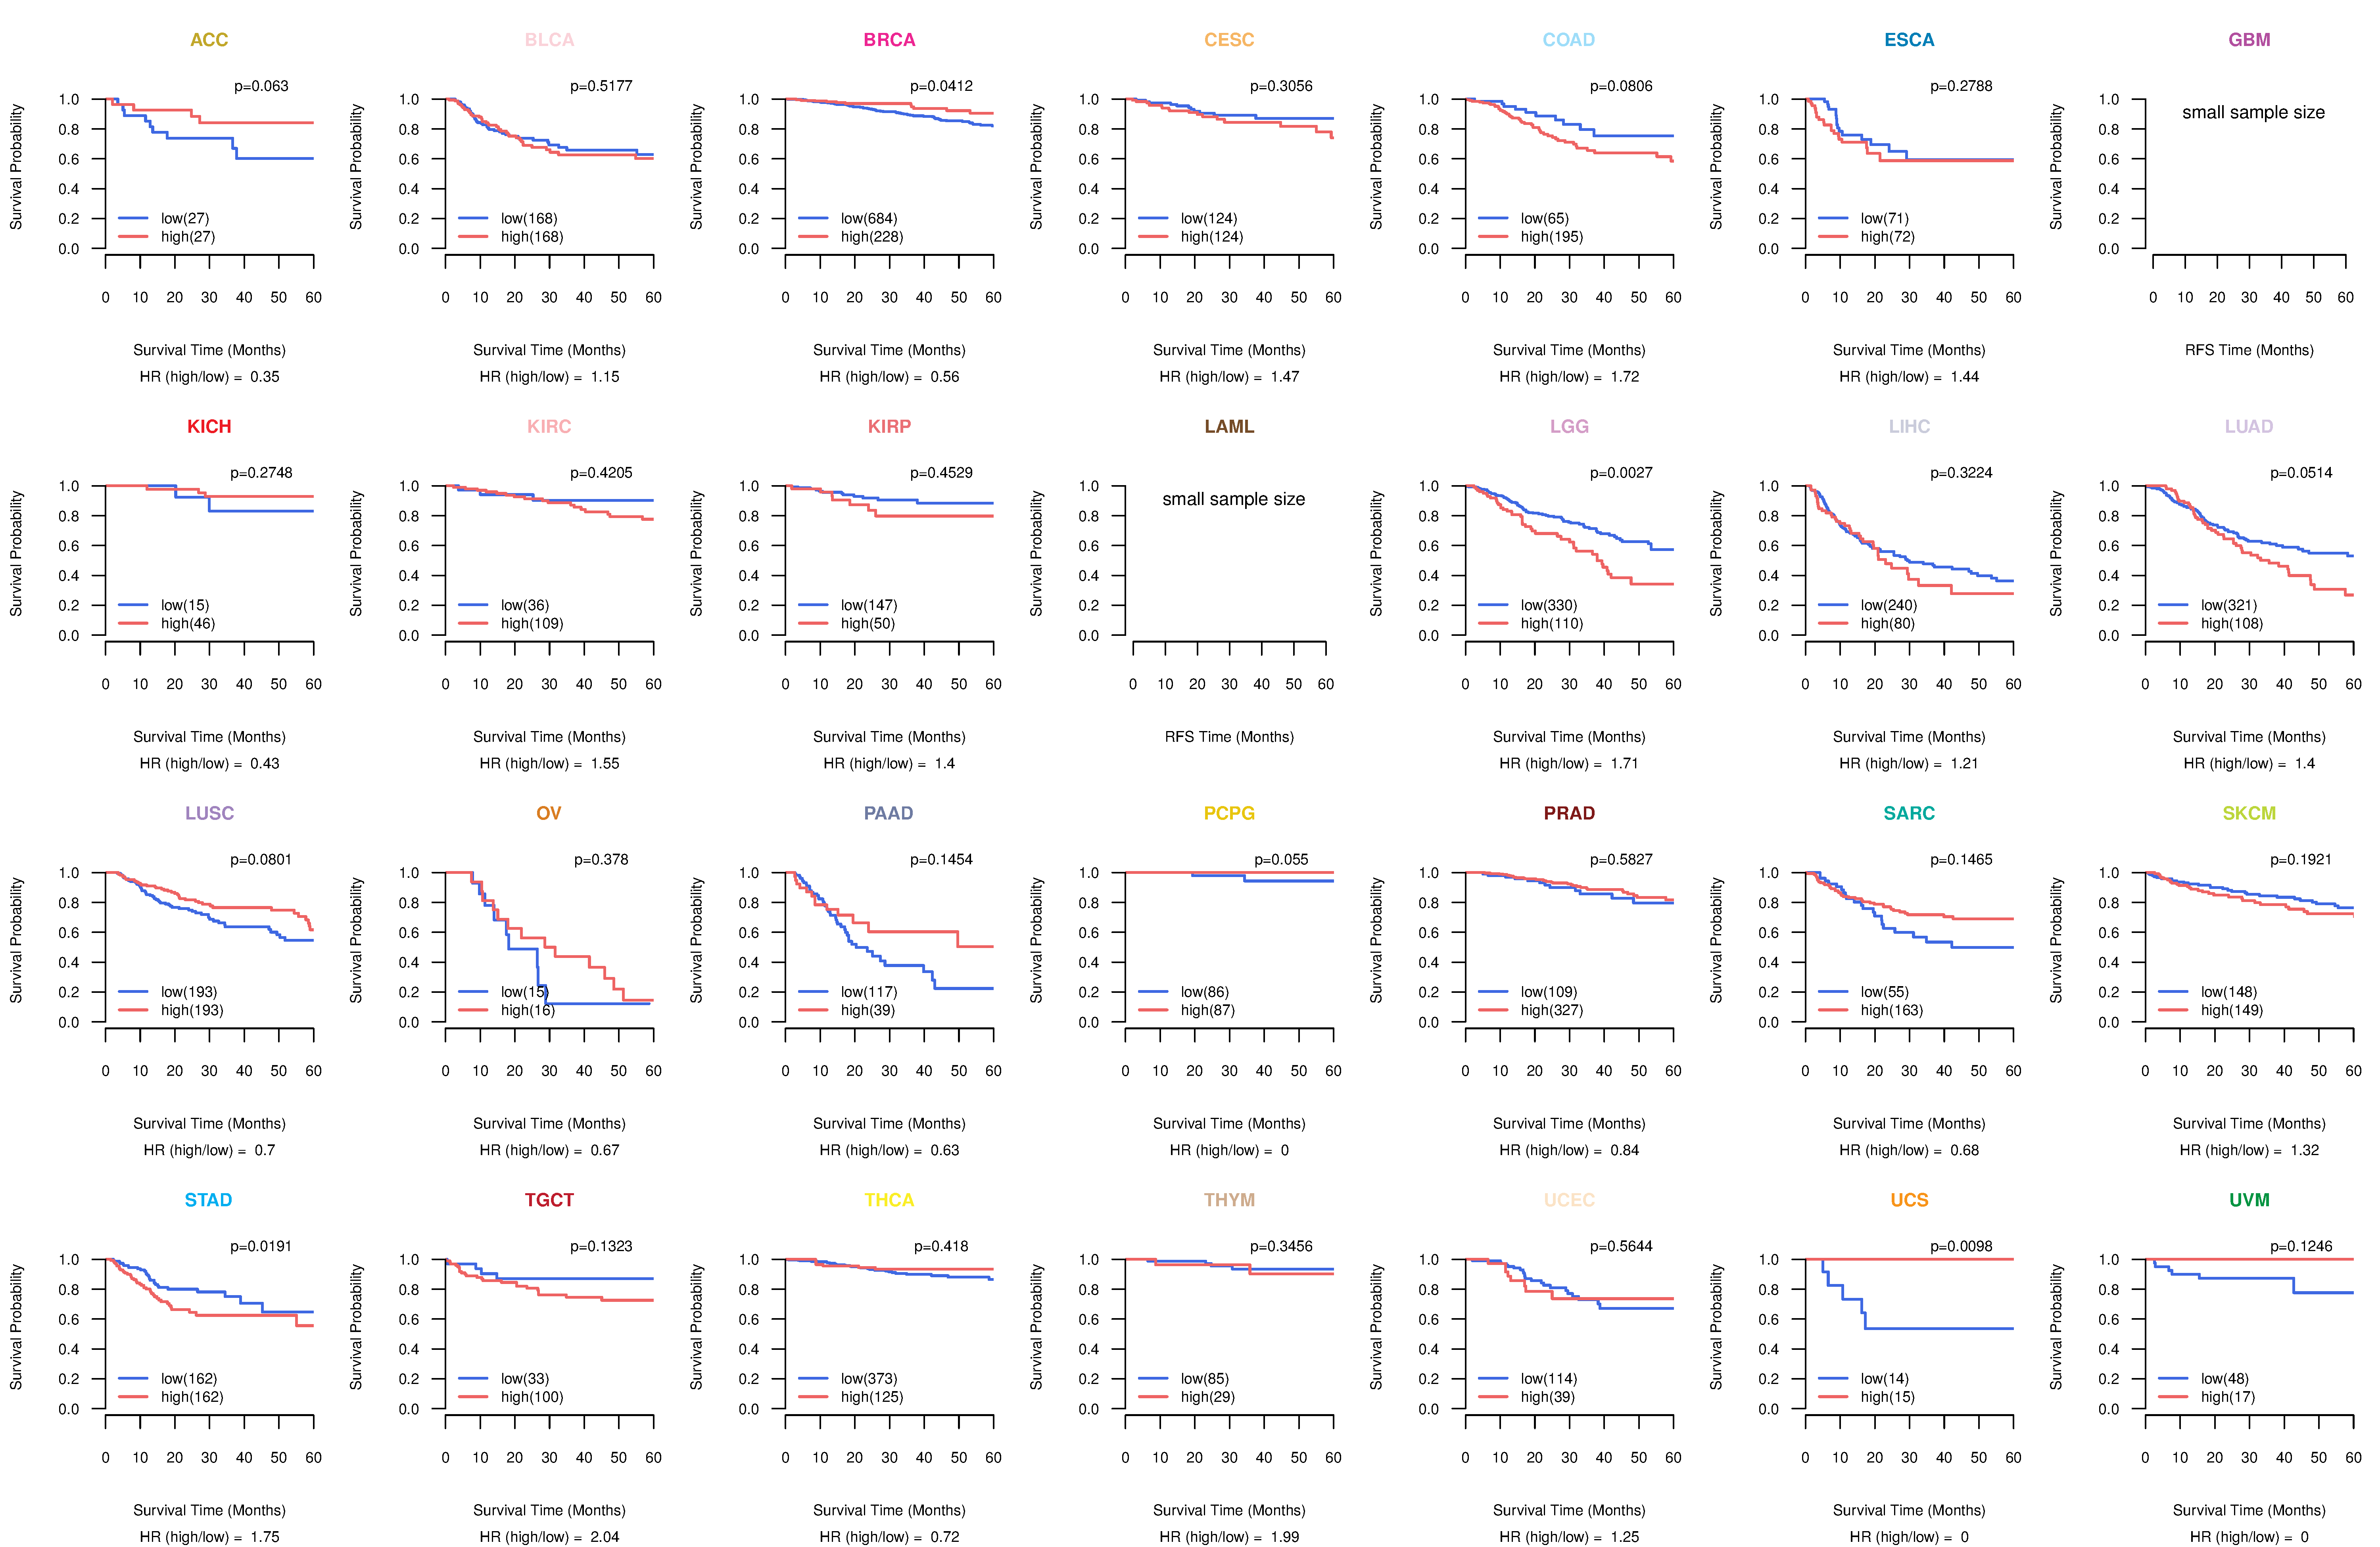
| Kaplan-Meier plots with logrank test of relapse free survival (RFS) using 28 cancer types (TCGA IlluminaHiSeq_RNASeqV2, pan-cancer normalized log2(norm_counts+1) data, version 2016-08-16) (TCGA clinicalMatrix, phenotype data, version 2016-04-27) * Click on the image enlarge it in a new window. |
 |
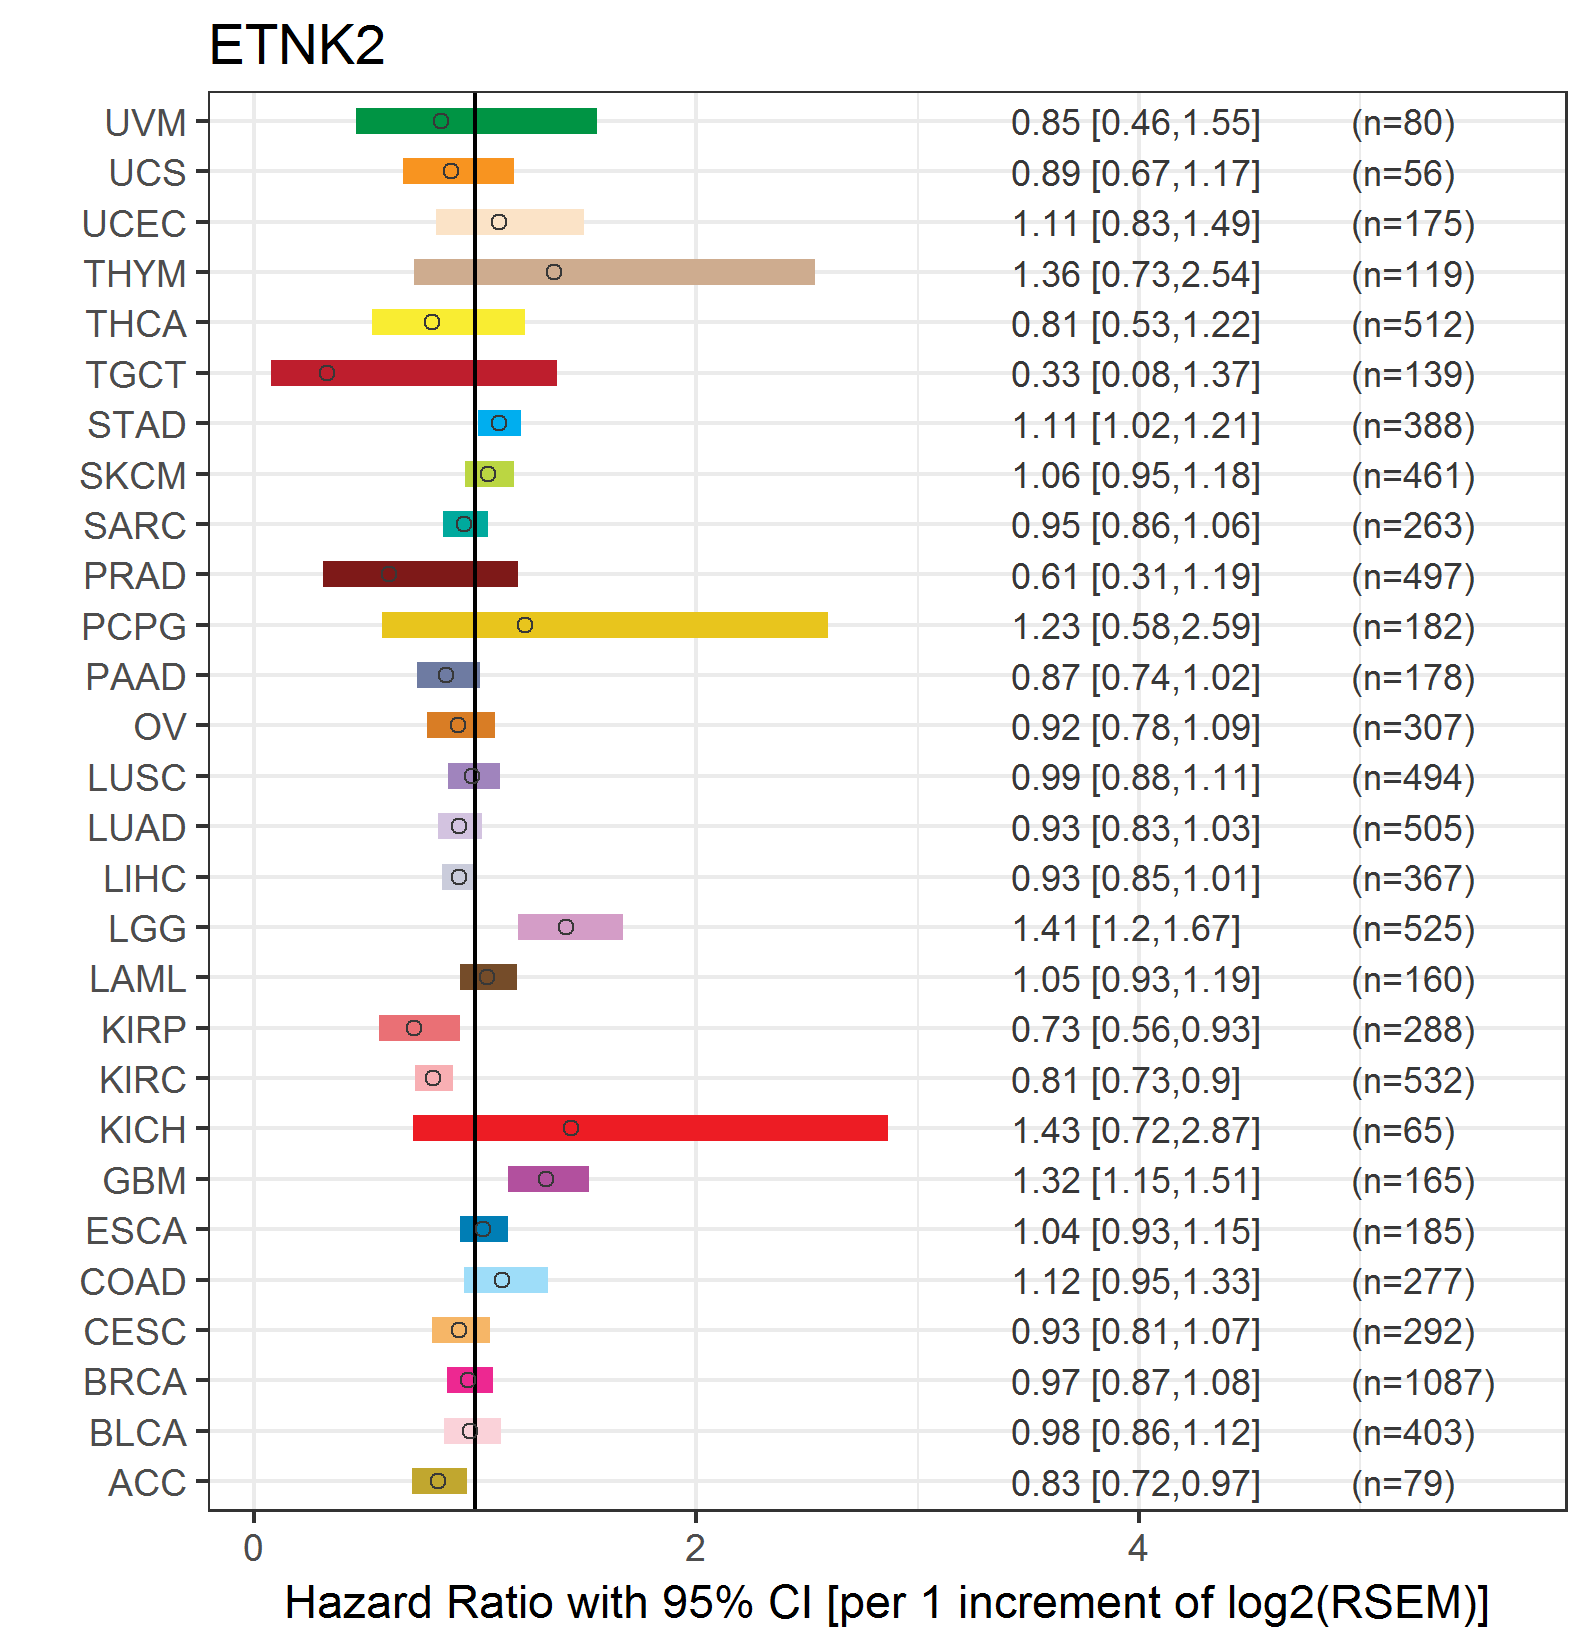
| Forest plot of Cox proportional hazard ratio (HR) and 95% CI of overall survival (OS) using 28 cancer types (TCGA IlluminaHiSeq_RNASeqV2, pan-cancer normalized log2(norm_counts+1) data, version 2016-08-16) (TCGA clinicalMatrix, phenotype data, version 2016-04-27) * Click on the image enlarge it in a new window. |
 |
| Forest plot of Cox proportional hazard ratio (HR) and 95% CI of relapse free survival (RFS) using 28 cancer types (TCGA IlluminaHiSeq_RNASeqV2, pan-cancer normalized log2(norm_counts+1) data, version 2016-08-16) (TCGA clinicalMatrix, phenotype data, version 2016-04-27) * Click on the image enlarge it in a new window. |
 |
| Top |
| TissGeneClin for ETNK2 |
| TissGeneDrug for ETNK2 |
| Drug information targeting TissGene (DrugBank Version 5.0.6, 2017-04-01) |
| DrugBank ID | Drug name | Drug activity | Drug type | Drug status |
| Top |
| TissGeneDisease for ETNK2 |
| Disease information associated with TissGene (DisGeNet, 2016-06-01) |
| Disease ID | Disease name | # pubmeds | Source |
| umls:C0020538 | Hypertensive disease | 1 | GAD |
|
Copyright 2016-Present - The University of Texas Health Science Center at Houston (UTHealth) Web File Viewing | How to Report, Fraud, Waste and Abuse | State of Texas | Statewide Search | Texas Homeland Security | Site Policies |