 |
| |
| |
| |
| |
| |
| |
|

| TissGeneSummary for CASC1 |
 Gene summary Gene summary |
| Basic gene information | Gene symbol | CASC1 |
| Gene name | cancer susceptibility candidate 1 | |
| Synonyms | LAS1|PPP1R54 | |
| Cytomap | UCSC genome browser: 12p12.1 | |
| Type of gene | protein-coding | |
| RefGenes | NM_001082972.1, NM_001082973.1,NM_001204101.1,NM_001204102.1,NM_018272.3, | |
| Description | cancer susceptibility candidate gene 1 proteincancer susceptibility candidate protein 1lung adenoma susceptibility 1-like proteinprotein CASC1protein phosphatase 1, regulatory subunit 54 | |
| Modification date | 20141207 | |
| dbXrefs | HGNC : HGNC | |
| Ensembl : ENSG00000118307 | ||
| HPRD : 16684 | ||
| Vega : OTTHUMG00000150195 | ||
| Protein | UniProt: go to UniProt's Cross Reference DB Table | |
| Expression | CleanEX: HS_CASC1 | |
| BioGPS: 55259 | ||
| Pathway | NCI Pathway Interaction Database: CASC1 | |
| KEGG: CASC1 | ||
| REACTOME: CASC1 | ||
| Pathway Commons: CASC1 | ||
| Context | iHOP: CASC1 | |
| ligand binding site mutation search in PubMed: CASC1 | ||
| UCL Cancer Institute: CASC1 | ||
| Assigned class in TissGDB* | C | |
| Included tissue-specific gene expression resources | TiGER,GTEx | |
| Specific-tissues in normal samples (assigned by TissGDB using HPA, TiGER, and GTEx) | Testis | |
| Cancer types related to the specific-tissues in cancer samples (assigned by TissGDB using TCGA) | TGCT | |
| Reference showing the relevant tissue of CASC1 | ||
| Description by TissGene annotations | Fused withTSGene | |
| * Class A consists of genes with literature evidence and is part of the cTissGenes. Class B consists of only cTissGenes without additional evidence. The remaining genes belong to Class C. |
| Gene ontology having evidence of Inferred from Direct Assay (IDA) from Entrez |
| GO ID | GO term | PubMed ID |
| Top |
| TissGeneExp for CASC1 |
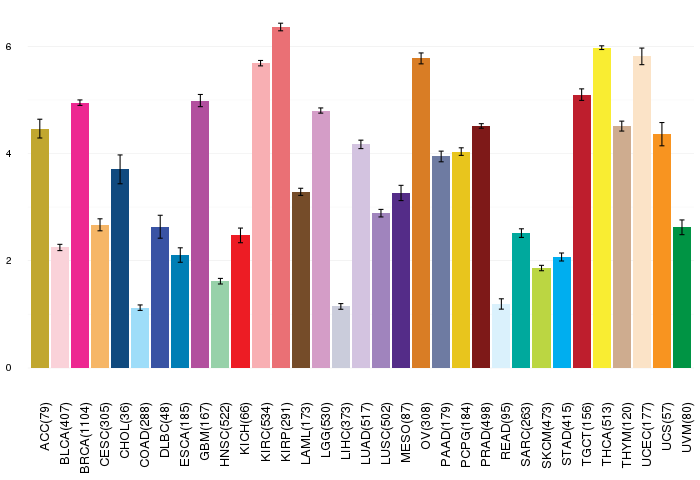
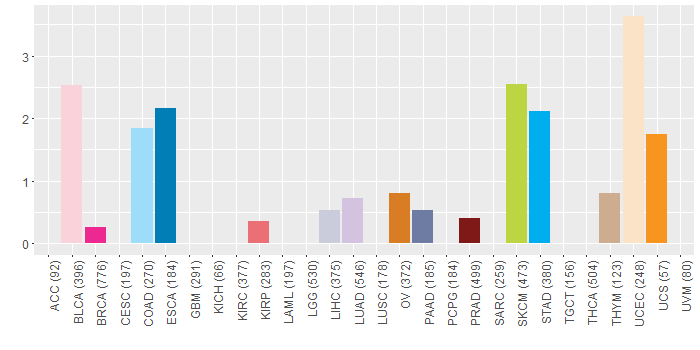
| Gene expressions across 28 cancer types (X-axis: cancer type and Y-axis: log2(norm_counts+1)) (TCGA IlluminaHiSeq_RNASeqV2, pan-cancer normalized log2(norm_counts+1) data, version 2016-08-16) |
 |
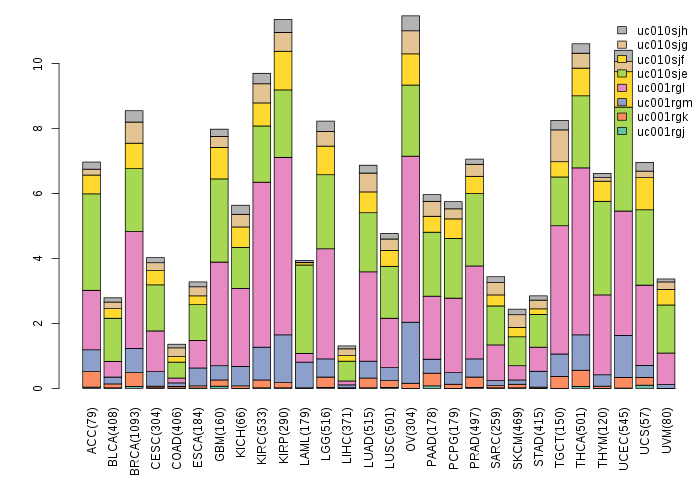
| Gene isoform expressions across 28 cancer types (X-axis: cancer type and Y-axis: log2(norm_counts+1)) (TCGA pan-cancer tcga_rsem_isoform_tpm, version 2016-09-01) |
 |
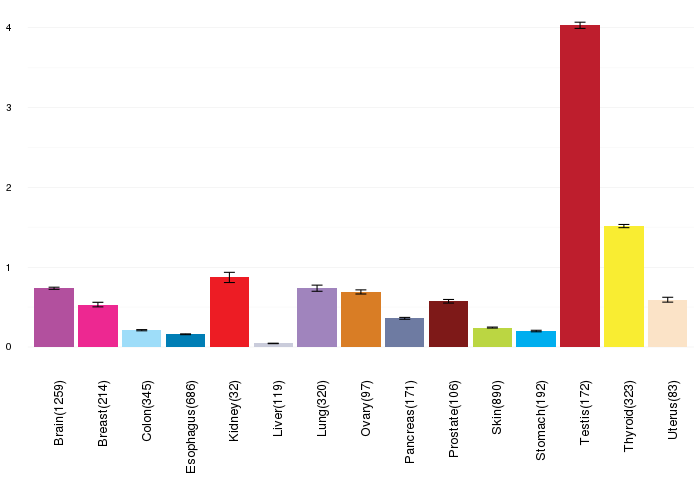
| Gene expressions across normal tissues of GTEx data (GTEx GTEx_Analysis_v6_RNA-seq_RNA-SeQCv1.1.8_gene_rpkm.gct) - Here, we shows the matched tissue types only among our 28 cancer types. |
 |
| Different expressions across 14 cancer types with more than 10 samples between matched tumors and normals (X-axis: cancer type and Y-axis: log2(norm_counts+1)) (TCGA IlluminaHiSeq_RNASeqV2, pan-cancer normalized log2(norm_counts+1) data, version 2016-08-16) |
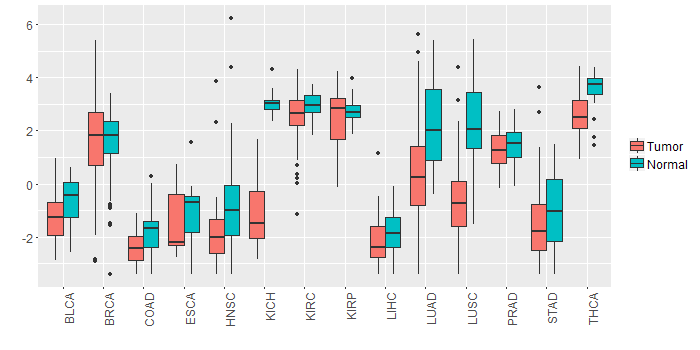 |
| - Significantly differentially expressed cancer types and information. (|Fold change|>1 and FDR<0.05) |
| Cancer type | Mean(exp) in tumor | Mean(exp) in matched normal | Log2FC | P-val. | FDR |
| KICH | -1.106028852 | 3.039763148 | -4.145792 | 6.61E-17 | 2.39E-15 |
| THCA | 2.565341724 | 3.619046809 | -1.053705085 | 2.48E-12 | 2.04E-11 |
| LUAD | 0.362929217 | 2.273539562 | -1.910610345 | 4.19E-08 | 1.73E-07 |
| LUSC | -0.553323048 | 2.227112246 | -2.780435294 | 2.18E-14 | 1.23E-13 |
| HNSC | -1.852525875 | -0.582700294 | -1.269825581 | 0.000607 | 0.00219574 |
| Top |
| TissGene-miRNA for CASC1 |
| Significantly anti-correlated miRNAs of TissGene across 28 cancer types (Gene-miRNA relations from TargetScanHuman Relsease 7.1, Conserved_Site_Context_Scores.txt.zip, 06.01.2016) (TCGA IlluminaHiSeq_miRNASeq, log2(RPM+1) data, version 2016-11-21) (TCGA IlluminaHiSeq_RNASeqV2, log2(normalized_count+1) data, version 2016-08-16) (Spearman’s Rank Correlation (p-value<0.05 and coefficient<-0.25)) |
| Cancer type | miRNA id | miRNA accession | P-val. | Coeff. | # samples |
| Top |
| TissGeneMut for CASC1 |
| TissGeneSNV for CASC1 |
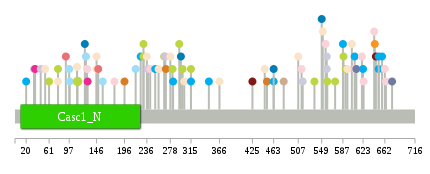
| nsSNV counts per each loci. Different colors of circles represent different cancer types. Circle size denotes number of samples. (TCGA somatic mutation (SNPs and small INDELs) data, version 2016-04-25) * Click on the image to enlarge it in a new window. |
 |
 |
| Somatic nucleotide variants of TissGene across 28 cancer types (X-axis: cancer type and Y-axis: % of mutated samples) The numbers in parentheses are numbers of samples with mutation (nsSNVs). (TCGA somatic mutation (SNPs and small INDELs) data, version 2016-04-25) |
 |
| - nsSNVs sorted by frequency. |
| AAchange | Cancer type | # samples |
| p.R112Q | SKCM | 2 |
| p.G300E | SKCM | 1 |
| p.H561D | HNSC | 1 |
| p.Q230* | SKCM | 1 |
| p.E278* | UCEC | 1 |
| p.L91S | KIRP | 1 |
| p.N146S | UCEC | 1 |
| p.S46F | LUAD | 1 |
| p.R54Q | UCEC | 1 |
| p.R315G | STAD | 1 |
| p.T130K | BRCA | 1 |
| p.R128M | HNSC | 1 |
| p.P595S | UCEC | 1 |
| p.E267K | SKCM | 1 |
| p.L242V | BLCA | 1 |
| p.E366D | UCEC | 1 |
| p.E238* | LUAD | 1 |
| p.R97S | COAD | 1 |
| p.N425S | PRAD | 1 |
| p.P515A | LIHC | 1 |
| p.R609T | BLCA | 1 |
| p.F294L | SKCM | 1 |
| p.V269F | LUAD | 1 |
| p.E77* | UCEC | 1 |
| p.F236L | UCEC | 1 |
| p.D347Y | STAD | 1 |
| p.L98S | COAD | 1 |
| p.E36G | BRCA | 1 |
| p.V623I | STAD | 1 |
| p.D559N | SKCM | 1 |
| p.E303K | UCEC | 1 |
| p.K651N | STAD | 1 |
| p.E77K | SKCM | 1 |
| p.L556F | BLCA | 1 |
| p.E573K | SKCM | 1 |
| p.E504Q | HNSC | 1 |
| p.E624* | BLCA | 1 |
| p.V451L | OV | 1 |
| p.D125E | ESCA | 1 |
| p.D283Y | STAD | 1 |
| p.Q657R | STAD | 1 |
| p.H225N | STAD | 1 |
| p.T216P | COAD | 1 |
| p.L149S | KIRP | 1 |
| p.M468I | HNSC | 1 |
| p.F644C | UCS | 1 |
| p.L178V | BLCA | 1 |
| p.Q196E | OV | 1 |
| p.V646G | PRAD | 1 |
| p.P463T | ESCA | 1 |
| p.Q94* | HNSC | 1 |
| p.E378X | DLBC | 1 |
| p.V447A | UCEC | 1 |
| p.I636M | HNSC | 1 |
| p.E127X | COAD | 1 |
| p.K551N | UCEC | 1 |
| p.K587N | STAD | 1 |
| p.Q158* | HNSC | 1 |
| p.H270Y | OV | 1 |
| p.P111H | UCEC | 1 |
| p.R129T | BLCA | 1 |
| p.L34F | LUAD | 1 |
| p.S157F | COAD | 1 |
| p.A664S | BLCA | 1 |
| p.S662C | BLCA | 1 |
| p.R112Q | READ | 1 |
| p.S536F | SKCM | 1 |
| p.E592K | SKCM | 1 |
| p.N282S | SKCM | 1 |
| p.S611N | PAAD | 1 |
| p.M404I | HNSC | 1 |
| p.S675N | PAAD | 1 |
| p.T481K | THYM | 1 |
| p.W463R | STAD | 1 |
| p.E132K | READ | 1 |
| p.P507L | UCEC | 1 |
| p.H643Y | BLCA | 1 |
| p.R251G | STAD | 1 |
| p.R603Q | UCEC | 1 |
| p.R257* | UCEC | 1 |
| p.Q558X | LIHC | 1 |
| p.H497D | HNSC | 1 |
| p.R315Q | SKCM | 1 |
| p.P61S | SKCM | 1 |
| p.D608Y | STAD | 1 |
| p.Q230X | SKCM | 1 |
| p.D549Y | ESCA | 1 |
| p.V20A | STAD | 1 |
| p.T621I | BLCA | 1 |
| p.Q558* | LIHC | 1 |
| p.E440Q | HNSC | 1 |
| p.N146T | UCEC | 1 |
| p.T297K | ESCA | 1 |
| p.E588K | SKCM | 1 |
| p.Q651R | STAD | 1 |
| p.E513K | BLCA | 1 |
| Top |
| TissGeneCNV for CASC1 |
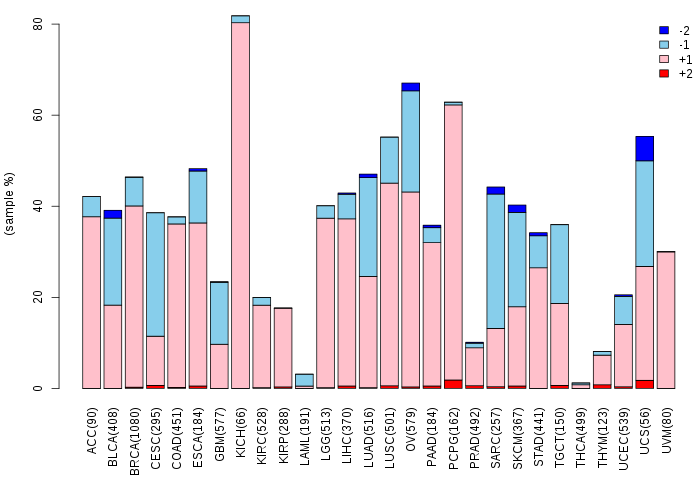
| Copy number variations of TissGene across 28 cancer types (X-axis: cancer type and Y-axis: % of CNV samples) (TCGA Gistic2_CopyNumber_Gistic2_all_data_by_genes, Gistic2 copy number data, version 2016-08-16) |
 |
| Top |
| TissGeneFusions for CASC1 |
| Fusion genes including TissGene (ChimerDB 3.0, 2016-12-01 and TCGA fusion Portal 2015-12-01) |
| Database | Src | Cancer type | Sample | Fusion gene | ORF | 5'-gene BP | 3'-gene BP |
| Chimerdb3.0 | FusionScan | LGG | TCGA-DU-7007-01A | TMTC1-CASC1 | In-Frame | chr12:29664975 | chr12:25264873 |
| Chimerdb3.0 | FusionScan | ESCA | TCGA-Z6-A8JE-01A | RASSF8-CASC1 | 5'UTR-CDS | chr12:26148063 | chr12:25308346 |
| TCGAfusionPortal | PRADA | LGG | TCGA-DU-7007-01A | TMTC1-CASC1 | In-frame | Chr12:29664976 | Chr12:25264873 |
| TCGAfusionPortal | PRADA | LUAD | TCGA-86-7954-01A | CASC1-PLEKHA5 | Out-of-frame | Chr12:25348010 | Chr12:19406874 |
| Top |
| TissGeneNet for CASC1 |
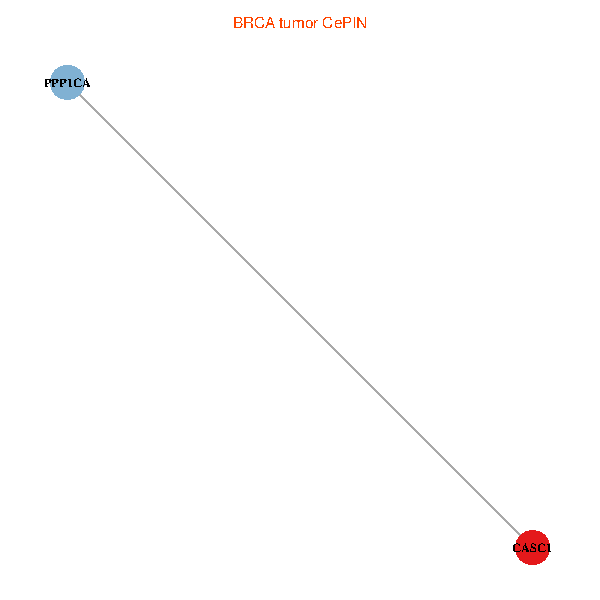
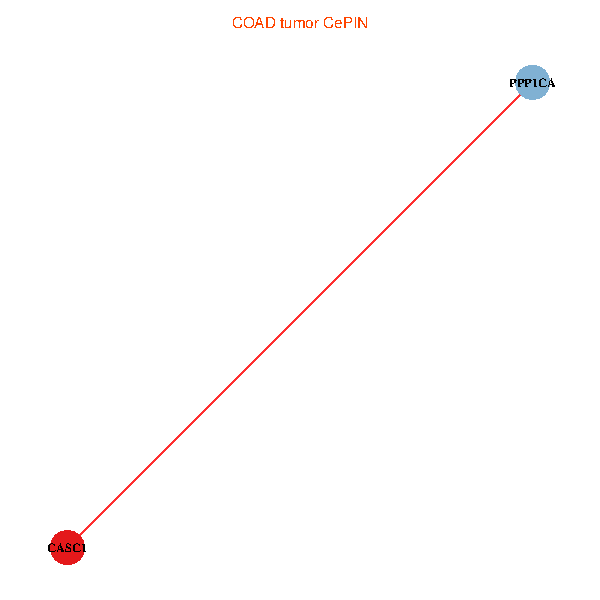
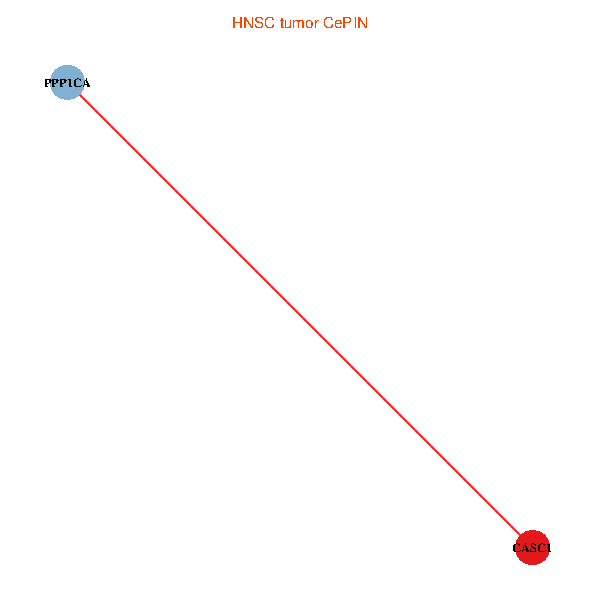
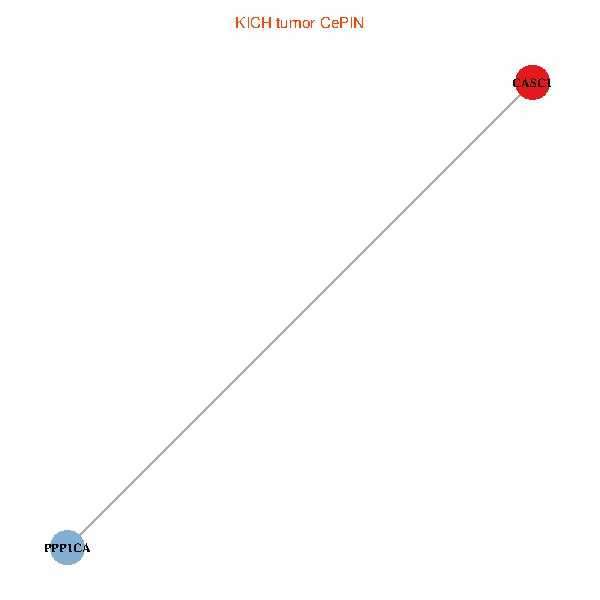
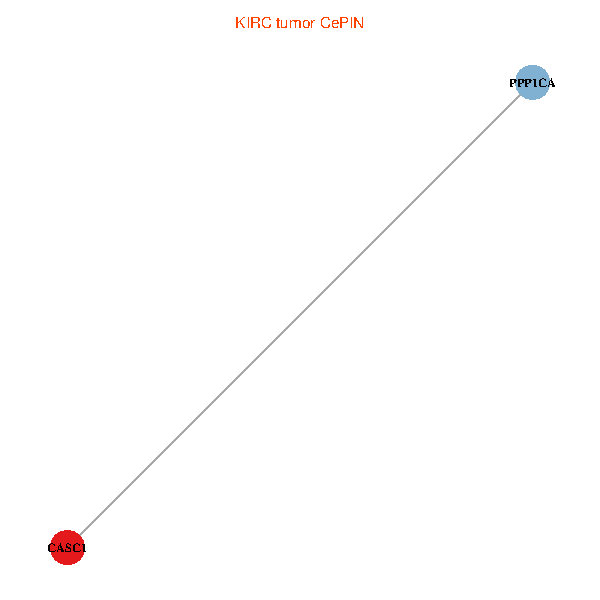
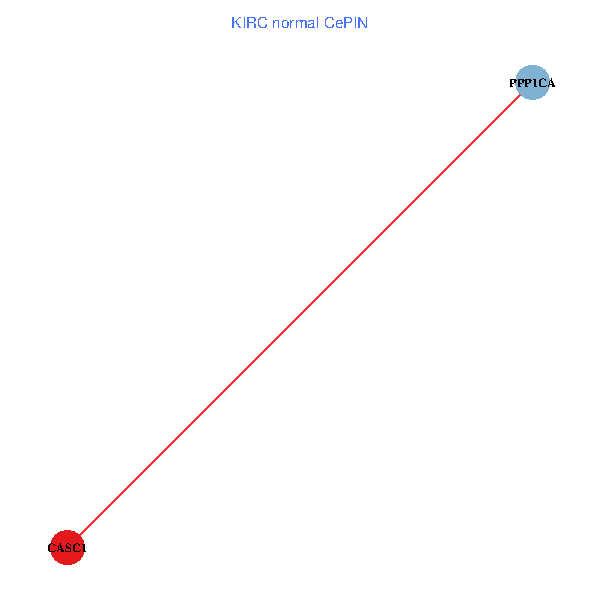
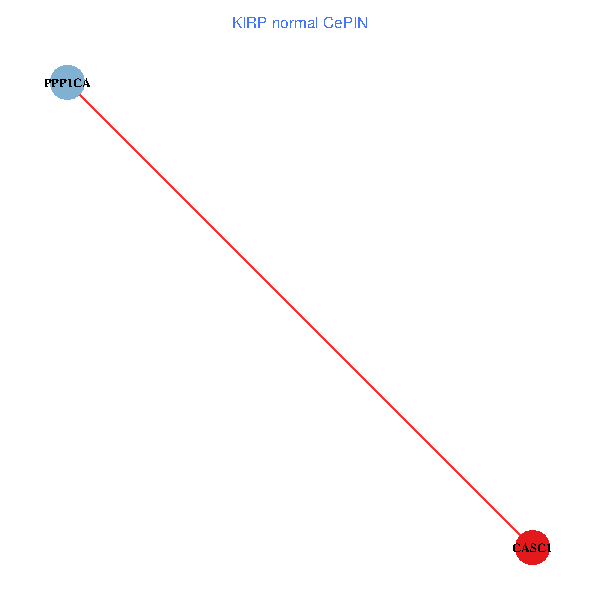
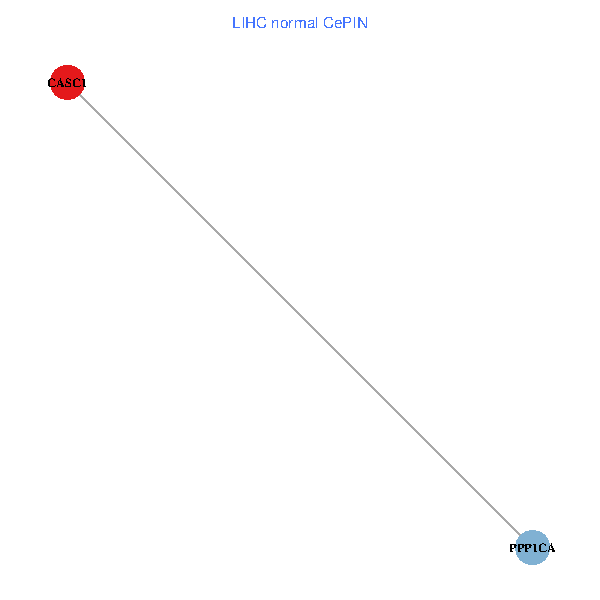
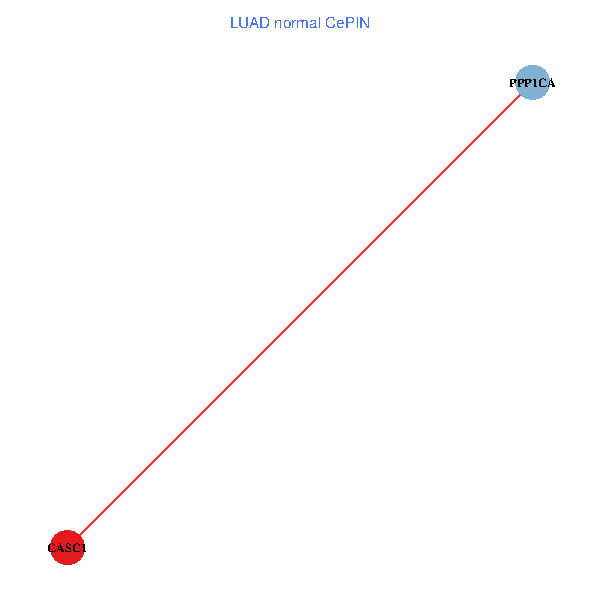
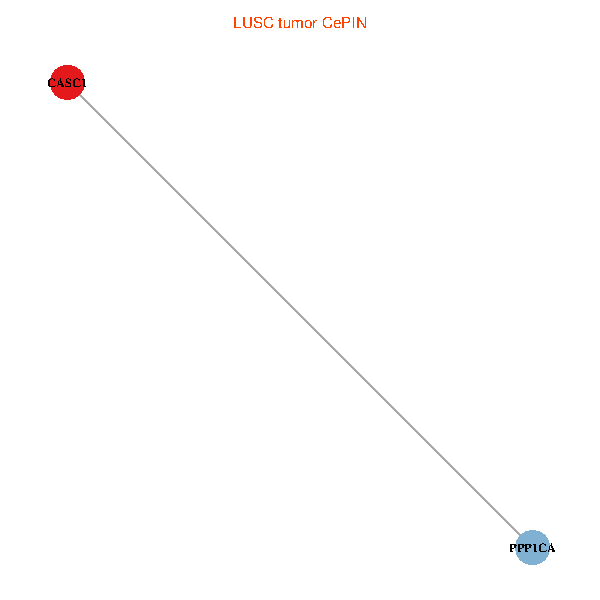
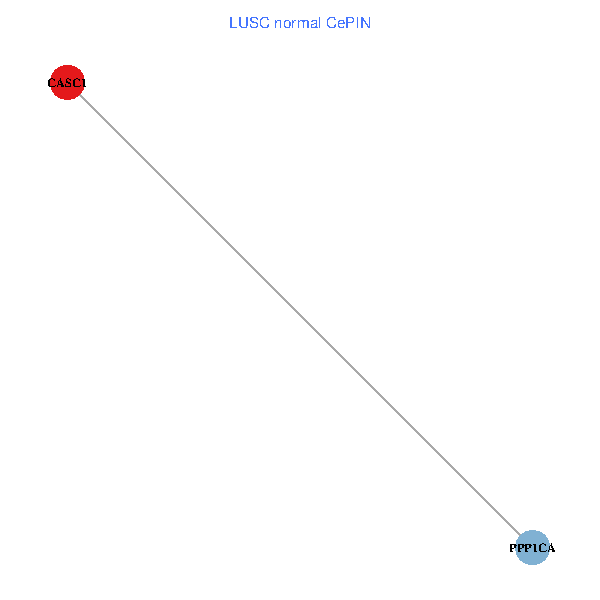
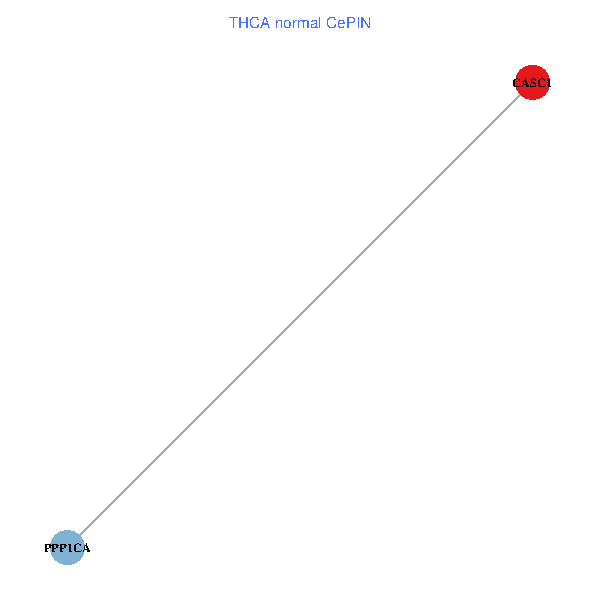
| Co-expressed gene networks based on protein-protein interaction data (CePIN) (TCGA IlluminaHiSeq_RNASeqV2, pan-cancer normalized log2(norm_counts+1) data, version 2016-08-16) (PINA2 ppi data) |
| BRCA (tumor) | BRCA (normal) |
| CASC1, PPP1CA (tumor) | CASC1, PPP1CA (normal) |
 |  |
| COAD (tumor) | COAD (normal) |
| CASC1, PPP1CA (tumor) | CASC1, PPP1CA (normal) |
 |  |
| HNSC (tumor) | HNSC (normal) |
| CASC1, PPP1CA (tumor) | CASC1, PPP1CA (normal) |
 |  |
| KICH (tumor) | KICH (normal) |
| CASC1, PPP1CA (tumor) | CASC1, PPP1CA (normal) |
 |  |
| KIRC (tumor) | KIRC (normal) |
| CASC1, PPP1CA (tumor) | CASC1, PPP1CA (normal) |
 |  |
| KIRP (tumor) | KIRP (normal) |
| CASC1, PPP1CA (tumor) | CASC1, PPP1CA (normal) |
 |  |
| LIHC (tumor) | LIHC (normal) |
| CASC1, PPP1CA (tumor) | CASC1, PPP1CA (normal) |
 |  |
| LUAD (tumor) | LUAD (normal) |
| CASC1, PPP1CA (tumor) | CASC1, PPP1CA (normal) |
 |  |
| LUSC (tumor) | LUSC (normal) |
| CASC1, PPP1CA (tumor) | CASC1, PPP1CA (normal) |
 |  |
| PRAD (tumor) | PRAD (normal) |
| CASC1, PPP1CA (tumor) | CASC1, PPP1CA (normal) |
 |  |
| STAD (tumor) | STAD (normal) |
| CASC1, PPP1CA (tumor) | CASC1, PPP1CA (normal) |
 |  |
| THCA (tumor) | THCA (normal) |
| CASC1, PPP1CA (tumor) | CASC1, PPP1CA (normal) |
 |  |
| Top |
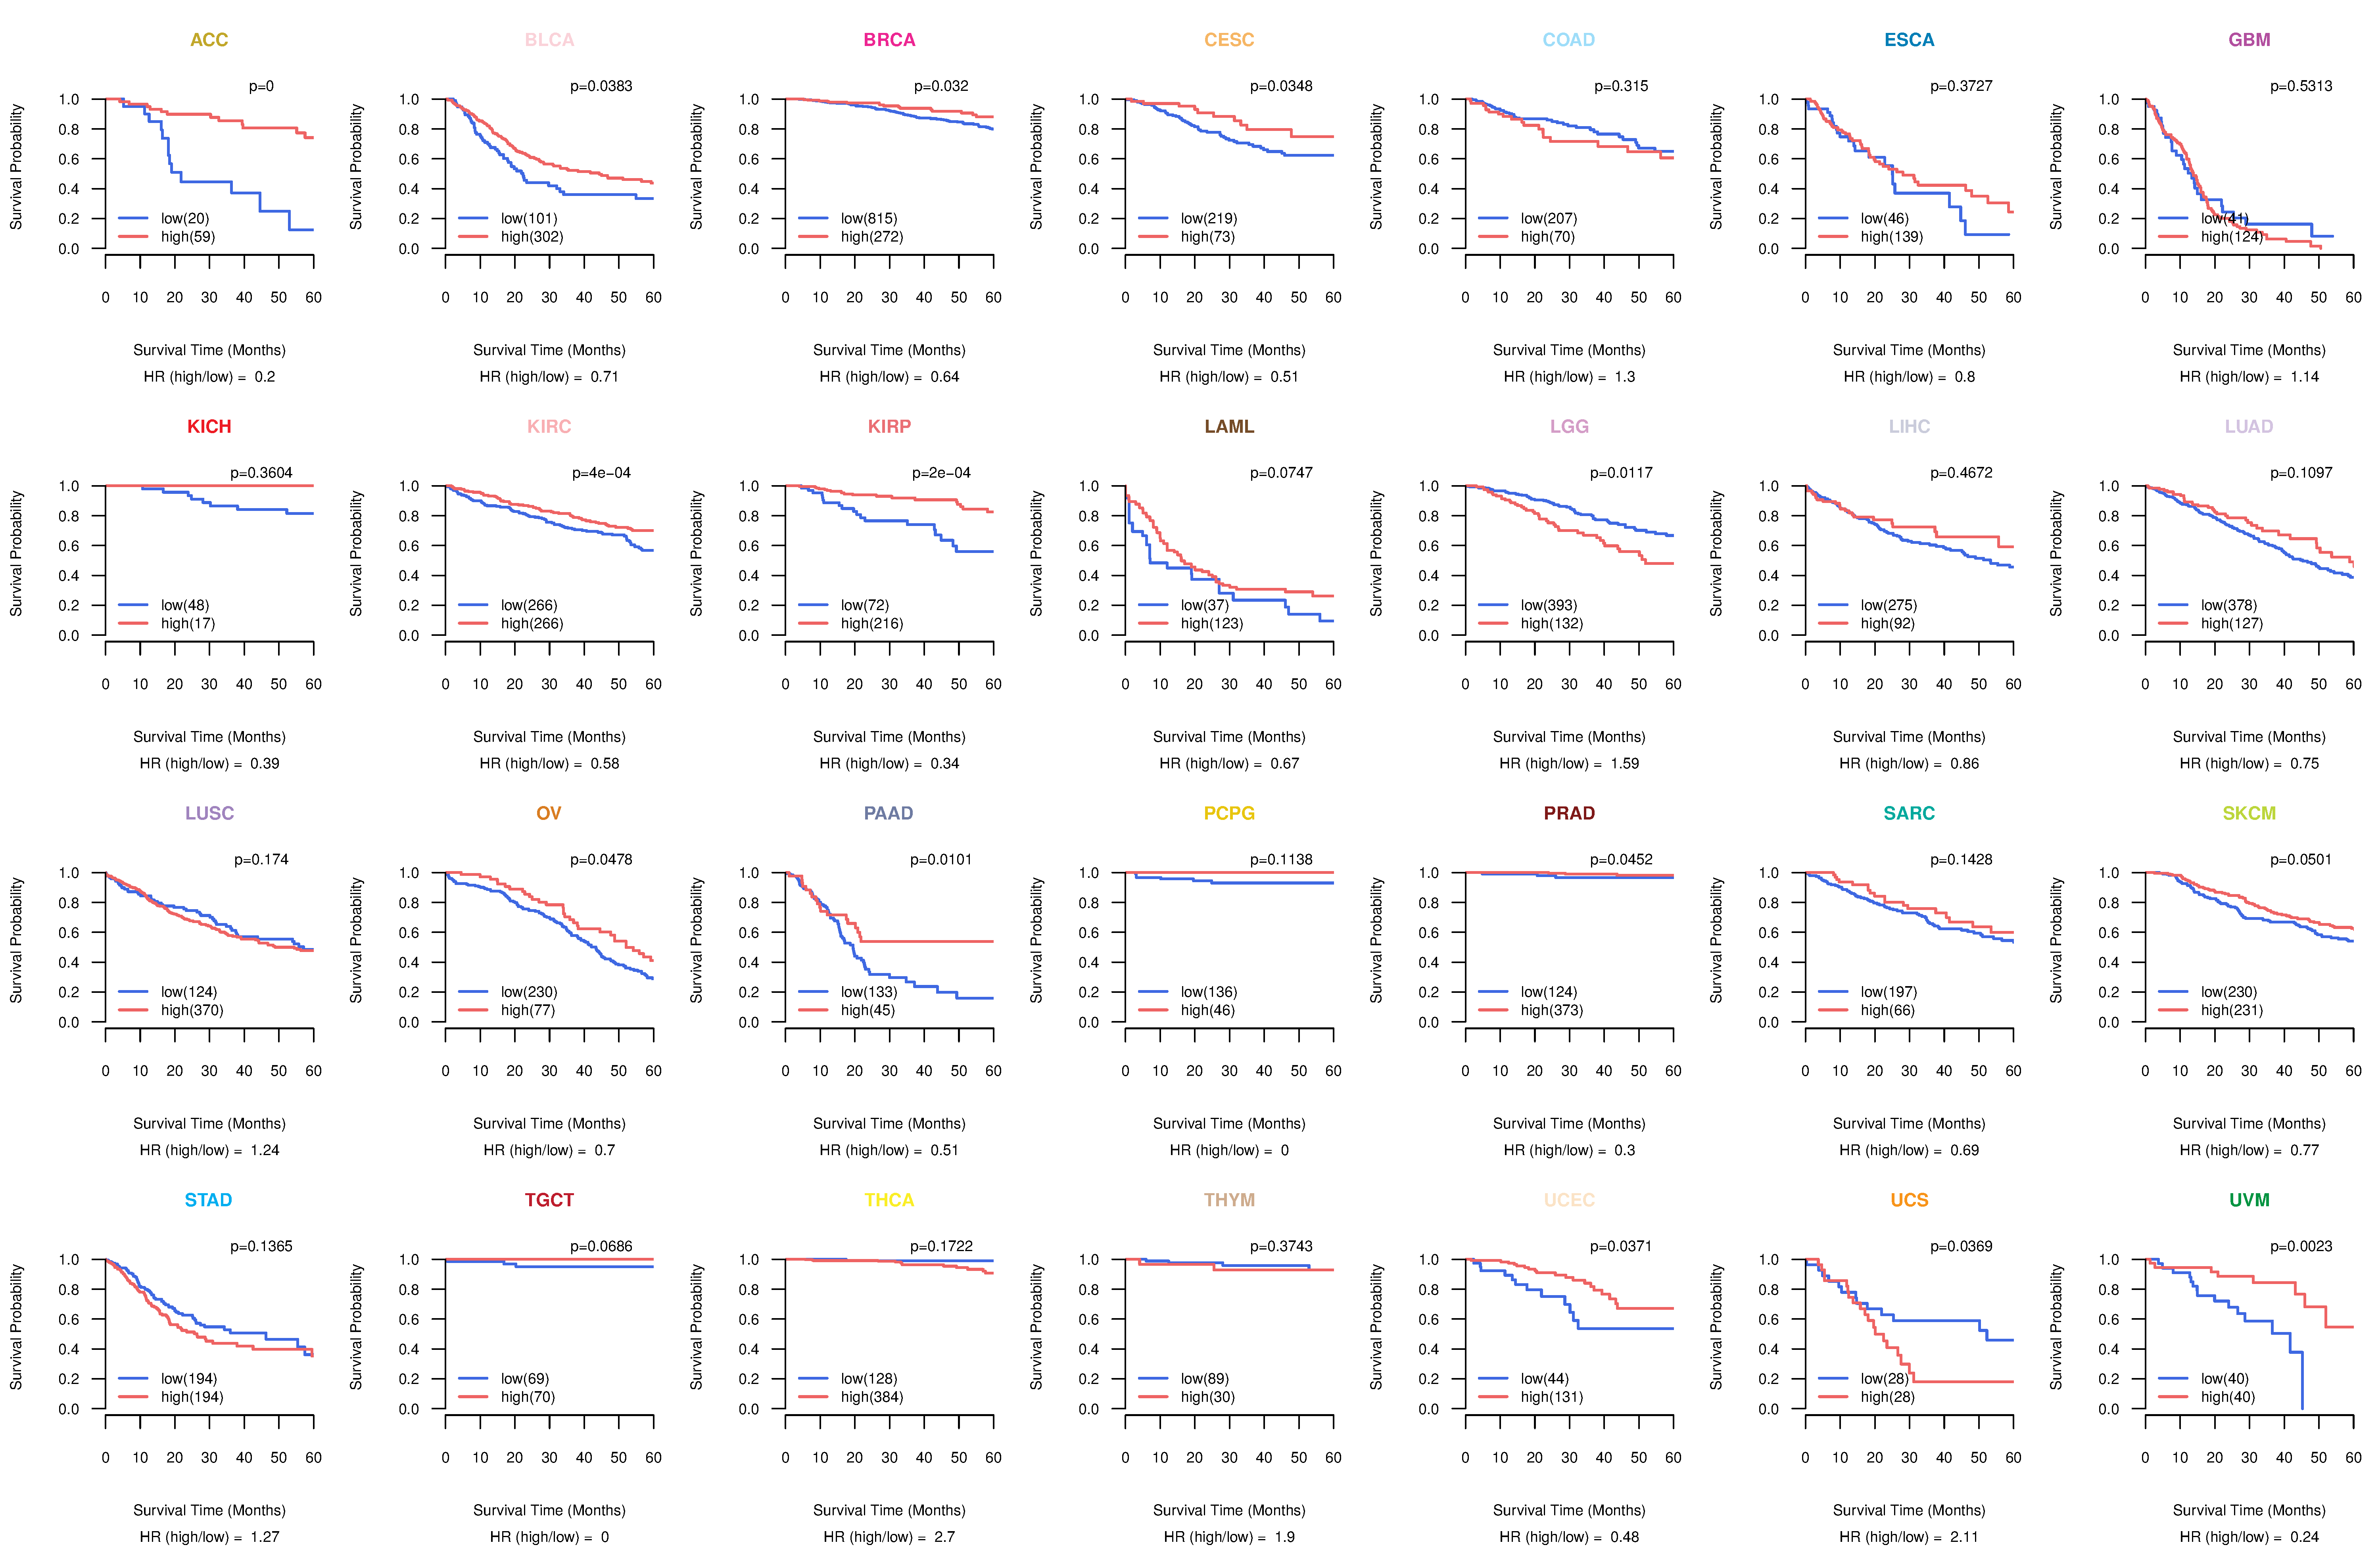
| TissGeneProg for CASC1 |
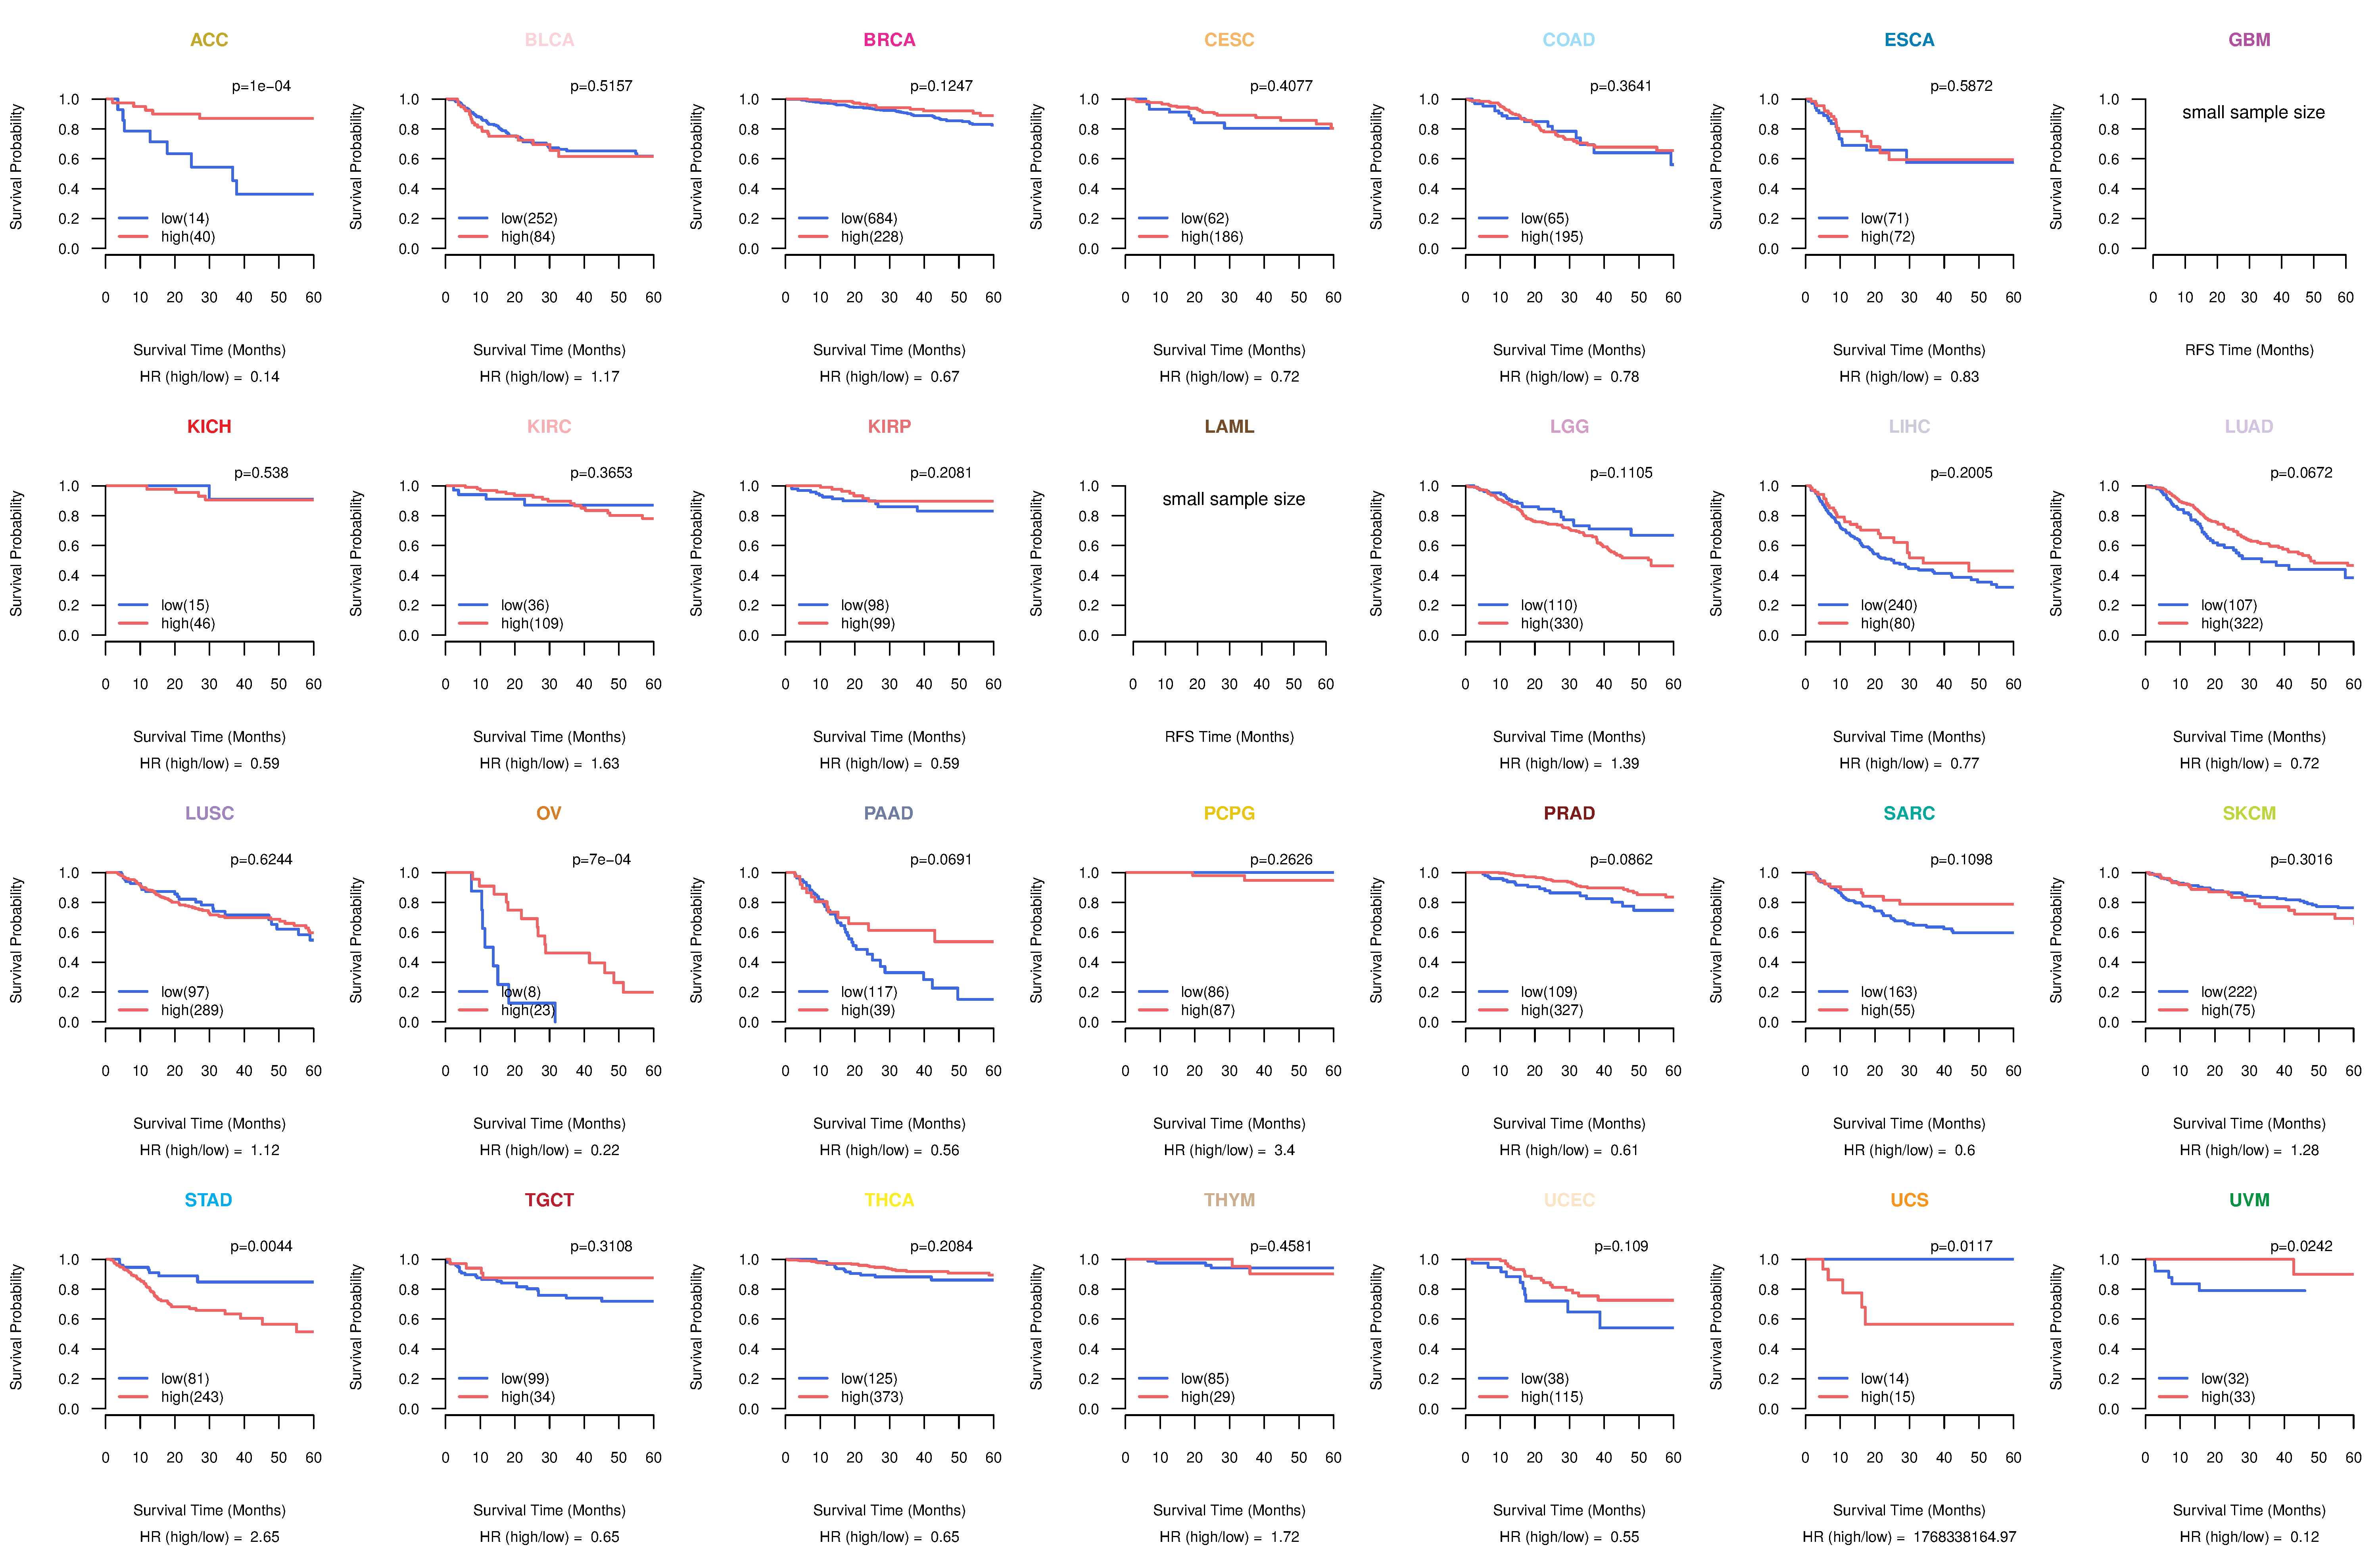
| Kaplan-Meier plots with logrank tests of overall survival (OS) using 28 cancer types (TCGA IlluminaHiSeq_RNASeqV2, pan-cancer normalized log2(norm_counts+1) data, version 2016-08-16) (TCGA clinicalMatrix, phenotype data, version 2016-04-27) * Click on the image to enlarge it in a new window. |
 |
| Kaplan-Meier plots with logrank test of relapse free survival (RFS) using 28 cancer types (TCGA IlluminaHiSeq_RNASeqV2, pan-cancer normalized log2(norm_counts+1) data, version 2016-08-16) (TCGA clinicalMatrix, phenotype data, version 2016-04-27) * Click on the image enlarge it in a new window. |
 |
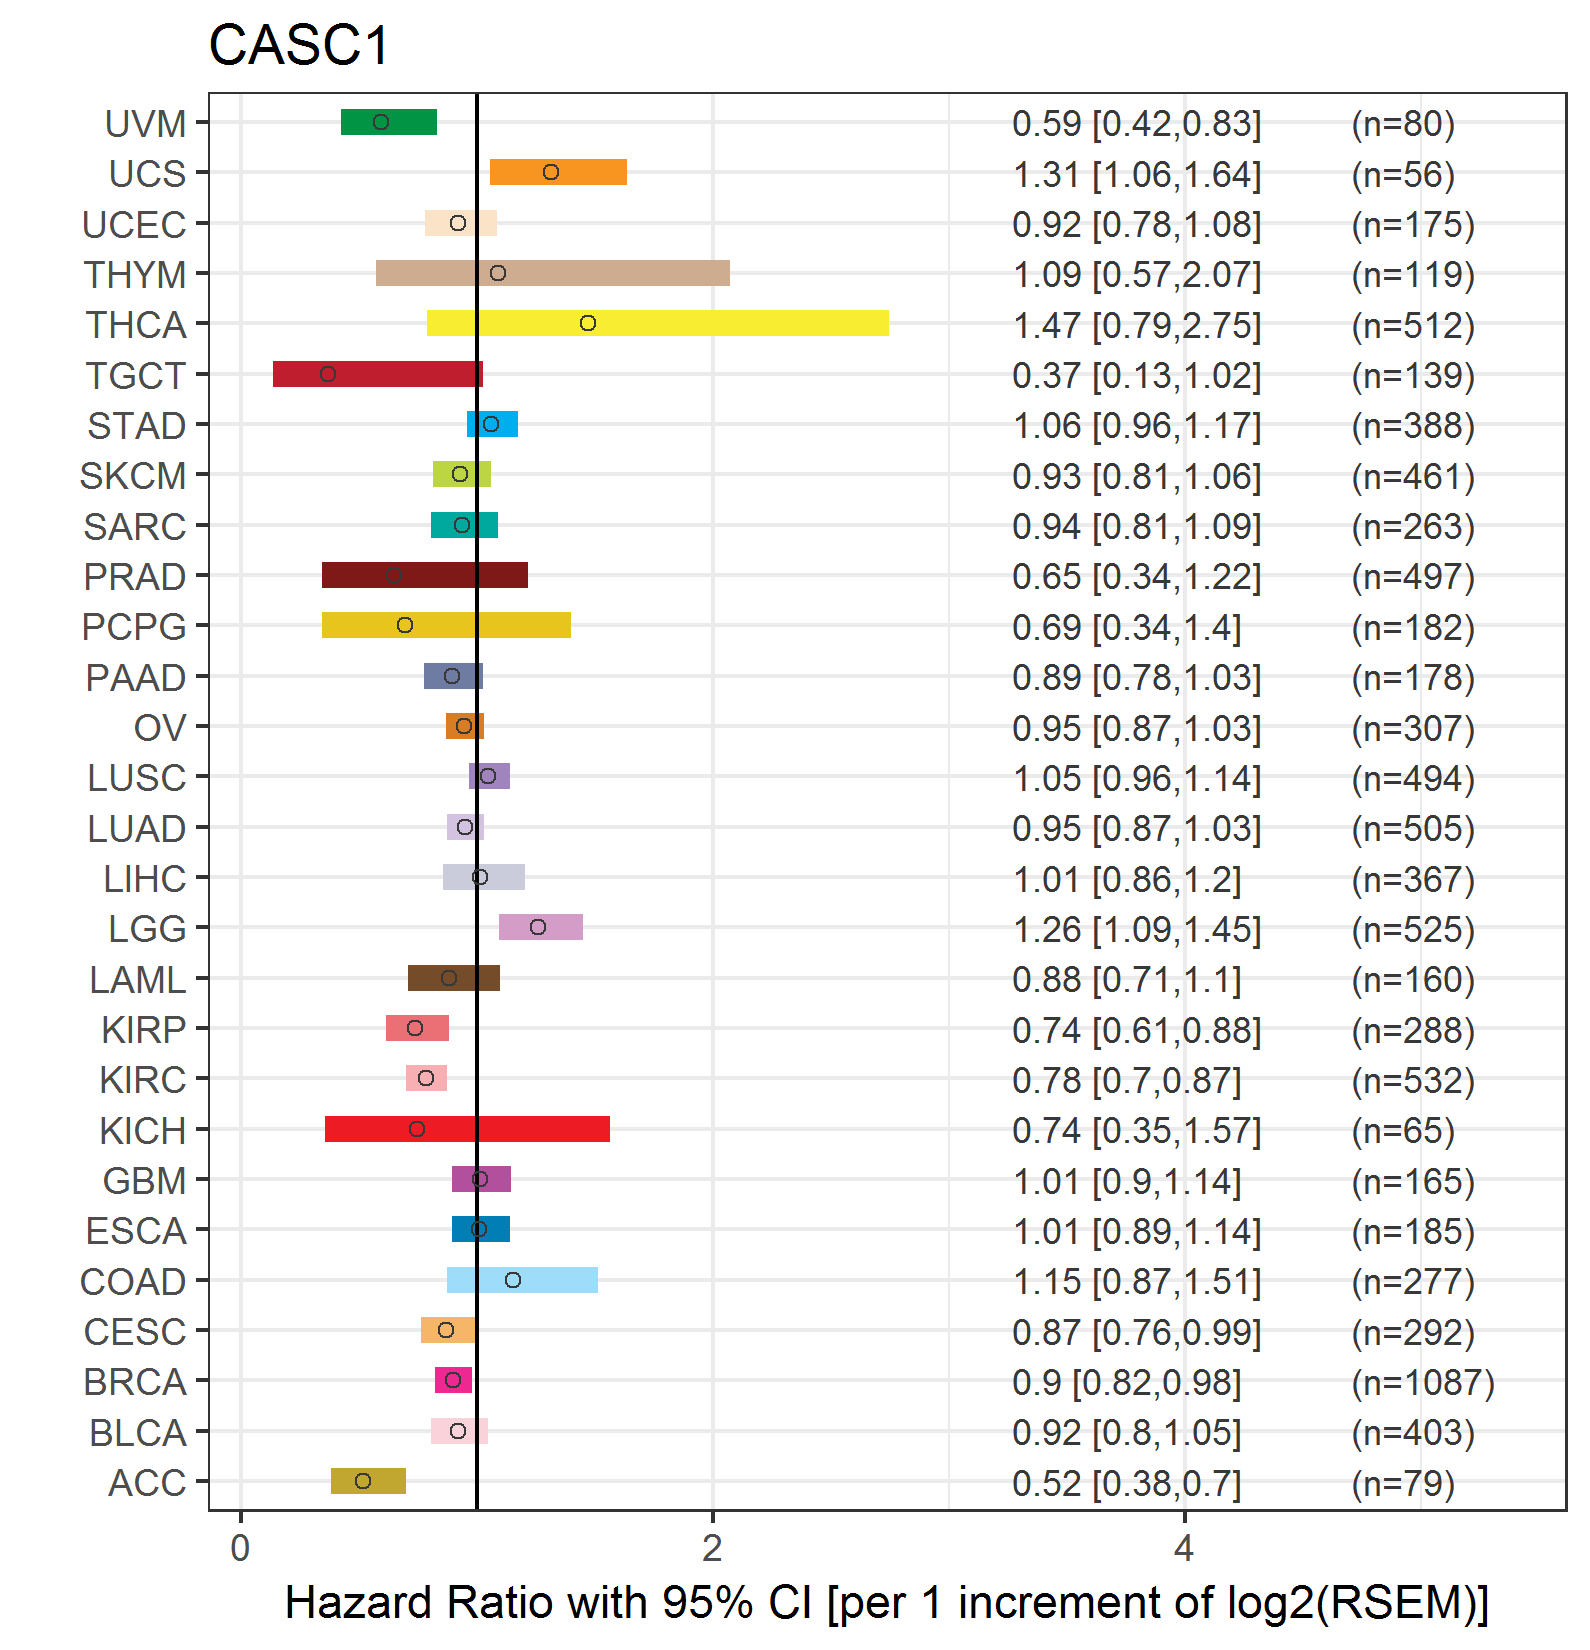
| Forest plot of Cox proportional hazard ratio (HR) and 95% CI of overall survival (OS) using 28 cancer types (TCGA IlluminaHiSeq_RNASeqV2, pan-cancer normalized log2(norm_counts+1) data, version 2016-08-16) (TCGA clinicalMatrix, phenotype data, version 2016-04-27) * Click on the image enlarge it in a new window. |
 |
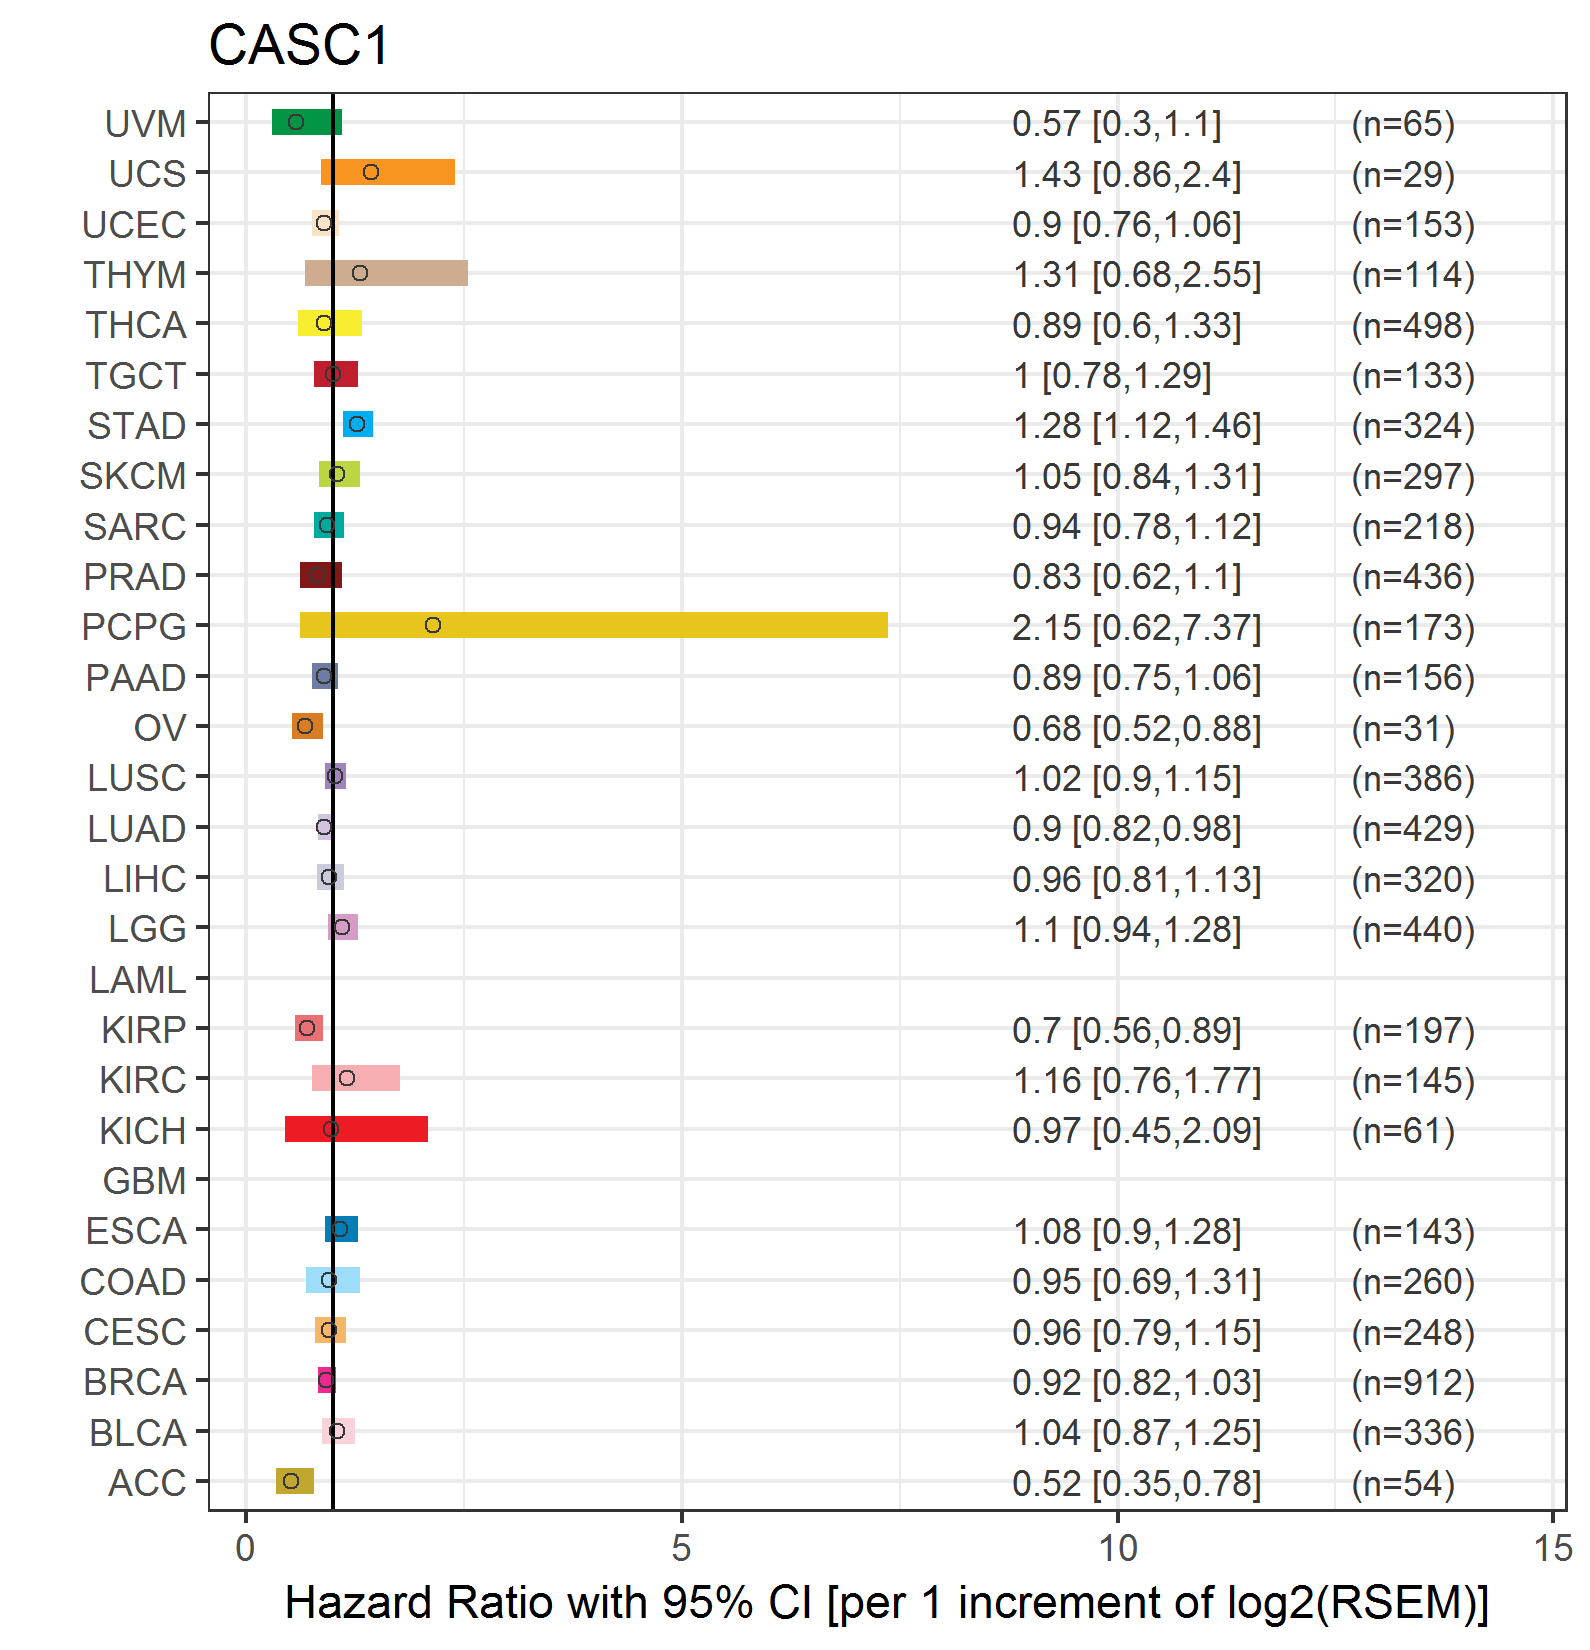
| Forest plot of Cox proportional hazard ratio (HR) and 95% CI of relapse free survival (RFS) using 28 cancer types (TCGA IlluminaHiSeq_RNASeqV2, pan-cancer normalized log2(norm_counts+1) data, version 2016-08-16) (TCGA clinicalMatrix, phenotype data, version 2016-04-27) * Click on the image enlarge it in a new window. |
 |
| Top |
| TissGeneClin for CASC1 |
| TissGeneDrug for CASC1 |
| Drug information targeting TissGene (DrugBank Version 5.0.6, 2017-04-01) |
| DrugBank ID | Drug name | Drug activity | Drug type | Drug status |
| Top |
| TissGeneDisease for CASC1 |
| Disease information associated with TissGene (DisGeNet, 2016-06-01) |
| Disease ID | Disease name | # pubmeds | Source |
| umls:C0024121 | Lung Neoplasms | 6 | BeFree,CTD_human,GAD |
| umls:C0345964 | Adenoma of lung | 4 | BeFree |
| umls:C0242379 | Malignant neoplasm of lung | 2 | BeFree |
| umls:C0684249 | Carcinoma of lung | 2 | BeFree |
| umls:C0001418 | Adenocarcinoma | 1 | GAD |
| umls:C0020507 | Hyperplasia | 1 | GAD |
| umls:C0152013 | Adenocarcinoma of lung (disorder) | 1 | BeFree |
| umls:C0206676 | Adenomatosis, Pulmonary | 1 | GAD |
|
Copyright 2016-Present - The University of Texas Health Science Center at Houston (UTHealth) Web File Viewing | How to Report, Fraud, Waste and Abuse | State of Texas | Statewide Search | Texas Homeland Security | Site Policies |