 |
| |
| |
| |
| |
| |
| |
|

| TissGeneSummary for TMEM100 |
 Gene summary Gene summary |
| Basic gene information | Gene symbol | TMEM100 |
| Gene name | transmembrane protein 100 | |
| Synonyms | - | |
| Cytomap | UCSC genome browser: 17q22 | |
| Type of gene | protein-coding | |
| RefGenes | NM_001099640.1, NM_018286.2, | |
| Description | - | |
| Modification date | 20141207 | |
| dbXrefs | HGNC : HGNC | |
| Ensembl : ENSG00000166292 | ||
| HPRD : 07719 | ||
| Vega : OTTHUMG00000177858 | ||
| Protein | UniProt: go to UniProt's Cross Reference DB Table | |
| Expression | CleanEX: HS_TMEM100 | |
| BioGPS: 55273 | ||
| Pathway | NCI Pathway Interaction Database: TMEM100 | |
| KEGG: TMEM100 | ||
| REACTOME: TMEM100 | ||
| Pathway Commons: TMEM100 | ||
| Context | iHOP: TMEM100 | |
| ligand binding site mutation search in PubMed: TMEM100 | ||
| UCL Cancer Institute: TMEM100 | ||
| Assigned class in TissGDB* | C | |
| Included tissue-specific gene expression resources | ||
| Specific-tissues in normal samples (assigned by TissGDB using HPA, TiGER, and GTEx) | LungOvary | |
| Cancer types related to the specific-tissues in cancer samples (assigned by TissGDB using TCGA) | LUAD,LUSCOV | |
| Reference showing the relevant tissue of TMEM100 | ||
| Description by TissGene annotations | ||
| * Class A consists of genes with literature evidence and is part of the cTissGenes. Class B consists of only cTissGenes without additional evidence. The remaining genes belong to Class C. |
| Gene ontology having evidence of Inferred from Direct Assay (IDA) from Entrez |
| GO ID | GO term | PubMed ID | GO:0030509 | BMP signaling pathway | 22783020 | GO:0071773 | cellular response to BMP stimulus | 22783020 | GO:0030509 | BMP signaling pathway | 22783020 | GO:0071773 | cellular response to BMP stimulus | 22783020 |
| Top |
| TissGeneExp for TMEM100 |
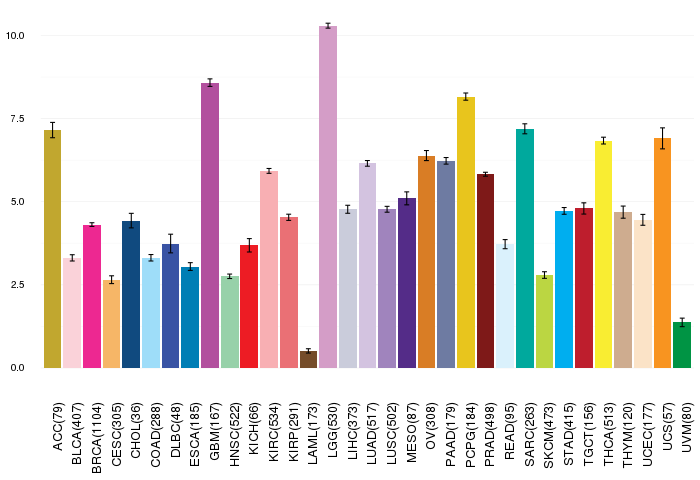
| Gene expressions across 28 cancer types (X-axis: cancer type and Y-axis: log2(norm_counts+1)) (TCGA IlluminaHiSeq_RNASeqV2, pan-cancer normalized log2(norm_counts+1) data, version 2016-08-16) |
 |
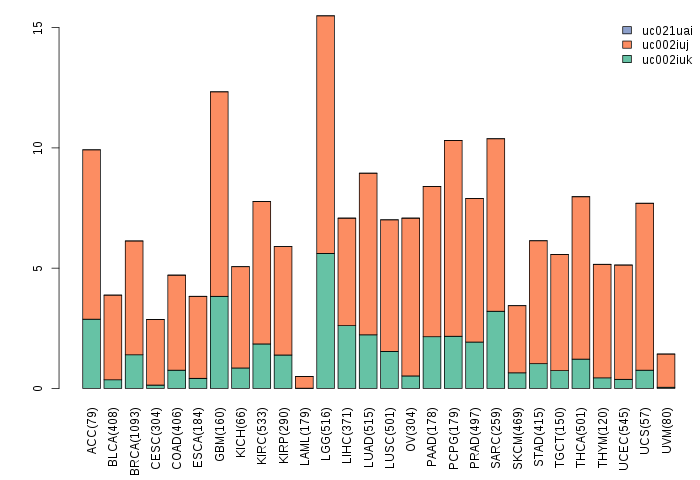
| Gene isoform expressions across 28 cancer types (X-axis: cancer type and Y-axis: log2(norm_counts+1)) (TCGA pan-cancer tcga_rsem_isoform_tpm, version 2016-09-01) |
 |
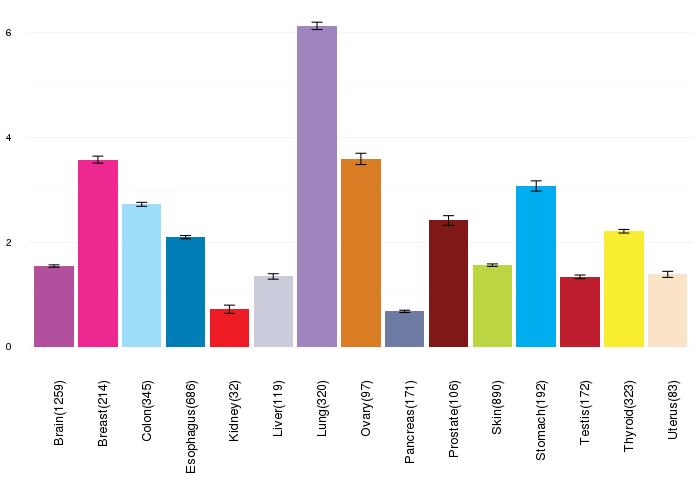
| Gene expressions across normal tissues of GTEx data (GTEx GTEx_Analysis_v6_RNA-seq_RNA-SeQCv1.1.8_gene_rpkm.gct) - Here, we shows the matched tissue types only among our 28 cancer types. |
 |
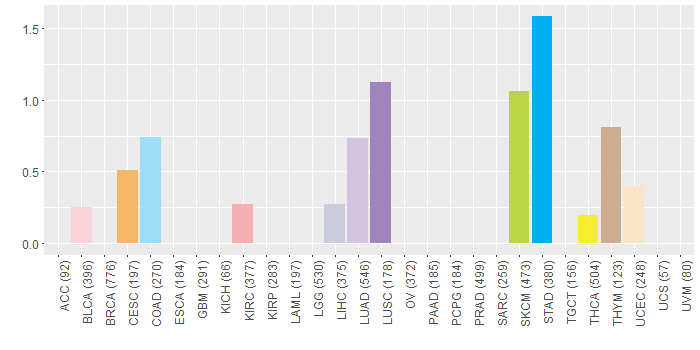
| Different expressions across 14 cancer types with more than 10 samples between matched tumors and normals (X-axis: cancer type and Y-axis: log2(norm_counts+1)) (TCGA IlluminaHiSeq_RNASeqV2, pan-cancer normalized log2(norm_counts+1) data, version 2016-08-16) |
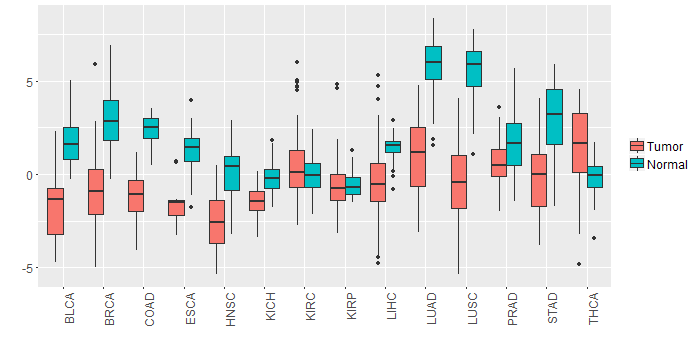 |
| - Significantly differentially expressed cancer types and information. (|Fold change|>1 and FDR<0.05) |
| Cancer type | Mean(exp) in tumor | Mean(exp) in matched normal | Log2FC | P-val. | FDR |
| COAD | -1.171064459 | 2.452170157 | -3.623234615 | 2.16E-14 | 8.60E-13 |
| PRAD | 0.548541311 | 1.906437464 | -1.357896154 | 9.40E-06 | 5.28E-05 |
| THCA | 1.451789387 | -0.151178409 | 1.602967797 | 1.33E-06 | 4.95E-06 |
| LUSC | -0.431816495 | 5.576054093 | -6.007870588 | 1.21E-28 | 4.26E-27 |
| LUAD | 0.992139387 | 5.779722146 | -4.787582759 | 4.43E-26 | 2.26E-24 |
| HNSC | -2.63000131 | 0.125538225 | -2.755539535 | 4.18E-14 | 2.19E-12 |
| BLCA | -1.470494823 | 1.80421044 | -3.274705263 | 5.36E-07 | 2.06E-05 |
| STAD | -0.159166863 | 2.879045637 | -3.0382125 | 5.80E-08 | 1.75E-06 |
| BRCA | -0.852272016 | 2.896072721 | -3.748344737 | 4.25E-43 | 1.65E-41 |
| KICH | -1.412526613 | -0.068846613 | -1.34368 | 4.54E-06 | 1.52E-05 |
| LIHC | -0.497280613 | 1.397505387 | -1.894786 | 2.04E-07 | 1.32E-06 |
| ESCA | -1.495037885 | 1.221834842 | -2.716872727 | 0.000336 | 0.007384544 |
| Top |
| TissGene-miRNA for TMEM100 |
| Significantly anti-correlated miRNAs of TissGene across 28 cancer types (Gene-miRNA relations from TargetScanHuman Relsease 7.1, Conserved_Site_Context_Scores.txt.zip, 06.01.2016) (TCGA IlluminaHiSeq_miRNASeq, log2(RPM+1) data, version 2016-11-21) (TCGA IlluminaHiSeq_RNASeqV2, log2(normalized_count+1) data, version 2016-08-16) (Spearman’s Rank Correlation (p-value<0.05 and coefficient<-0.25)) |
| Cancer type | miRNA id | miRNA accession | P-val. | Coeff. | # samples |
| Top |
| TissGeneMut for TMEM100 |
| TissGeneSNV for TMEM100 |
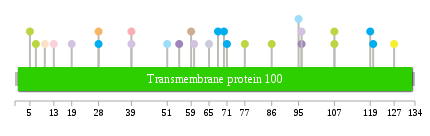
| nsSNV counts per each loci. Different colors of circles represent different cancer types. Circle size denotes number of samples. (TCGA somatic mutation (SNPs and small INDELs) data, version 2016-04-25) * Click on the image to enlarge it in a new window. |
 |
 |
| Somatic nucleotide variants of TissGene across 28 cancer types (X-axis: cancer type and Y-axis: % of mutated samples) The numbers in parentheses are numbers of samples with mutation (nsSNVs). (TCGA somatic mutation (SNPs and small INDELs) data, version 2016-04-25) |
 |
| - nsSNVs sorted by frequency. |
| AAchange | Cancer type | # samples |
| p.E28D | STAD | 1 |
| p.P5L | SKCM | 1 |
| p.L10M | UCEC | 1 |
| p.L51H | COAD | 1 |
| p.A19E | LUAD | 1 |
| p.P13S | BLCA | 1 |
| p.R55L | LUSC | 1 |
| p.W107X | SKCM | 1 |
| p.K7E | SKCM | 1 |
| p.R118I | READ | 1 |
| p.V70M | STAD | 1 |
| p.E39D | LUAD | 1 |
| p.S86F | SKCM | 1 |
| p.S77N | SKCM | 1 |
| p.A127E | THCA | 1 |
| p.G96V | LUSC | 1 |
| p.G96V | LUAD | 1 |
| p.E120D | STAD | 1 |
| p.E39Q | KIRC | 1 |
| p.P59H | THYM | 1 |
| p.R119W | STAD | 1 |
| p.V71A | STAD | 1 |
| p.S95Y | COAD | 1 |
| p.G68S | STAD | 1 |
| p.E28D | CESC | 1 |
| p.F65L | LIHC | 1 |
| p.F60L | LUAD | 1 |
| p.W107* | SKCM | 1 |
| Top |
| TissGeneCNV for TMEM100 |
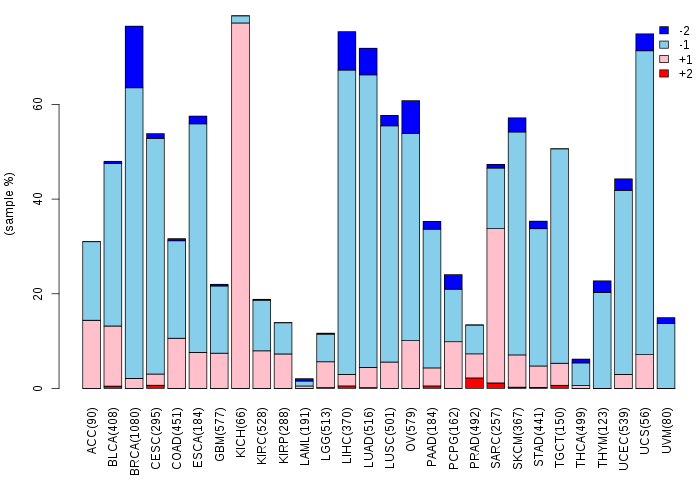
| Copy number variations of TissGene across 28 cancer types (X-axis: cancer type and Y-axis: % of CNV samples) (TCGA Gistic2_CopyNumber_Gistic2_all_data_by_genes, Gistic2 copy number data, version 2016-08-16) |
 |
| Top |
| TissGeneFusions for TMEM100 |
| Fusion genes including TissGene (ChimerDB 3.0, 2016-12-01 and TCGA fusion Portal 2015-12-01) |
| Database | Src | Cancer type | Sample | Fusion gene | ORF | 5'-gene BP | 3'-gene BP |
| Chimerdb3.0 | FusionScan | BRCA | TCGA-AO-A0JG-01A | SKAP1-TMEM100 | CDS-5'UTR | chr17:46423266 | chr17:53805343 |
| TCGAfusionPortal | PRADA | BRCA | TCGA-AO-A0JG-01A | SKAP1-TMEM100 | CDS-5UTR | Chr17:46423267 | Chr17:53800090 |
| Top |
| TissGeneNet for TMEM100 |
| Co-expressed gene networks based on protein-protein interaction data (CePIN) (TCGA IlluminaHiSeq_RNASeqV2, pan-cancer normalized log2(norm_counts+1) data, version 2016-08-16) (PINA2 ppi data) |
| Top |
| TissGeneProg for TMEM100 |
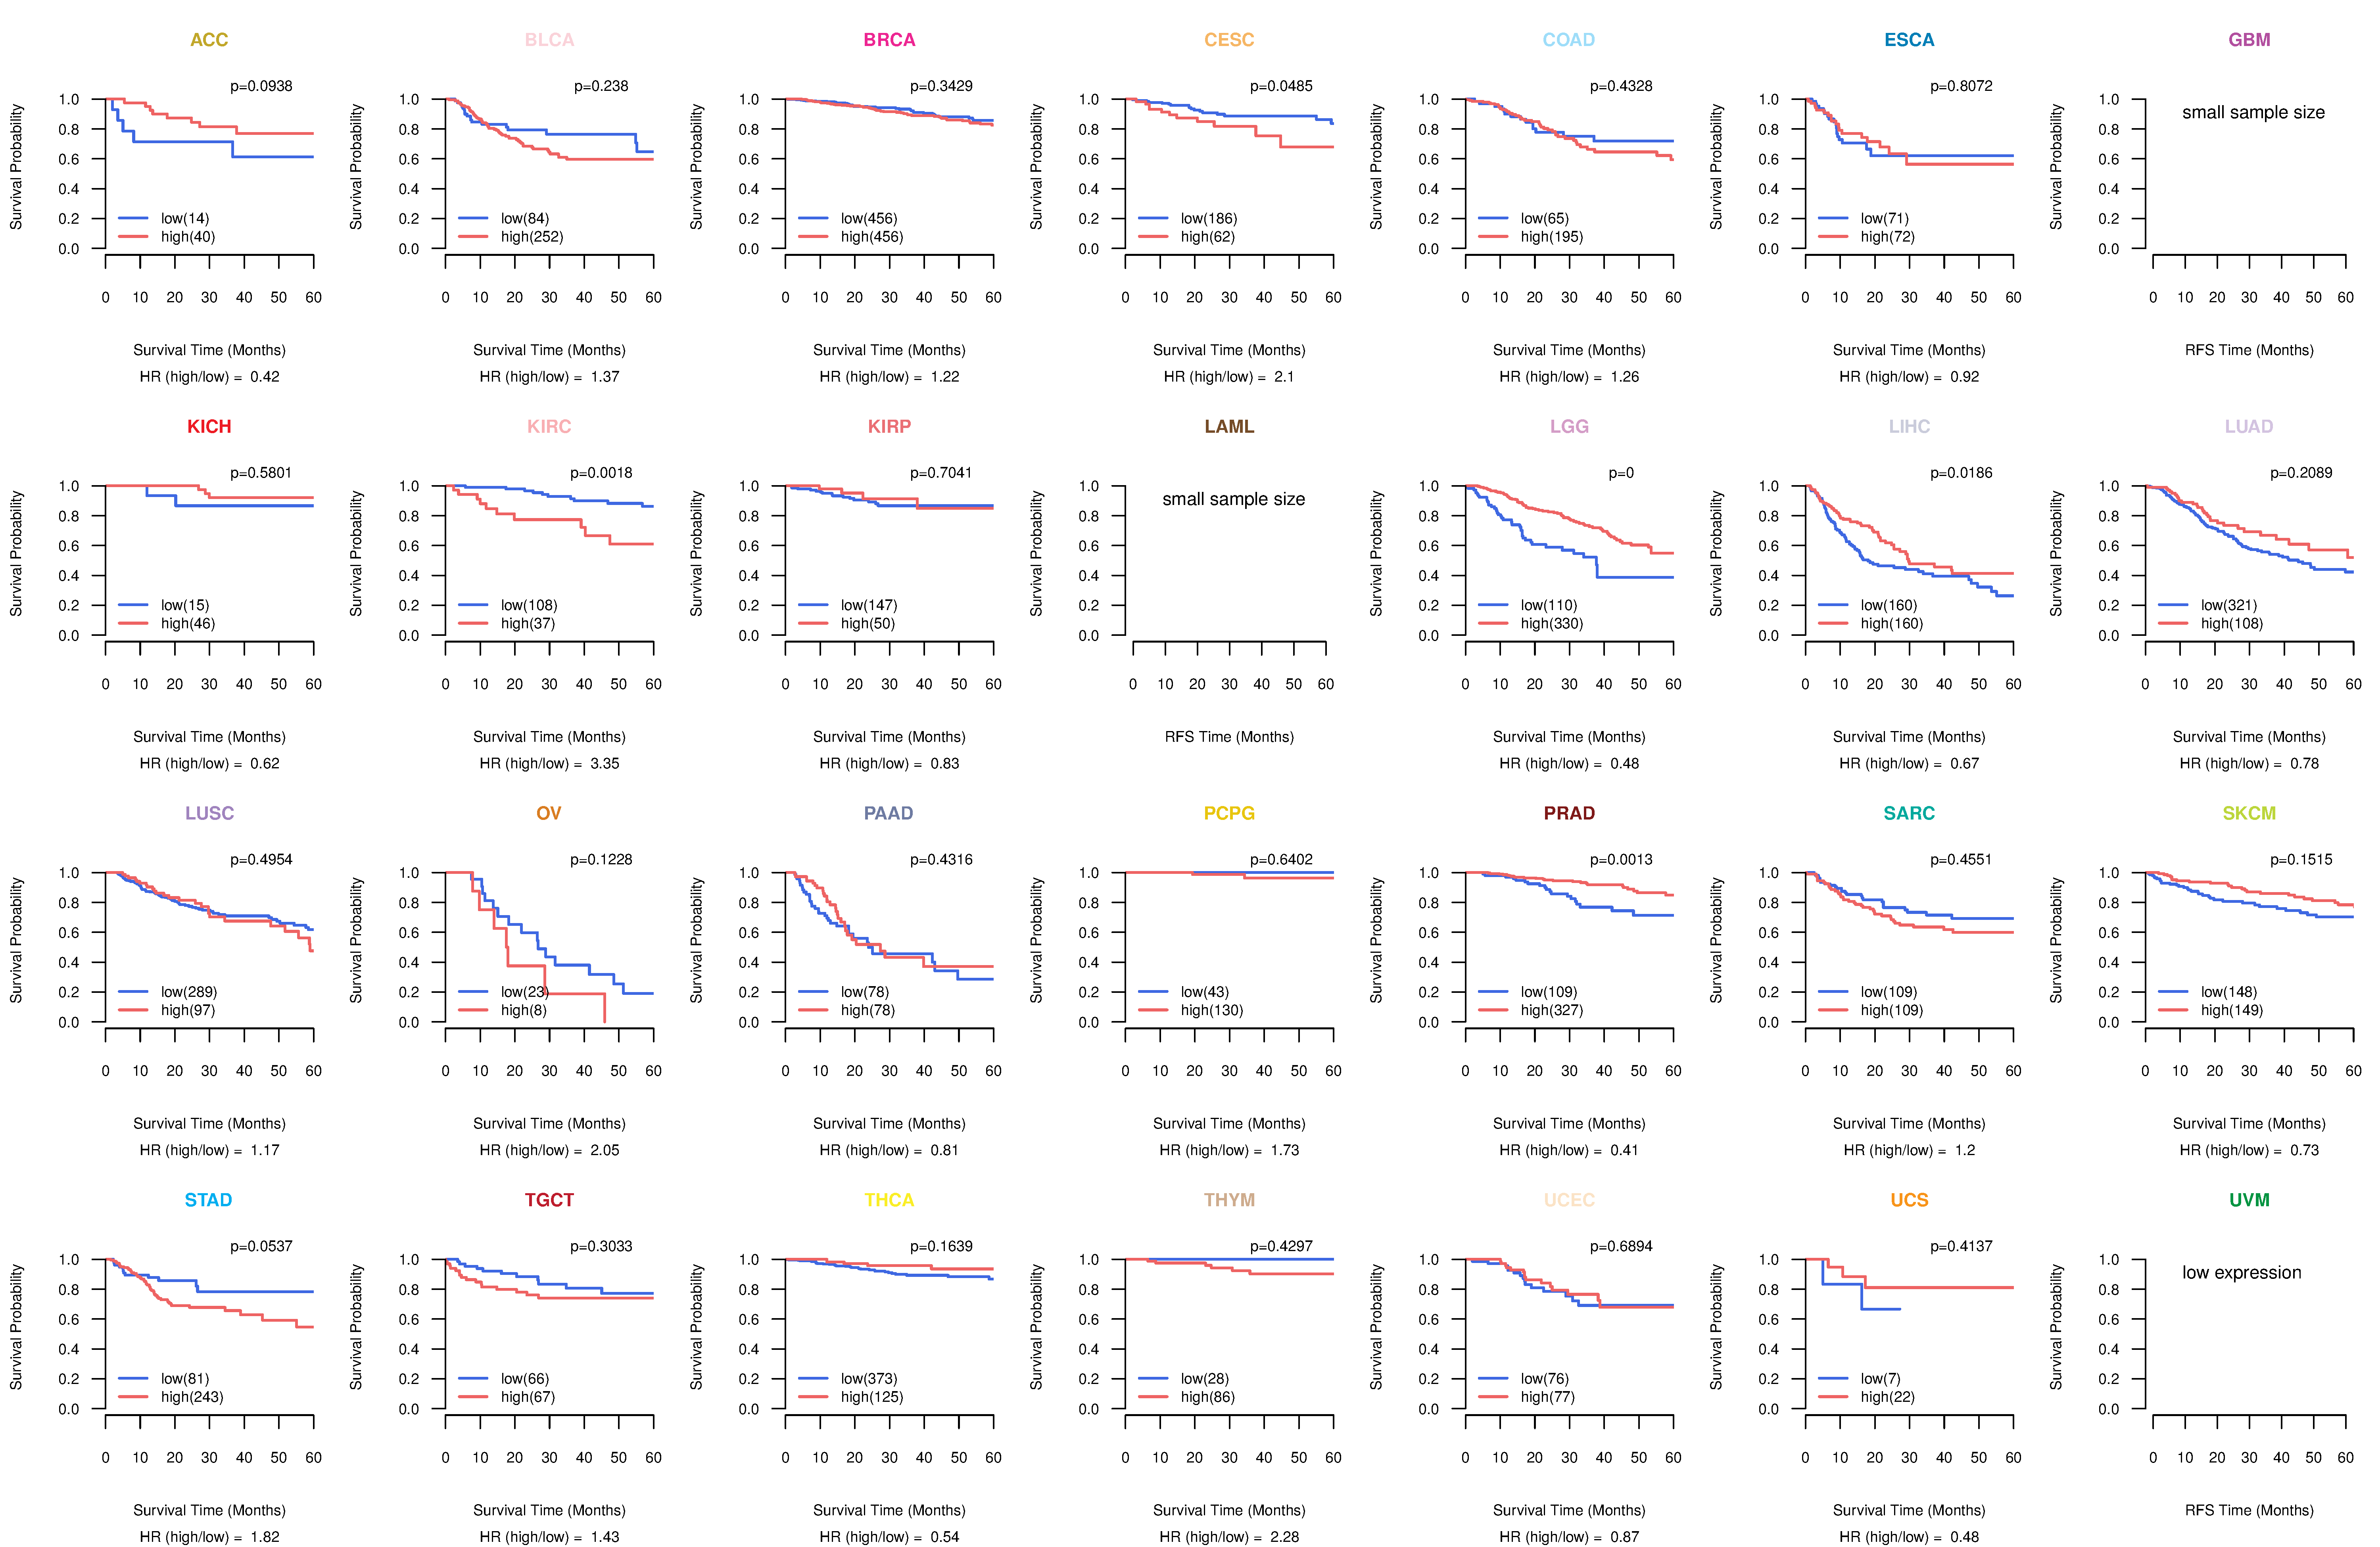
| Kaplan-Meier plots with logrank tests of overall survival (OS) using 28 cancer types (TCGA IlluminaHiSeq_RNASeqV2, pan-cancer normalized log2(norm_counts+1) data, version 2016-08-16) (TCGA clinicalMatrix, phenotype data, version 2016-04-27) * Click on the image to enlarge it in a new window. |
 |
| Kaplan-Meier plots with logrank test of relapse free survival (RFS) using 28 cancer types (TCGA IlluminaHiSeq_RNASeqV2, pan-cancer normalized log2(norm_counts+1) data, version 2016-08-16) (TCGA clinicalMatrix, phenotype data, version 2016-04-27) * Click on the image enlarge it in a new window. |
 |
| Forest plot of Cox proportional hazard ratio (HR) and 95% CI of overall survival (OS) using 28 cancer types (TCGA IlluminaHiSeq_RNASeqV2, pan-cancer normalized log2(norm_counts+1) data, version 2016-08-16) (TCGA clinicalMatrix, phenotype data, version 2016-04-27) * Click on the image enlarge it in a new window. |
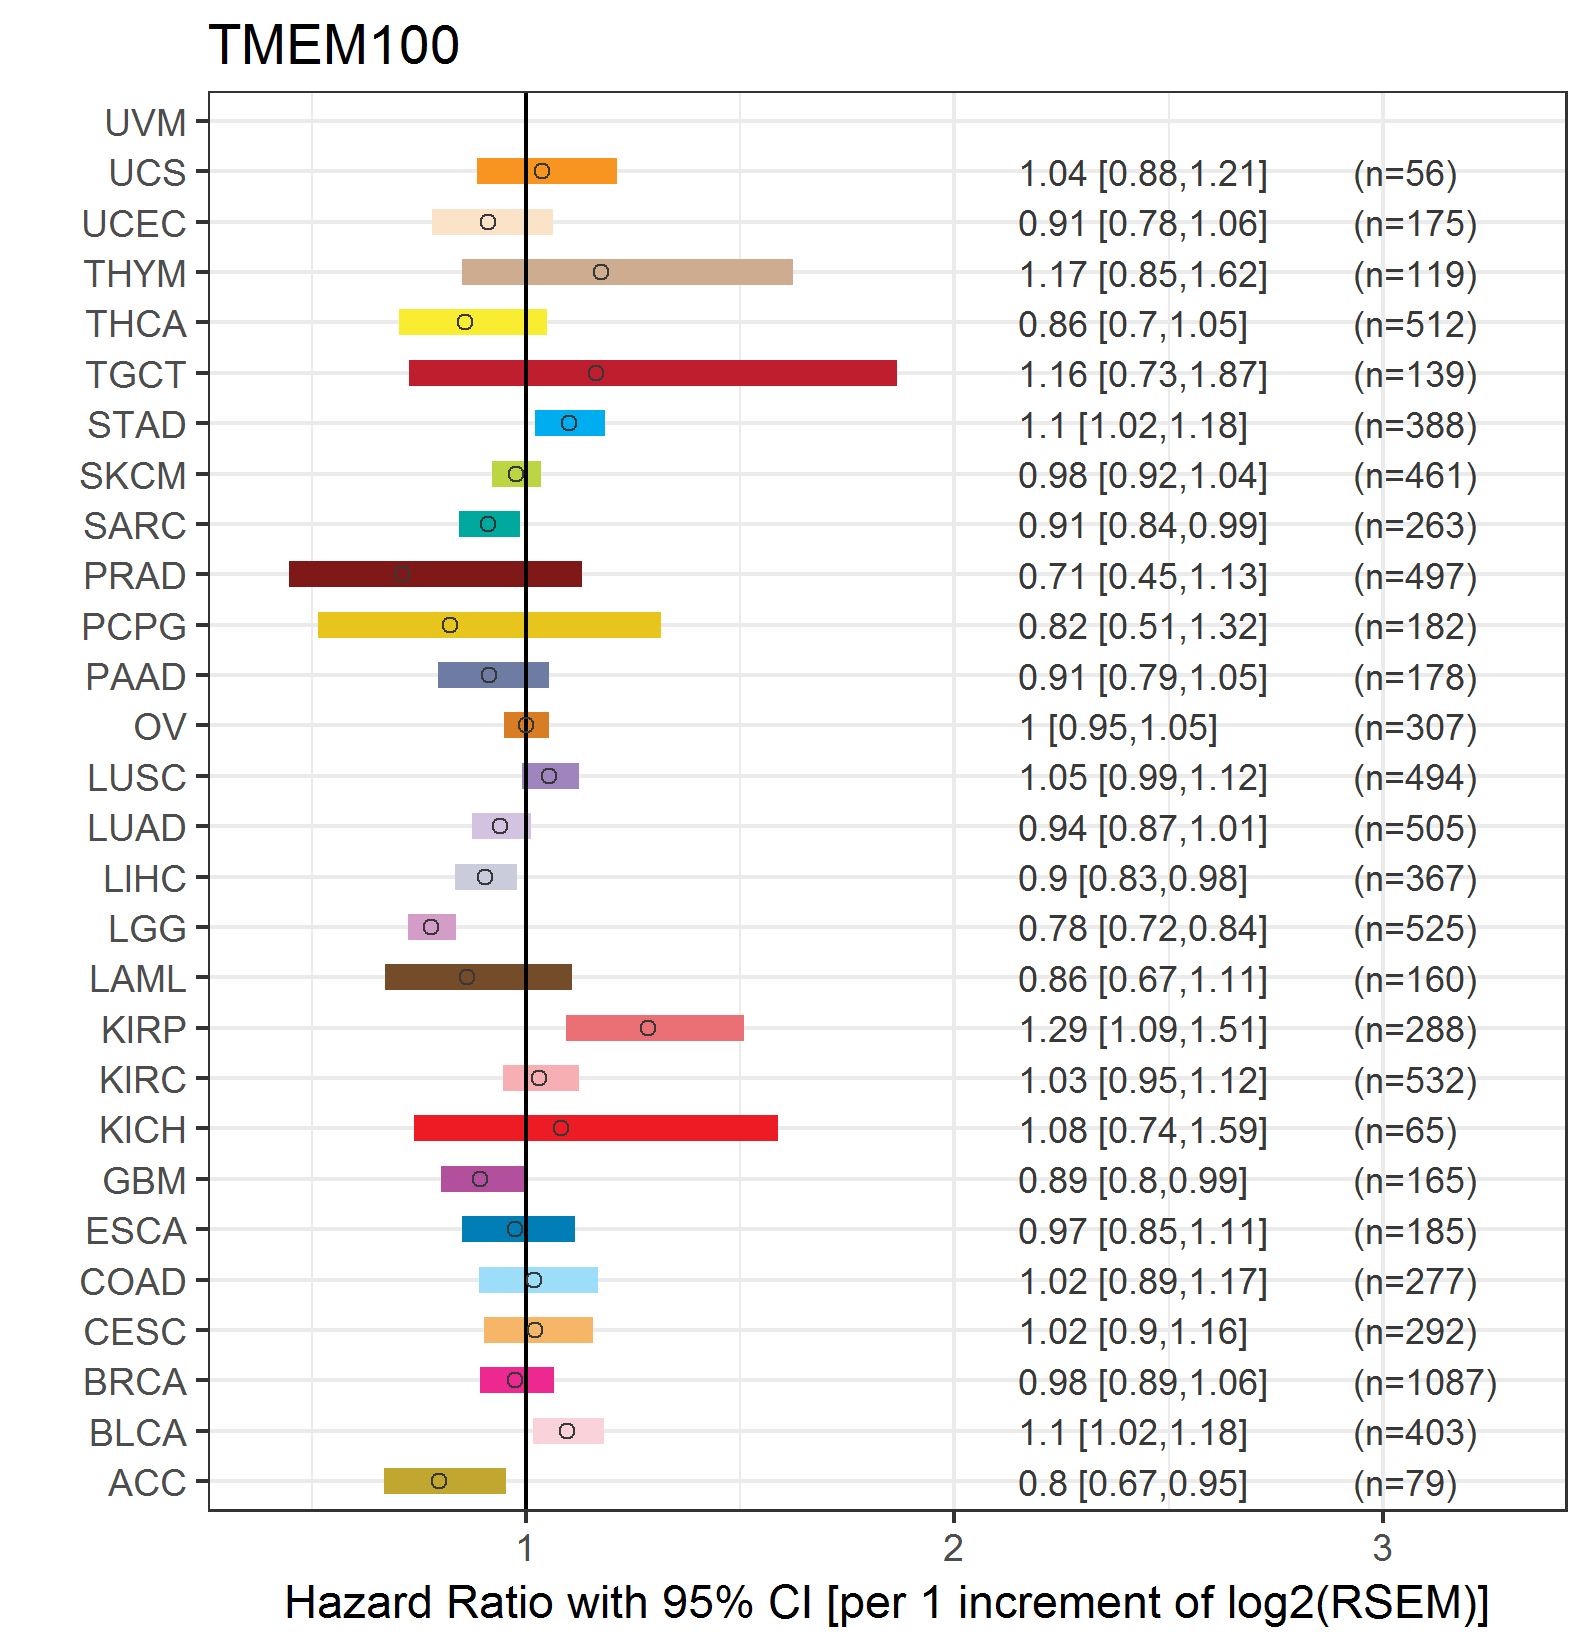 |
| Forest plot of Cox proportional hazard ratio (HR) and 95% CI of relapse free survival (RFS) using 28 cancer types (TCGA IlluminaHiSeq_RNASeqV2, pan-cancer normalized log2(norm_counts+1) data, version 2016-08-16) (TCGA clinicalMatrix, phenotype data, version 2016-04-27) * Click on the image enlarge it in a new window. |
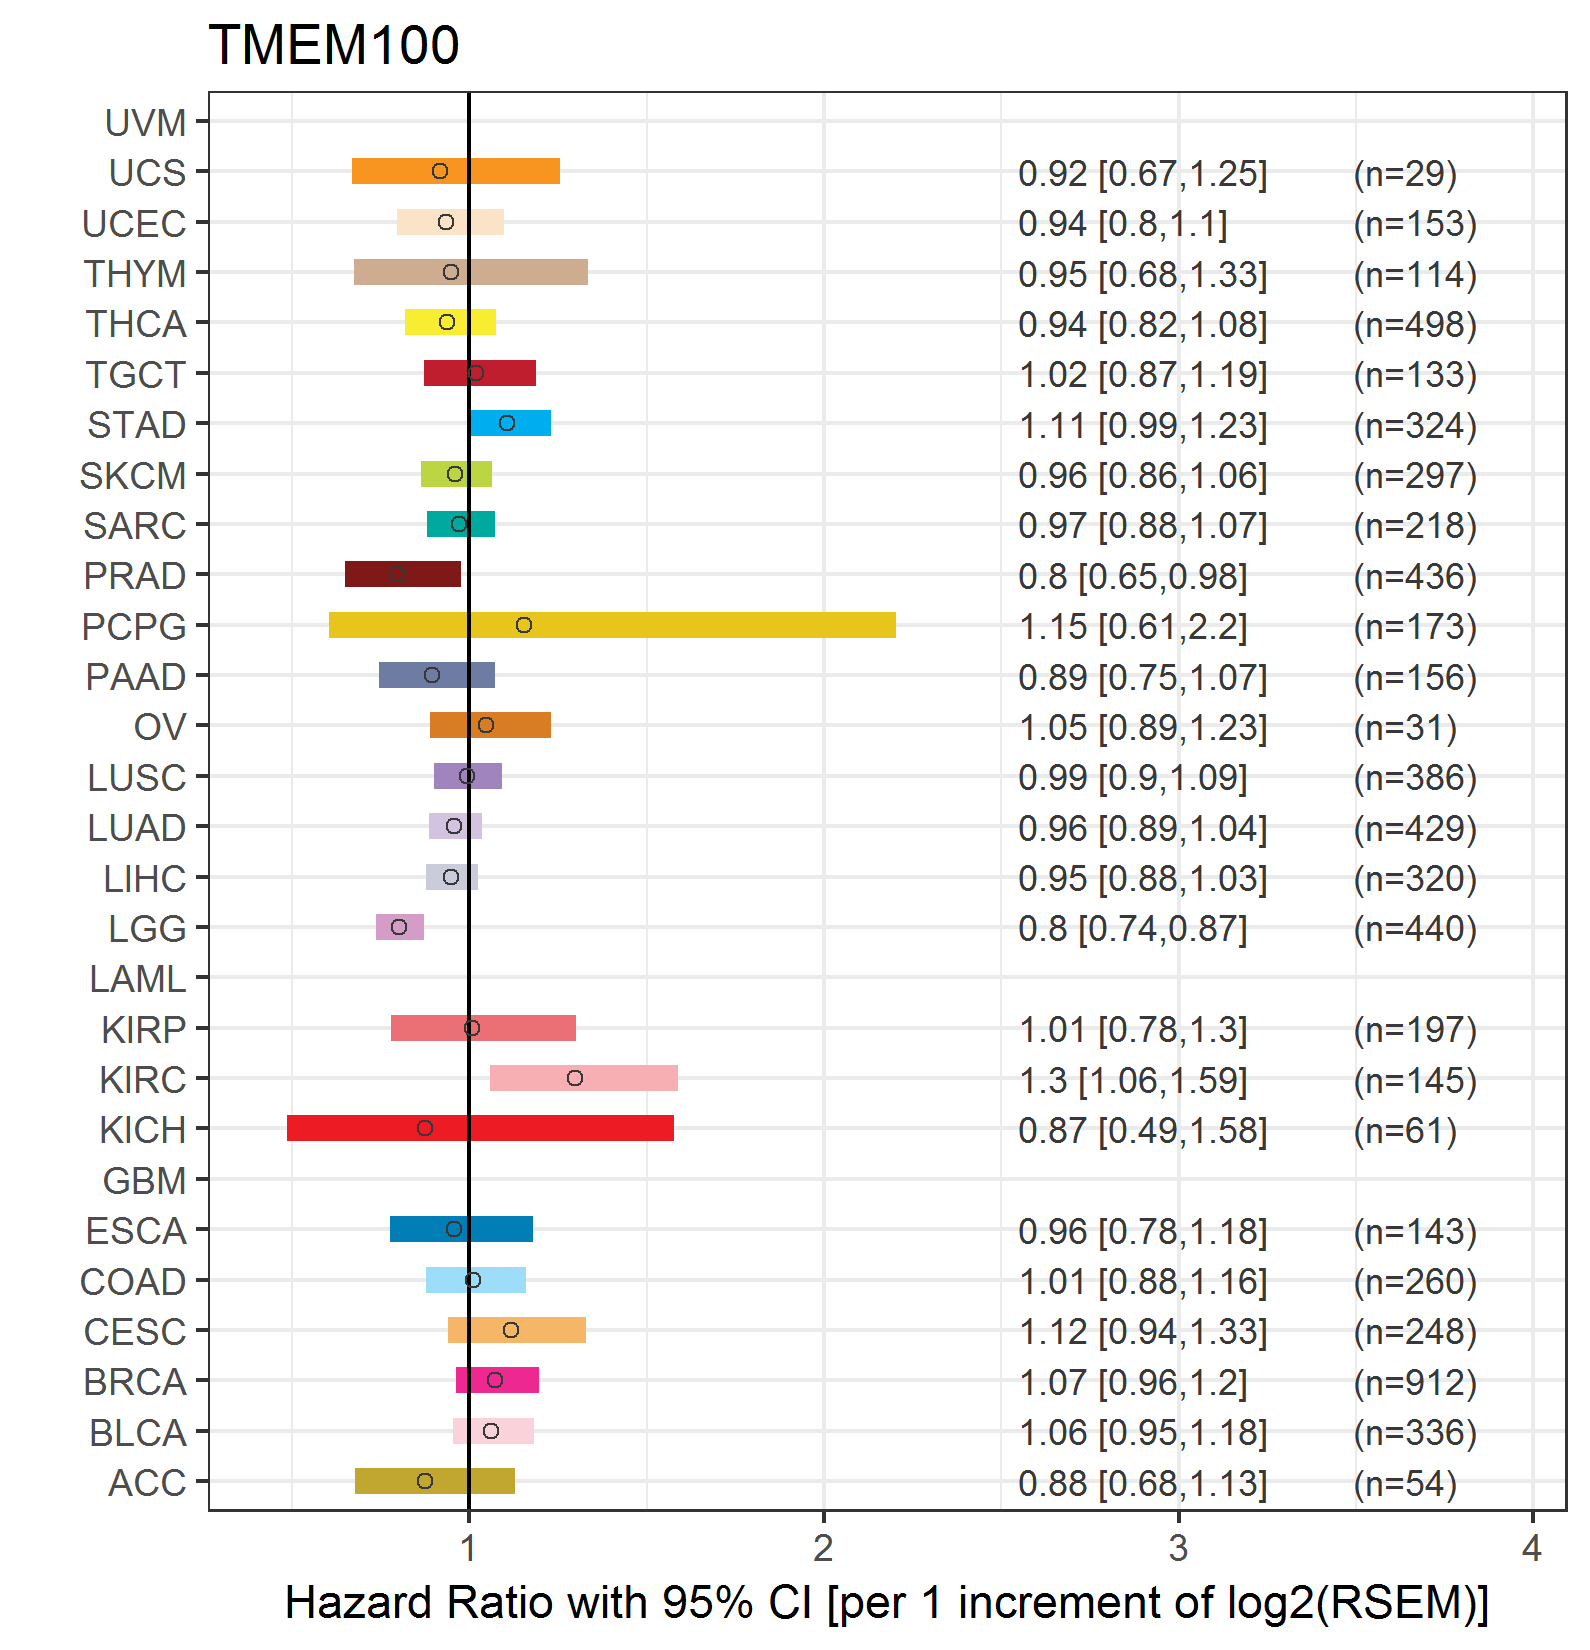 |
| Top |
| TissGeneClin for TMEM100 |
| TissGeneDrug for TMEM100 |
| Drug information targeting TissGene (DrugBank Version 5.0.6, 2017-04-01) |
| DrugBank ID | Drug name | Drug activity | Drug type | Drug status |
| Top |
| TissGeneDisease for TMEM100 |
| Disease information associated with TissGene (DisGeNet, 2016-06-01) |
| Disease ID | Disease name | # pubmeds | Source |
| umls:C0017661 | IGA Glomerulonephritis | 1 | CTD_human |
| umls:C0030193 | Pain | 1 | BeFree |
| umls:C0242379 | Malignant neoplasm of lung | 1 | BeFree |
| umls:C0684249 | Carcinoma of lung | 1 | BeFree |
|
Copyright 2016-Present - The University of Texas Health Science Center at Houston (UTHealth) Web File Viewing | How to Report, Fraud, Waste and Abuse | State of Texas | Statewide Search | Texas Homeland Security | Site Policies |