 |
| |
| |
| |
| |
| |
| |
|

| TissGeneSummary for TRIM36 |
 Gene summary Gene summary |
| Basic gene information | Gene symbol | TRIM36 |
| Gene name | tripartite motif containing 36 | |
| Synonyms | HAPRIN|RBCC728|RNF98 | |
| Cytomap | UCSC genome browser: 5q22.3 | |
| Type of gene | protein-coding | |
| RefGenes | NM_001017397.1, NM_001017398.1,NM_001300752.1,NM_001300759.1,NM_018700.3, | |
| Description | E3 ubiquitin-protein ligase TRIM36RING finger protein 98tripartite motif protein 36tripartite motif-containing 36tripartite motif-containing protein 36zinc-binding protein Rbcc728 | |
| Modification date | 20141207 | |
| dbXrefs | MIM : 609317 | |
| HGNC : HGNC | ||
| Ensembl : ENSG00000152503 | ||
| HPRD : 15554 | ||
| Vega : OTTHUMG00000128892 | ||
| Protein | UniProt: go to UniProt's Cross Reference DB Table | |
| Expression | CleanEX: HS_TRIM36 | |
| BioGPS: 55521 | ||
| Pathway | NCI Pathway Interaction Database: TRIM36 | |
| KEGG: TRIM36 | ||
| REACTOME: TRIM36 | ||
| Pathway Commons: TRIM36 | ||
| Context | iHOP: TRIM36 | |
| ligand binding site mutation search in PubMed: TRIM36 | ||
| UCL Cancer Institute: TRIM36 | ||
| Assigned class in TissGDB* | A | |
| Included tissue-specific gene expression resources | HPA,TiGER,GTEx | |
| Specific-tissues in normal samples (assigned by TissGDB using HPA, TiGER, and GTEx) | Testis | |
| Cancer types related to the specific-tissues in cancer samples (assigned by TissGDB using TCGA) | TGCT | |
| Reference showing the relevant tissue of TRIM36 | Haprin, a novel haploid germ cell-specific RING finger protein involved in the acrosome reaction.J Biol Chem. 2003 Nov 7;278(45):44417-23. Epub 2003 Aug 13. (pmid:12917430) go to article | |
| Description by TissGene annotations | Fused withOncogene | |
| * Class A consists of genes with literature evidence and is part of the cTissGenes. Class B consists of only cTissGenes without additional evidence. The remaining genes belong to Class C. |
| Gene ontology having evidence of Inferred from Direct Assay (IDA) from Entrez |
| GO ID | GO term | PubMed ID |
| Top |
| TissGeneExp for TRIM36 |
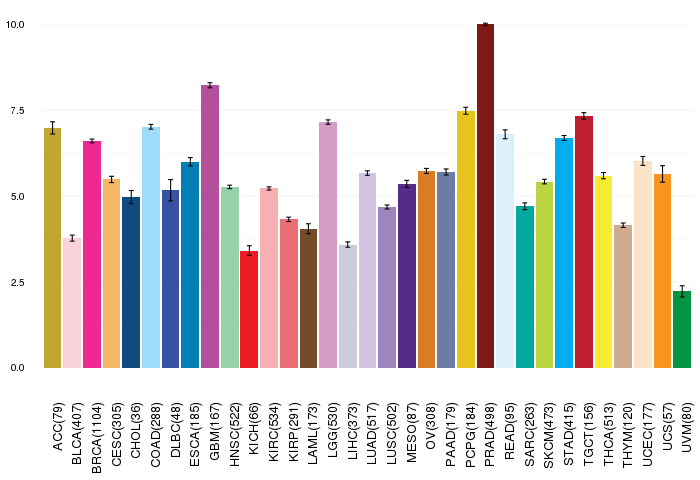
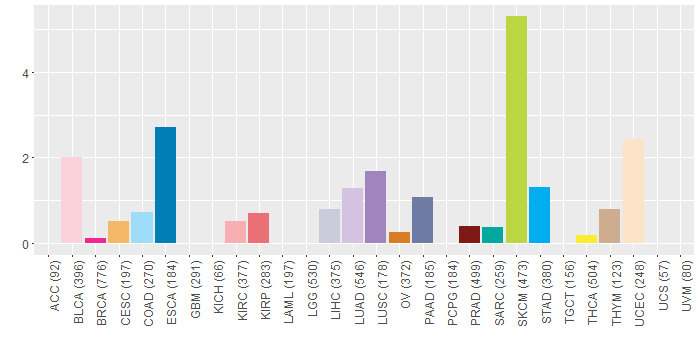
| Gene expressions across 28 cancer types (X-axis: cancer type and Y-axis: log2(norm_counts+1)) (TCGA IlluminaHiSeq_RNASeqV2, pan-cancer normalized log2(norm_counts+1) data, version 2016-08-16) |
 |
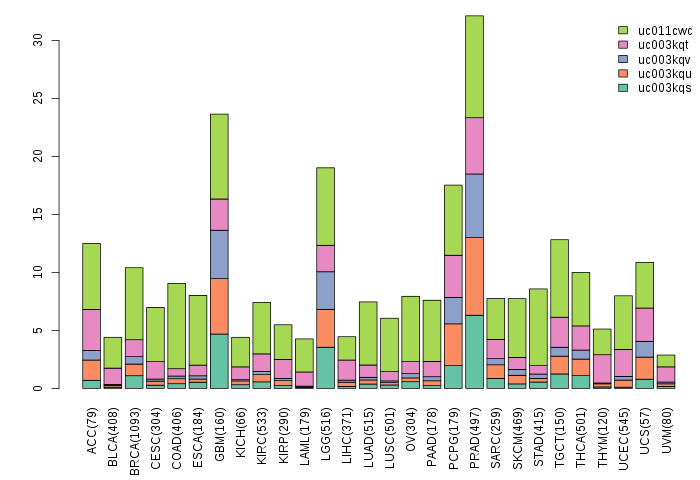
| Gene isoform expressions across 28 cancer types (X-axis: cancer type and Y-axis: log2(norm_counts+1)) (TCGA pan-cancer tcga_rsem_isoform_tpm, version 2016-09-01) |
 |
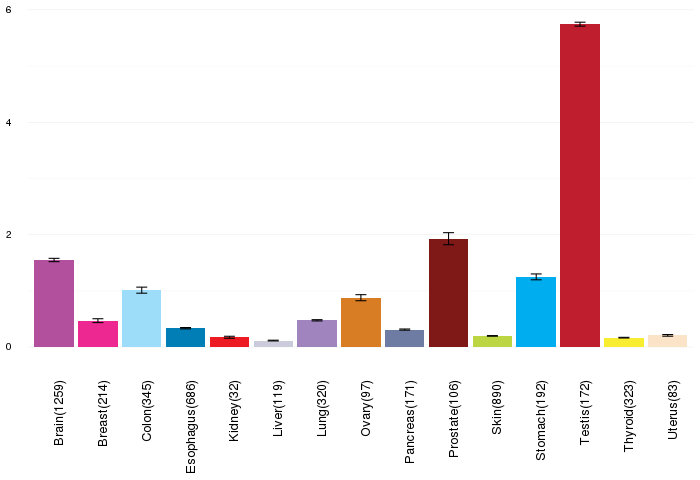
| Gene expressions across normal tissues of GTEx data (GTEx GTEx_Analysis_v6_RNA-seq_RNA-SeQCv1.1.8_gene_rpkm.gct) - Here, we shows the matched tissue types only among our 28 cancer types. |
 |
| Different expressions across 14 cancer types with more than 10 samples between matched tumors and normals (X-axis: cancer type and Y-axis: log2(norm_counts+1)) (TCGA IlluminaHiSeq_RNASeqV2, pan-cancer normalized log2(norm_counts+1) data, version 2016-08-16) |
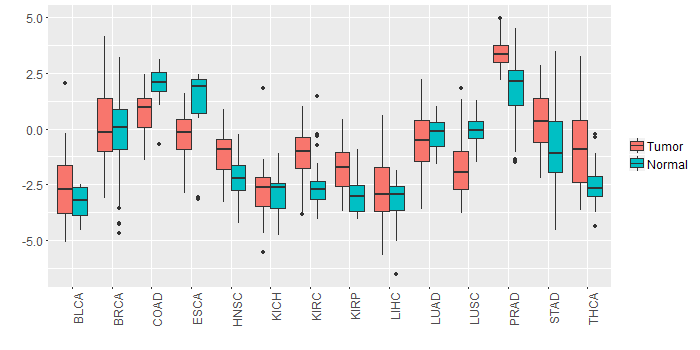 |
| - Significantly differentially expressed cancer types and information. (|Fold change|>1 and FDR<0.05) |
| Cancer type | Mean(exp) in tumor | Mean(exp) in matched normal | Log2FC | P-val. | FDR |
| KIRP | -1.634877796 | -2.972268421 | 1.337390625 | 1.82E-06 | 8.72E-06 |
| THCA | -0.79754591 | -2.51896286 | 1.721416949 | 1.27E-08 | 6.25E-08 |
| KIRC | -1.126575713 | -2.627021546 | 1.500445833 | 7.65E-16 | 4.09E-15 |
| HNSC | -1.121922418 | -2.191780558 | 1.06985814 | 3.77E-06 | 2.43E-05 |
| LUSC | -1.815196791 | -0.022514438 | -1.792682353 | 4.04E-13 | 1.95E-12 |
| PRAD | 3.4390948 | 1.649779415 | 1.789315385 | 4.46E-12 | 1.72E-10 |
| COAD | 0.633362108 | 2.027531339 | -1.394169231 | 3.03E-06 | 1.54E-05 |
| Top |
| TissGene-miRNA for TRIM36 |
| Significantly anti-correlated miRNAs of TissGene across 28 cancer types (Gene-miRNA relations from TargetScanHuman Relsease 7.1, Conserved_Site_Context_Scores.txt.zip, 06.01.2016) (TCGA IlluminaHiSeq_miRNASeq, log2(RPM+1) data, version 2016-11-21) (TCGA IlluminaHiSeq_RNASeqV2, log2(normalized_count+1) data, version 2016-08-16) (Spearman’s Rank Correlation (p-value<0.05 and coefficient<-0.25)) |
| Cancer type | miRNA id | miRNA accession | P-val. | Coeff. | # samples |
| Top |
| TissGeneMut for TRIM36 |
| TissGeneSNV for TRIM36 |
| nsSNV counts per each loci. Different colors of circles represent different cancer types. Circle size denotes number of samples. (TCGA somatic mutation (SNPs and small INDELs) data, version 2016-04-25) * Click on the image to enlarge it in a new window. |
 |
 |
| Somatic nucleotide variants of TissGene across 28 cancer types (X-axis: cancer type and Y-axis: % of mutated samples) The numbers in parentheses are numbers of samples with mutation (nsSNVs). (TCGA somatic mutation (SNPs and small INDELs) data, version 2016-04-25) |
 |
| - nsSNVs sorted by frequency. |
| AAchange | Cancer type | # samples |
| p.S61L | SKCM | 2 |
| p.D54Y | PAAD | 1 |
| p.V596I | PRAD | 1 |
| p.E479K | SKCM | 1 |
| p.Y680H | LIHC | 1 |
| p.A366T | BLCA | 1 |
| p.K461E | BLCA | 1 |
| p.G707D | COAD | 1 |
| p.R84W | SKCM | 1 |
| p.L688I | UCEC | 1 |
| p.P632A | READ | 1 |
| p.F563V | LUAD | 1 |
| p.Q712* | CESC | 1 |
| p.E368* | STAD | 1 |
| p.R82G | HNSC | 1 |
| p.I495M | HNSC | 1 |
| p.S399F | SKCM | 1 |
| p.G116R | SKCM | 1 |
| p.D549N | LUAD | 1 |
| p.G5E | SKCM | 1 |
| p.E380X | STAD | 1 |
| p.E502* | UCEC | 1 |
| p.F303I | SKCM | 1 |
| p.E166* | UCEC | 1 |
| p.T392A | HNSC | 1 |
| p.M728V | LUSC | 1 |
| p.N653D | SKCM | 1 |
| p.L27M | HNSC | 1 |
| p.E467K | SKCM | 1 |
| p.L318F | BLCA | 1 |
| p.V608I | PRAD | 1 |
| p.E38X | COAD | 1 |
| p.P499S | SKCM | 1 |
| p.R134C | SKCM | 1 |
| p.R95Q | UCEC | 1 |
| p.F575V | LUAD | 1 |
| p.P102S | SKCM | 1 |
| p.E601K | BLCA | 1 |
| p.A240S | LUAD | 1 |
| p.E569K | SKCM | 1 |
| p.T637S | KIRP | 1 |
| p.R35Q | KIRC | 1 |
| p.R72W | SKCM | 1 |
| p.D123Y | PAAD | 1 |
| p.G707S | HNSC | 1 |
| p.K43* | KIRC | 1 |
| p.L306F | BLCA | 1 |
| p.S315* | UCEC | 1 |
| p.Q631K | ESCA | 1 |
| p.R72Q | LUAD | 1 |
| p.T38M | LIHC | 1 |
| p.A320T | STAD | 1 |
| p.R134Q | BRCA | 1 |
| p.E299K | SKCM | 1 |
| p.R567C | SKCM | 1 |
| p.V419A | KIRP | 1 |
| p.F563Y | SKCM | 1 |
| p.V407A | KIRP | 1 |
| p.R134Q | SKCM | 1 |
| p.M25T | SKCM | 1 |
| p.P150S | SKCM | 1 |
| p.K92N | UCEC | 1 |
| p.I483M | HNSC | 1 |
| p.C521Y | PRAD | 1 |
| p.V274M | ESCA | 1 |
| p.R127Q | SKCM | 1 |
| p.S447G | READ | 1 |
| p.R115Q | SKCM | 1 |
| p.E448Q | BLCA | 1 |
| p.R146C | SKCM | 1 |
| p.D465Y | LUAD | 1 |
| p.A44V | HNSC | 1 |
| p.R70Q | BLCA | 1 |
| p.S500N | STAD | 1 |
| p.D24G | CHOL | 1 |
| p.A42T | PAAD | 1 |
| p.R524C | SKCM | 1 |
| p.E714G | SKCM | 1 |
| p.S316Y | ESCA | 1 |
| p.G11D | PAAD | 1 |
| p.S411F | SKCM | 1 |
| p.E368G | LUAD | 1 |
| p.D158G | UCEC | 1 |
| p.P162S | SKCM | 1 |
| p.S73L | SKCM | 1 |
| p.F385L | HNSC | 1 |
| p.F10L | SKCM | 1 |
| p.F291I | SKCM | 1 |
| p.G72R | LUAD | 1 |
| p.A252S | LUAD | 1 |
| p.R70* | HNSC | 1 |
| p.R524H | STAD | 1 |
| p.L267I | ESCA | 1 |
| p.R122Q | SKCM | 1 |
| p.R536H | STAD | 1 |
| p.V419M | READ | 1 |
| p.R70G | HNSC | 1 |
| p.R82Q | BLCA | 1 |
| p.V429I | OV | 1 |
| p.N641D | SKCM | 1 |
| p.E453Q | BLCA | 1 |
| p.E581K | SKCM | 1 |
| p.C509Y | PRAD | 1 |
| p.R602C | UCEC | 1 |
| p.V429F | LUSC | 1 |
| p.R84W | ESCA | 1 |
| p.P47S | LUSC | 1 |
| p.K55X | KIRC | 1 |
| p.F101Y | SKCM | 1 |
| p.Q619K | ESCA | 1 |
| p.G695S | HNSC | 1 |
| p.K647N | PAAD | 1 |
| p.P689S | SKCM | 1 |
| p.L648I | BLCA | 1 |
| p.G458V | STAD | 1 |
| p.I13L | HNSC | 1 |
| p.E465Q | BLCA | 1 |
| p.P189Q | THCA | 1 |
| p.R567C | SARC | 1 |
| p.N221H | STAD | 1 |
| p.F373L | HNSC | 1 |
| p.P114S | SKCM | 1 |
| p.G60R | LUAD | 1 |
| p.M78I | SKCM | 1 |
| p.E702G | SKCM | 1 |
| p.D111Y | PAAD | 1 |
| p.E311K | SKCM | 1 |
| p.D66Y | PAAD | 1 |
| p.R536C | SKCM | 1 |
| p.K635N | PAAD | 1 |
| p.W463* | UCEC | 1 |
| p.D46E | LIHC | 1 |
| p.A378V | THYM | 1 |
| Top |
| TissGeneCNV for TRIM36 |
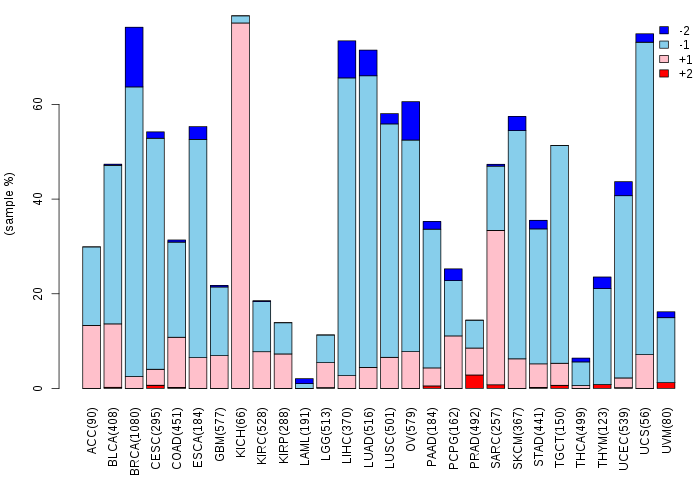
| Copy number variations of TissGene across 28 cancer types (X-axis: cancer type and Y-axis: % of CNV samples) (TCGA Gistic2_CopyNumber_Gistic2_all_data_by_genes, Gistic2 copy number data, version 2016-08-16) |
 |
| Top |
| TissGeneFusions for TRIM36 |
| Fusion genes including TissGene (ChimerDB 3.0, 2016-12-01 and TCGA fusion Portal 2015-12-01) |
| Database | Src | Cancer type | Sample | Fusion gene | ORF | 5'-gene BP | 3'-gene BP |
| TCGAfusionPortal | PRADA | BRCA | TCGA-AO-A0J3-01A | TRIM36-HEXB | Out-of-frame | Chr5:114505305 | Chr5:73985153 |
| Top |
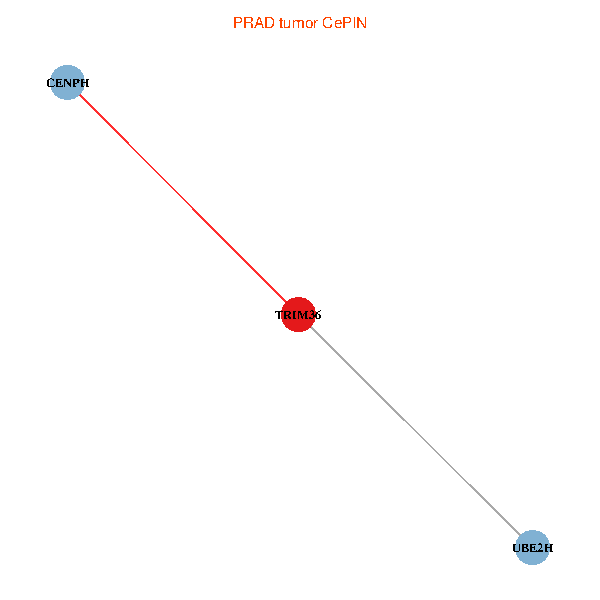
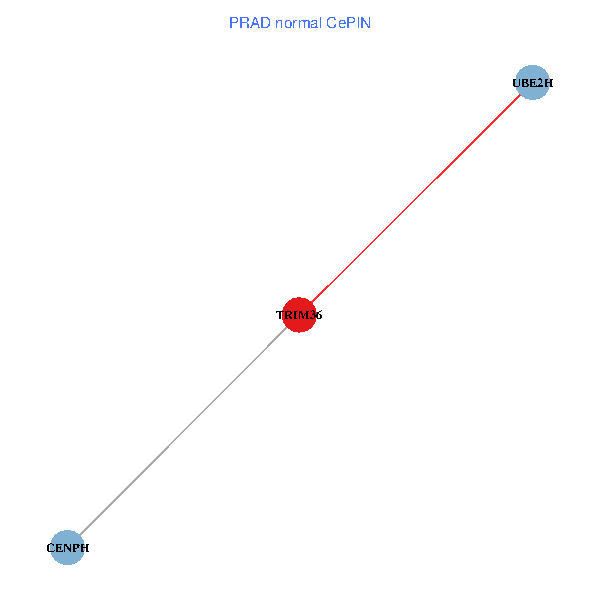
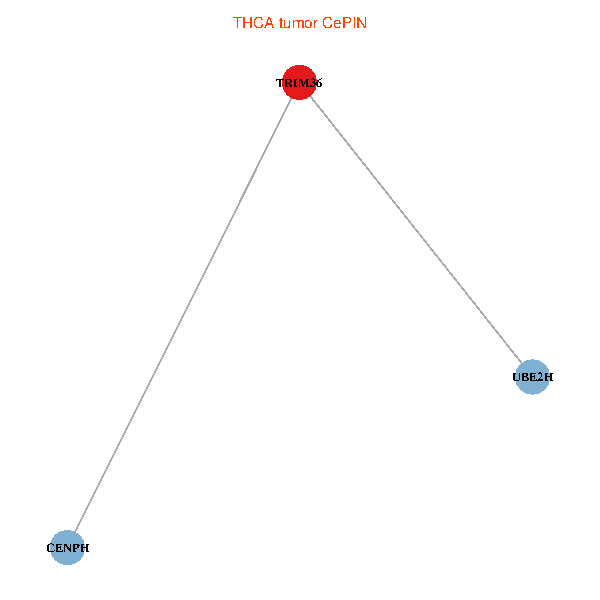
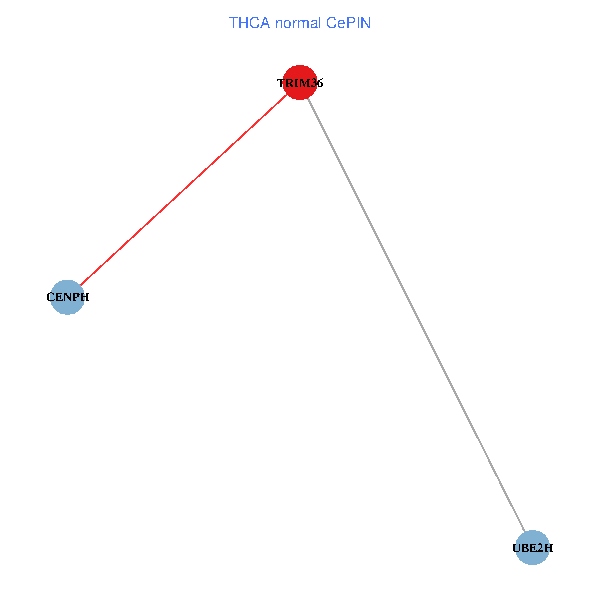
| TissGeneNet for TRIM36 |
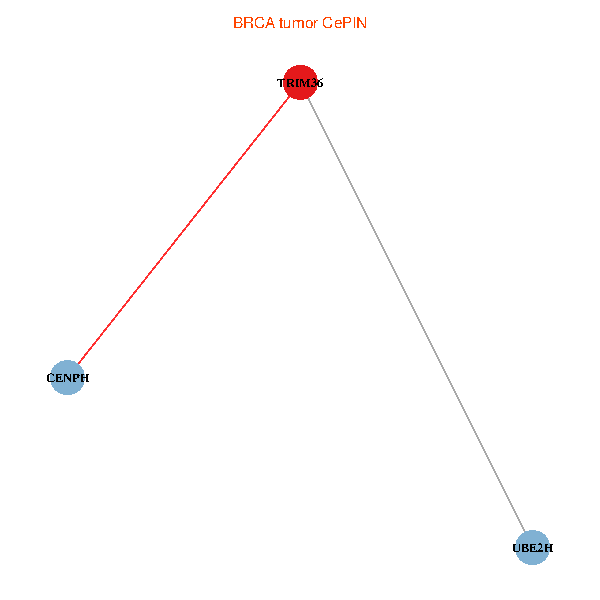
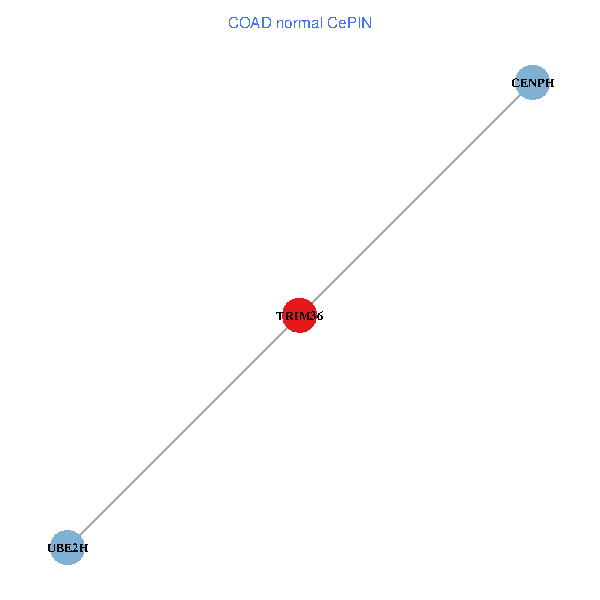
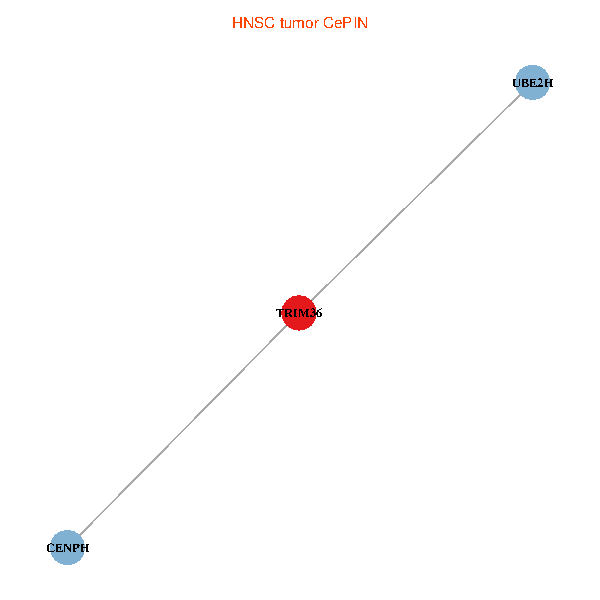
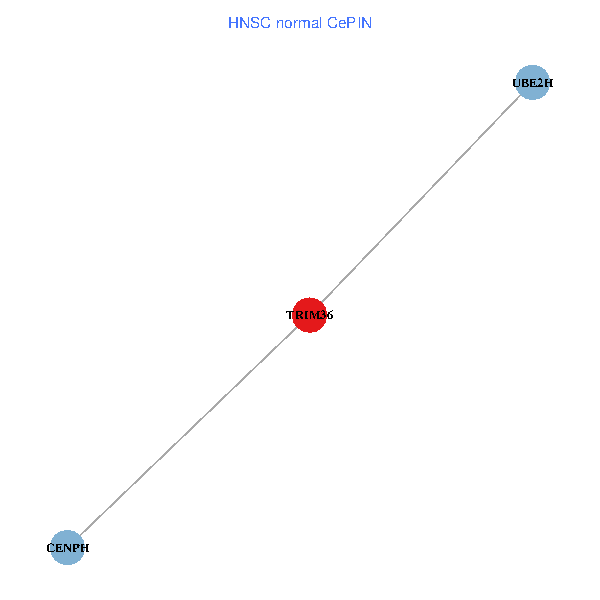
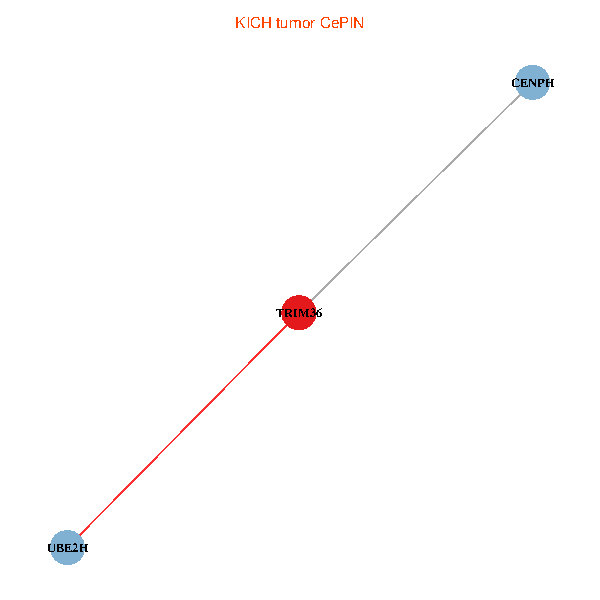
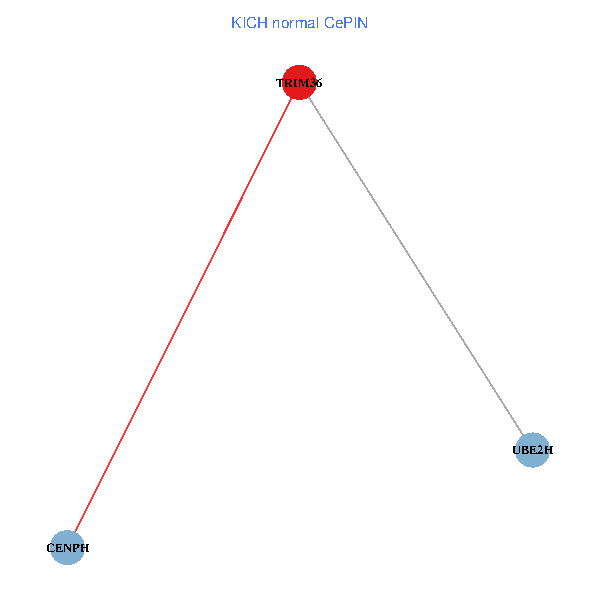
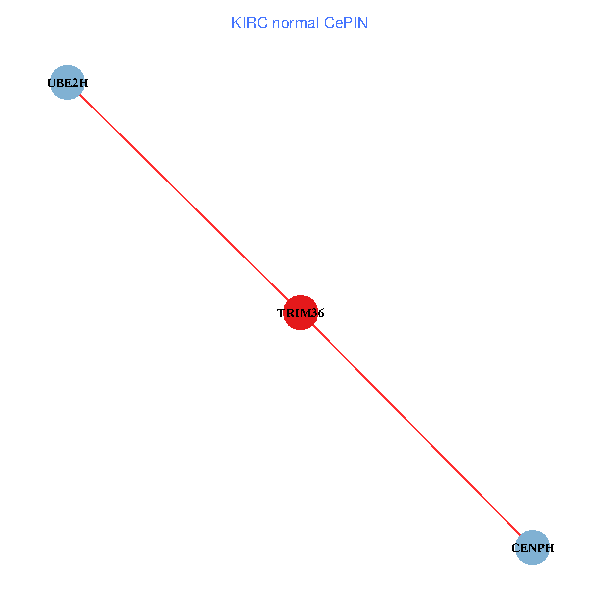
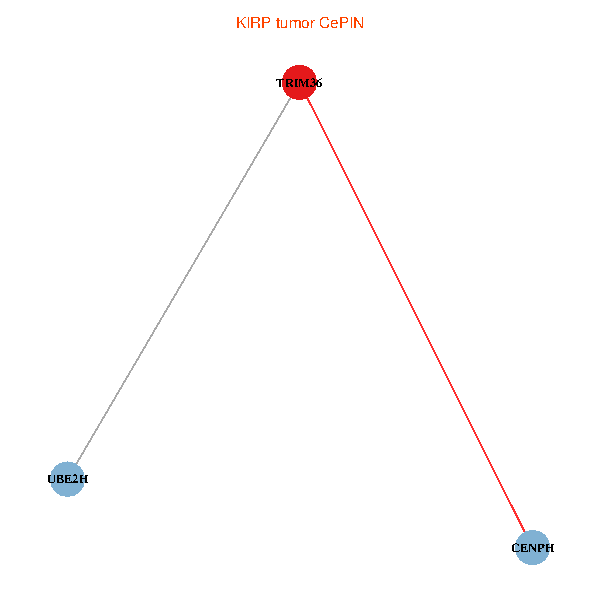
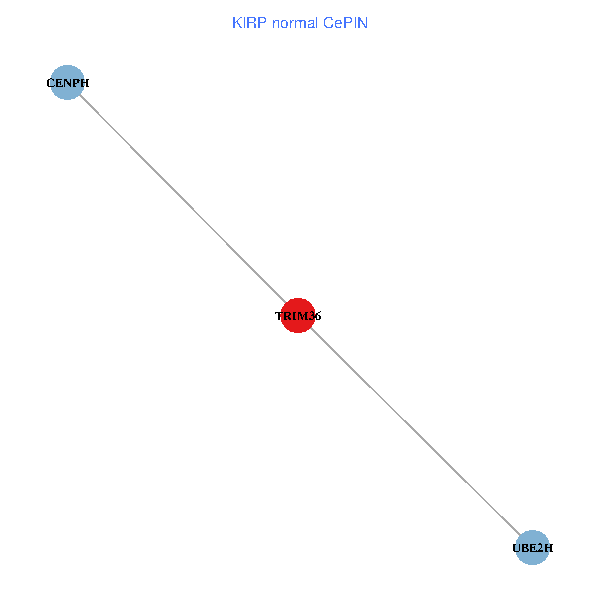
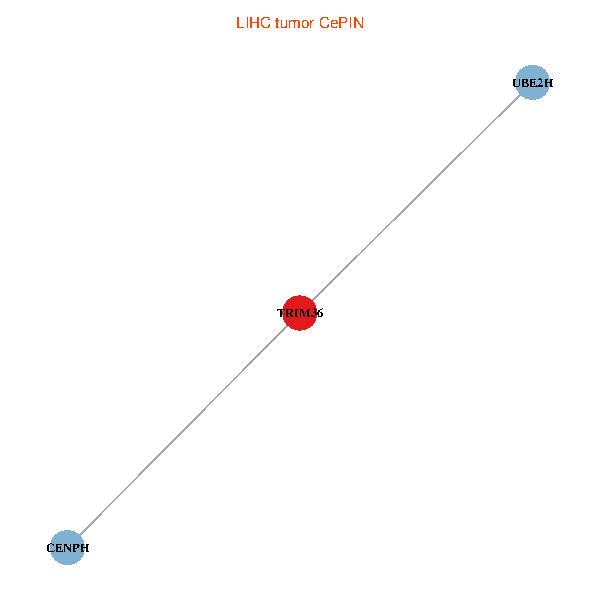
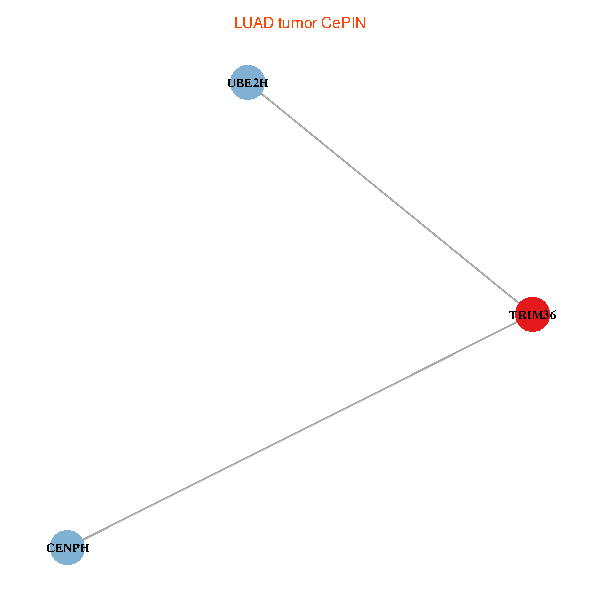
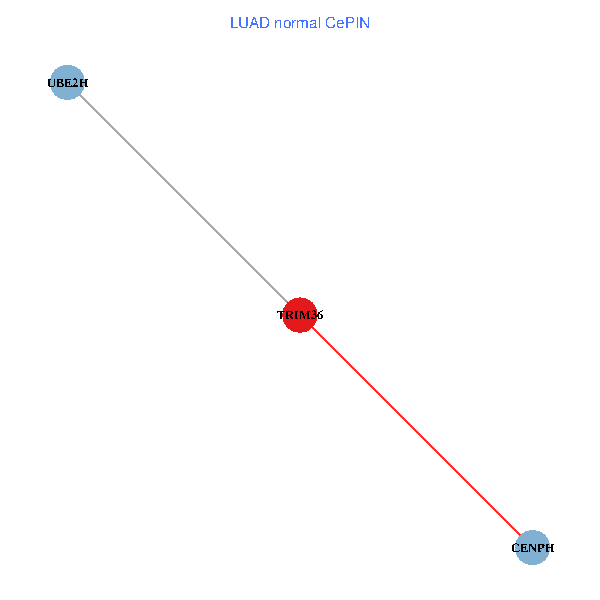
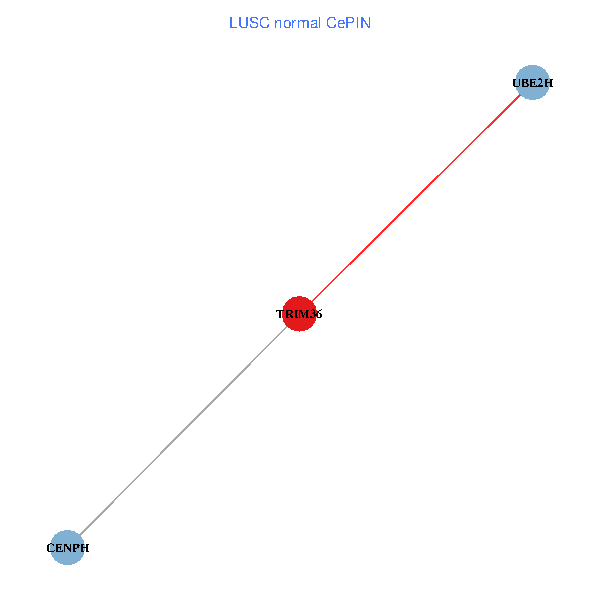
| Co-expressed gene networks based on protein-protein interaction data (CePIN) (TCGA IlluminaHiSeq_RNASeqV2, pan-cancer normalized log2(norm_counts+1) data, version 2016-08-16) (PINA2 ppi data) |
| BRCA (tumor) | BRCA (normal) |
| TRIM36, UBE2H, CENPH (tumor) | TRIM36, UBE2H, CENPH (normal) |
 |  |
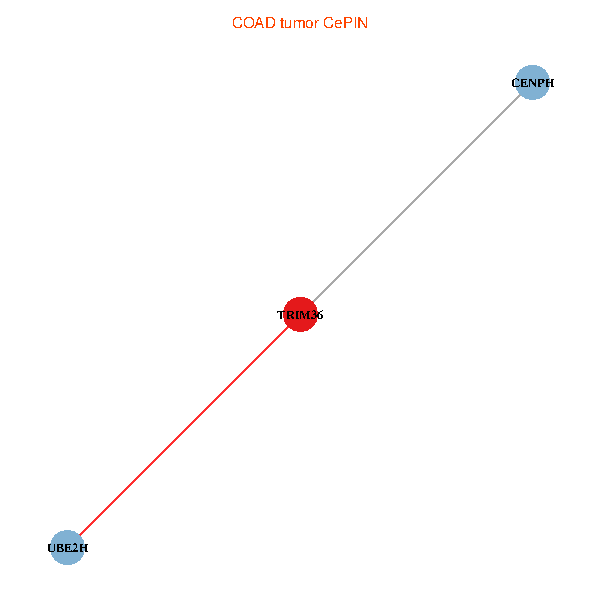
| COAD (tumor) | COAD (normal) |
| TRIM36, UBE2H, CENPH (tumor) | TRIM36, UBE2H, CENPH (normal) |
 |  |
| HNSC (tumor) | HNSC (normal) |
| TRIM36, UBE2H, CENPH (tumor) | TRIM36, UBE2H, CENPH (normal) |
 |  |
| KICH (tumor) | KICH (normal) |
| TRIM36, UBE2H, CENPH (tumor) | TRIM36, UBE2H, CENPH (normal) |
 |  |
| KIRC (tumor) | KIRC (normal) |
| TRIM36, UBE2H, CENPH (tumor) | TRIM36, UBE2H, CENPH (normal) |
 |  |
| KIRP (tumor) | KIRP (normal) |
| TRIM36, UBE2H, CENPH (tumor) | TRIM36, UBE2H, CENPH (normal) |
 |  |
| LIHC (tumor) | LIHC (normal) |
| TRIM36, UBE2H, CENPH (tumor) | TRIM36, UBE2H, CENPH (normal) |
 |  |
| LUAD (tumor) | LUAD (normal) |
| TRIM36, UBE2H, CENPH (tumor) | TRIM36, UBE2H, CENPH (normal) |
 |  |
| LUSC (tumor) | LUSC (normal) |
| TRIM36, UBE2H, CENPH (tumor) | TRIM36, UBE2H, CENPH (normal) |
 |  |
| PRAD (tumor) | PRAD (normal) |
| TRIM36, UBE2H, CENPH (tumor) | TRIM36, UBE2H, CENPH (normal) |
 |  |
| STAD (tumor) | STAD (normal) |
| TRIM36, UBE2H, CENPH (tumor) | TRIM36, UBE2H, CENPH (normal) |
 |  |
| THCA (tumor) | THCA (normal) |
| TRIM36, UBE2H, CENPH (tumor) | TRIM36, UBE2H, CENPH (normal) |
 |  |
| Top |
| TissGeneProg for TRIM36 |
| Kaplan-Meier plots with logrank tests of overall survival (OS) using 28 cancer types (TCGA IlluminaHiSeq_RNASeqV2, pan-cancer normalized log2(norm_counts+1) data, version 2016-08-16) (TCGA clinicalMatrix, phenotype data, version 2016-04-27) * Click on the image to enlarge it in a new window. |
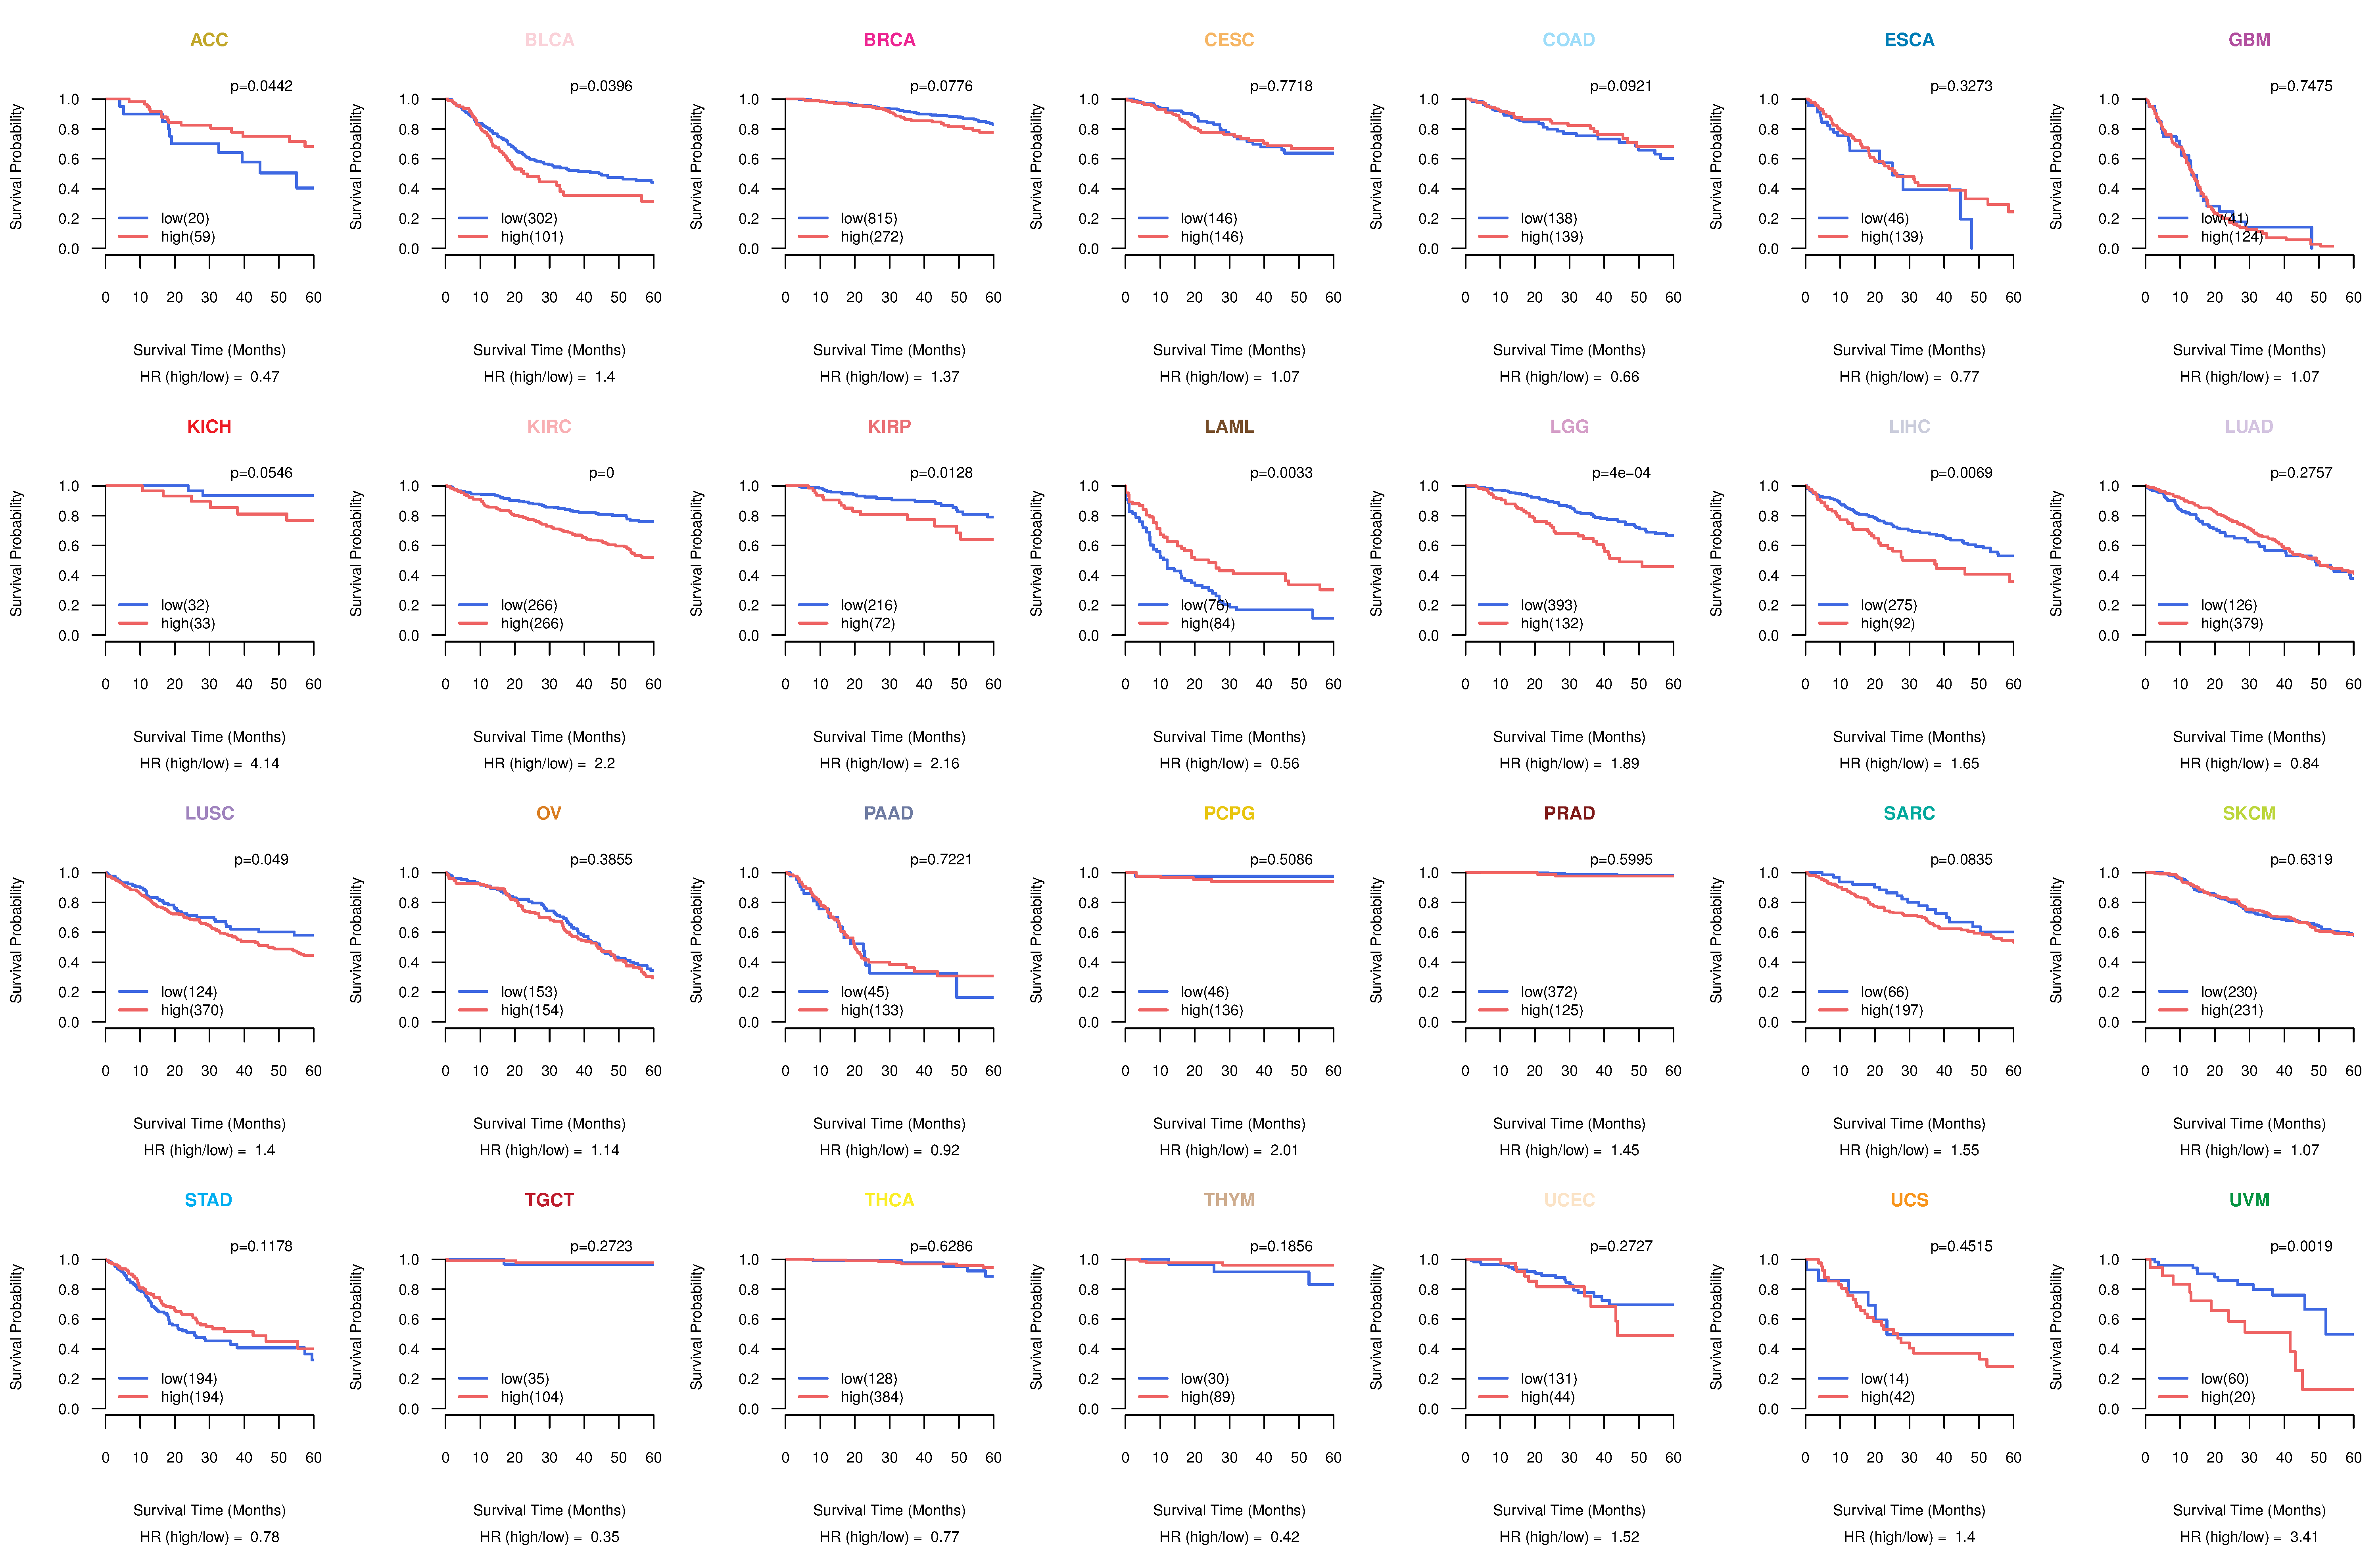 |
| Kaplan-Meier plots with logrank test of relapse free survival (RFS) using 28 cancer types (TCGA IlluminaHiSeq_RNASeqV2, pan-cancer normalized log2(norm_counts+1) data, version 2016-08-16) (TCGA clinicalMatrix, phenotype data, version 2016-04-27) * Click on the image enlarge it in a new window. |
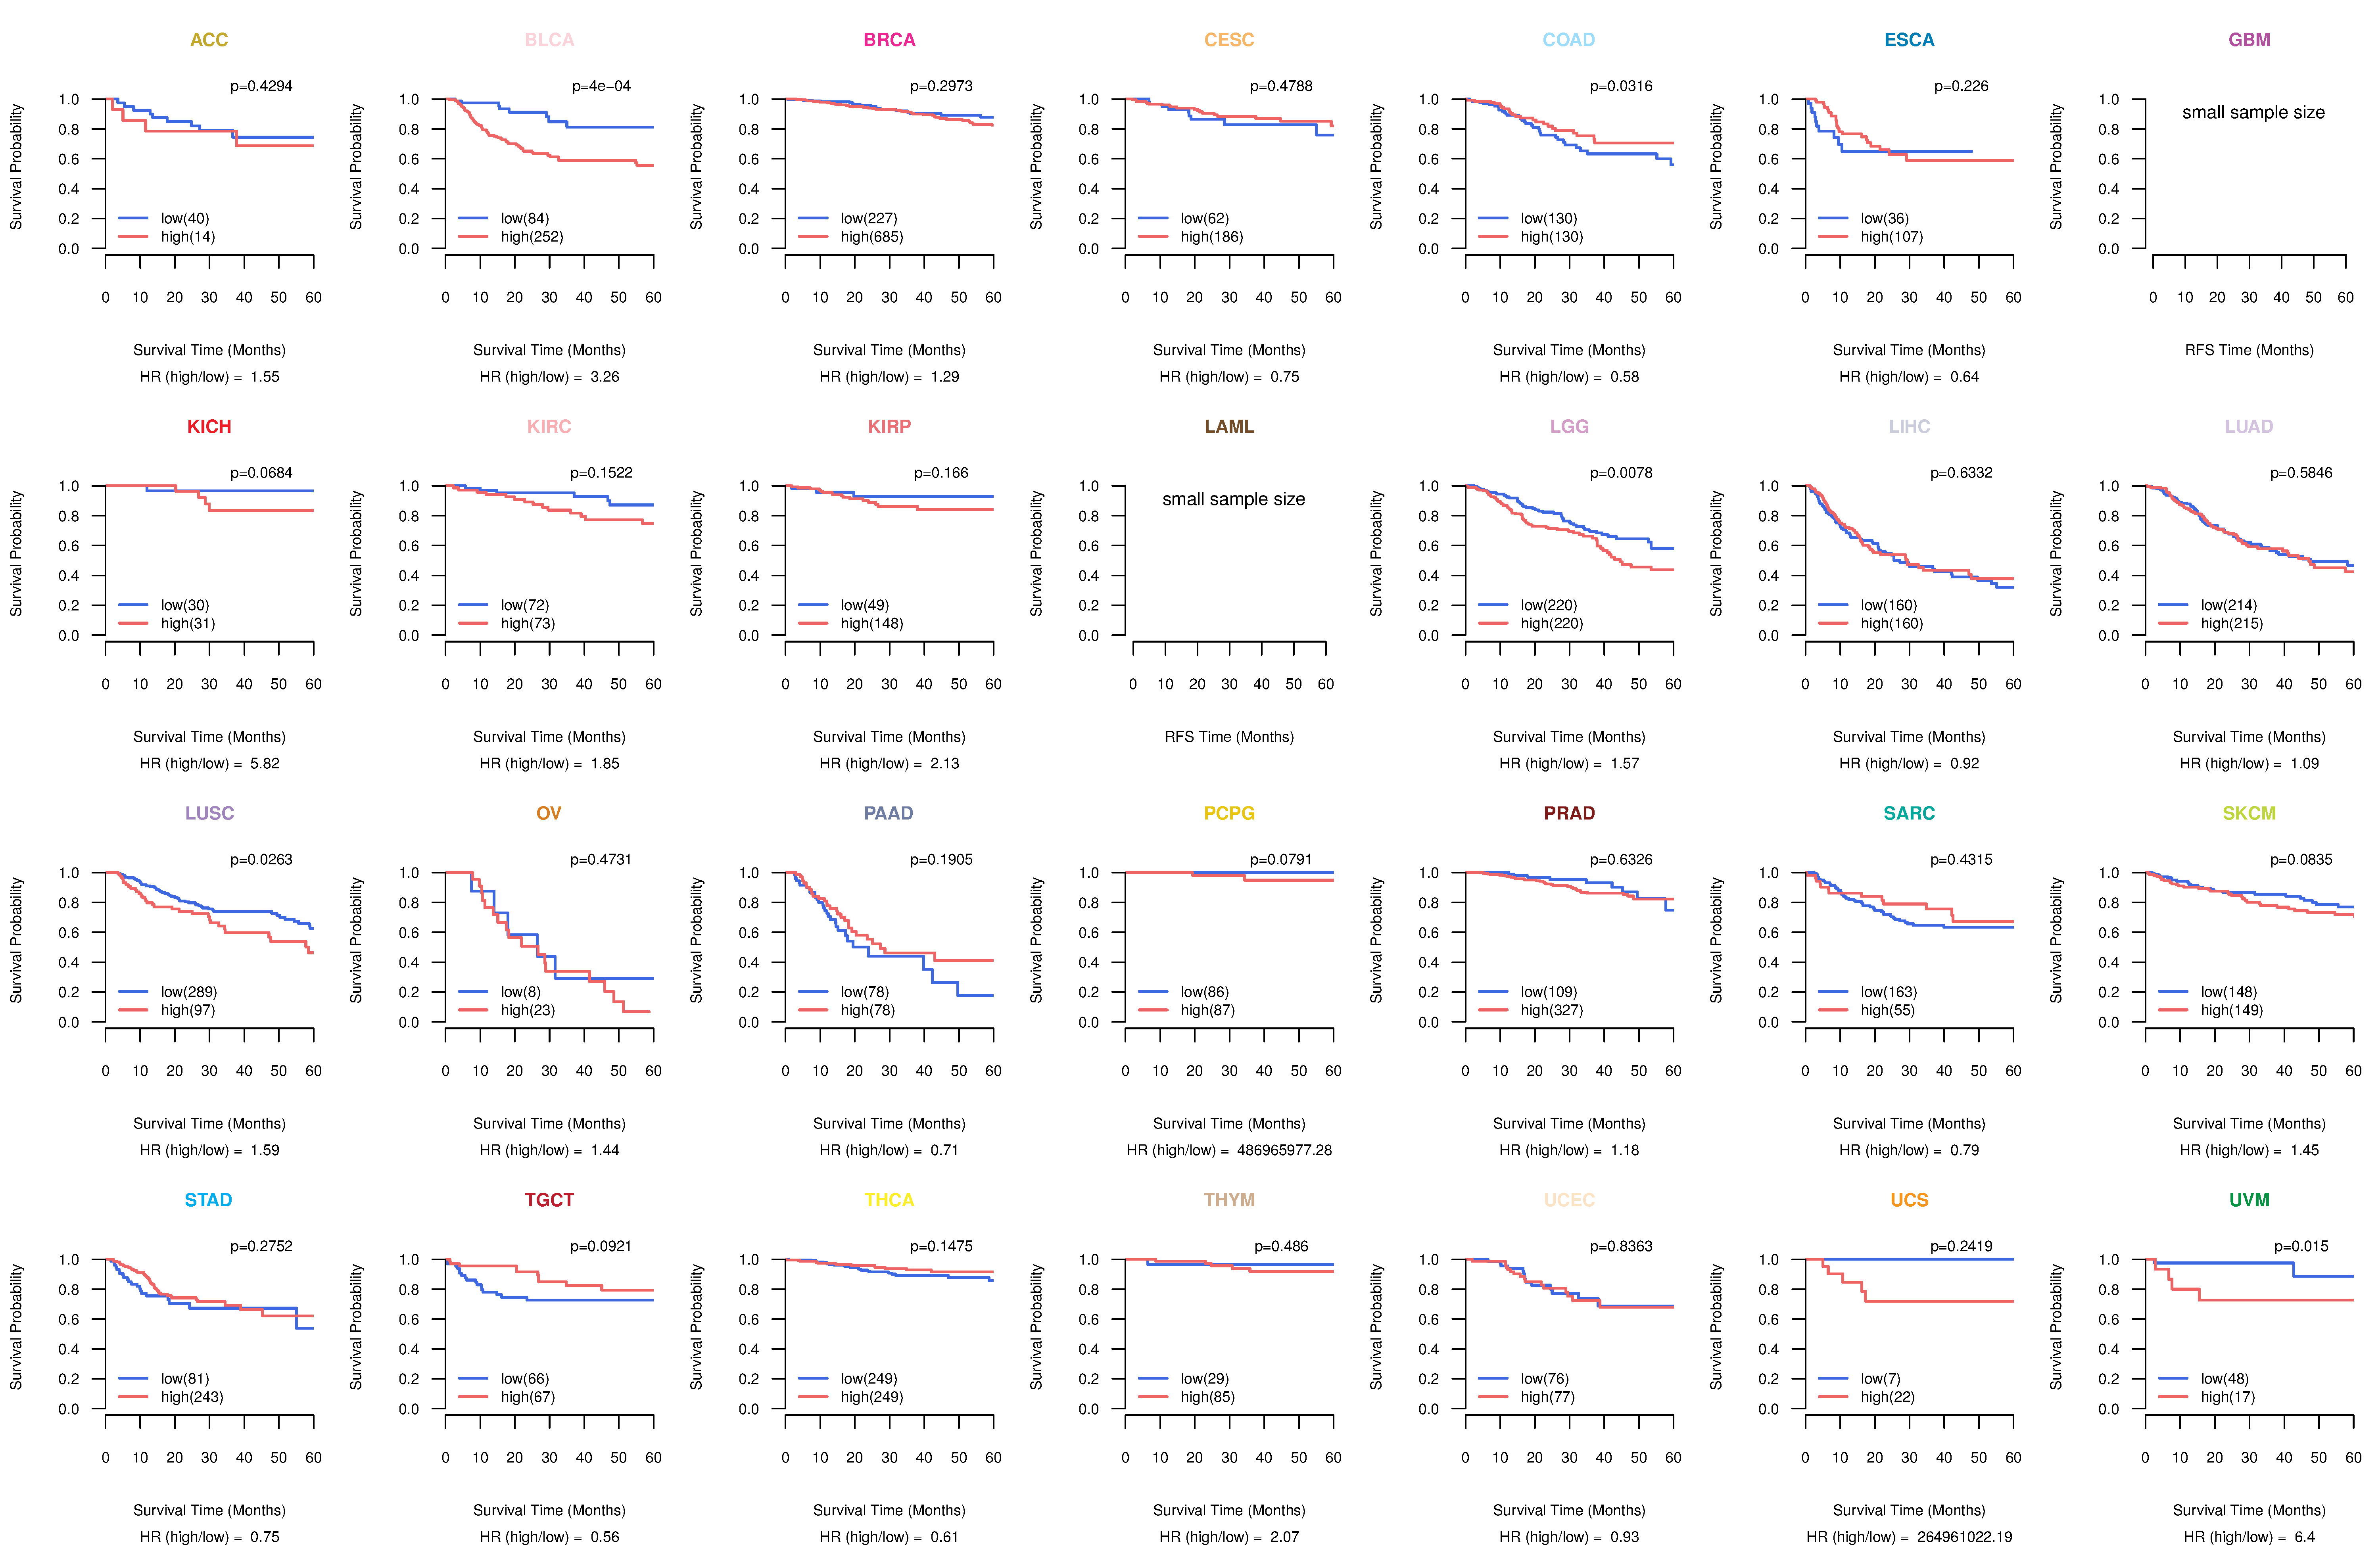 |
| Forest plot of Cox proportional hazard ratio (HR) and 95% CI of overall survival (OS) using 28 cancer types (TCGA IlluminaHiSeq_RNASeqV2, pan-cancer normalized log2(norm_counts+1) data, version 2016-08-16) (TCGA clinicalMatrix, phenotype data, version 2016-04-27) * Click on the image enlarge it in a new window. |
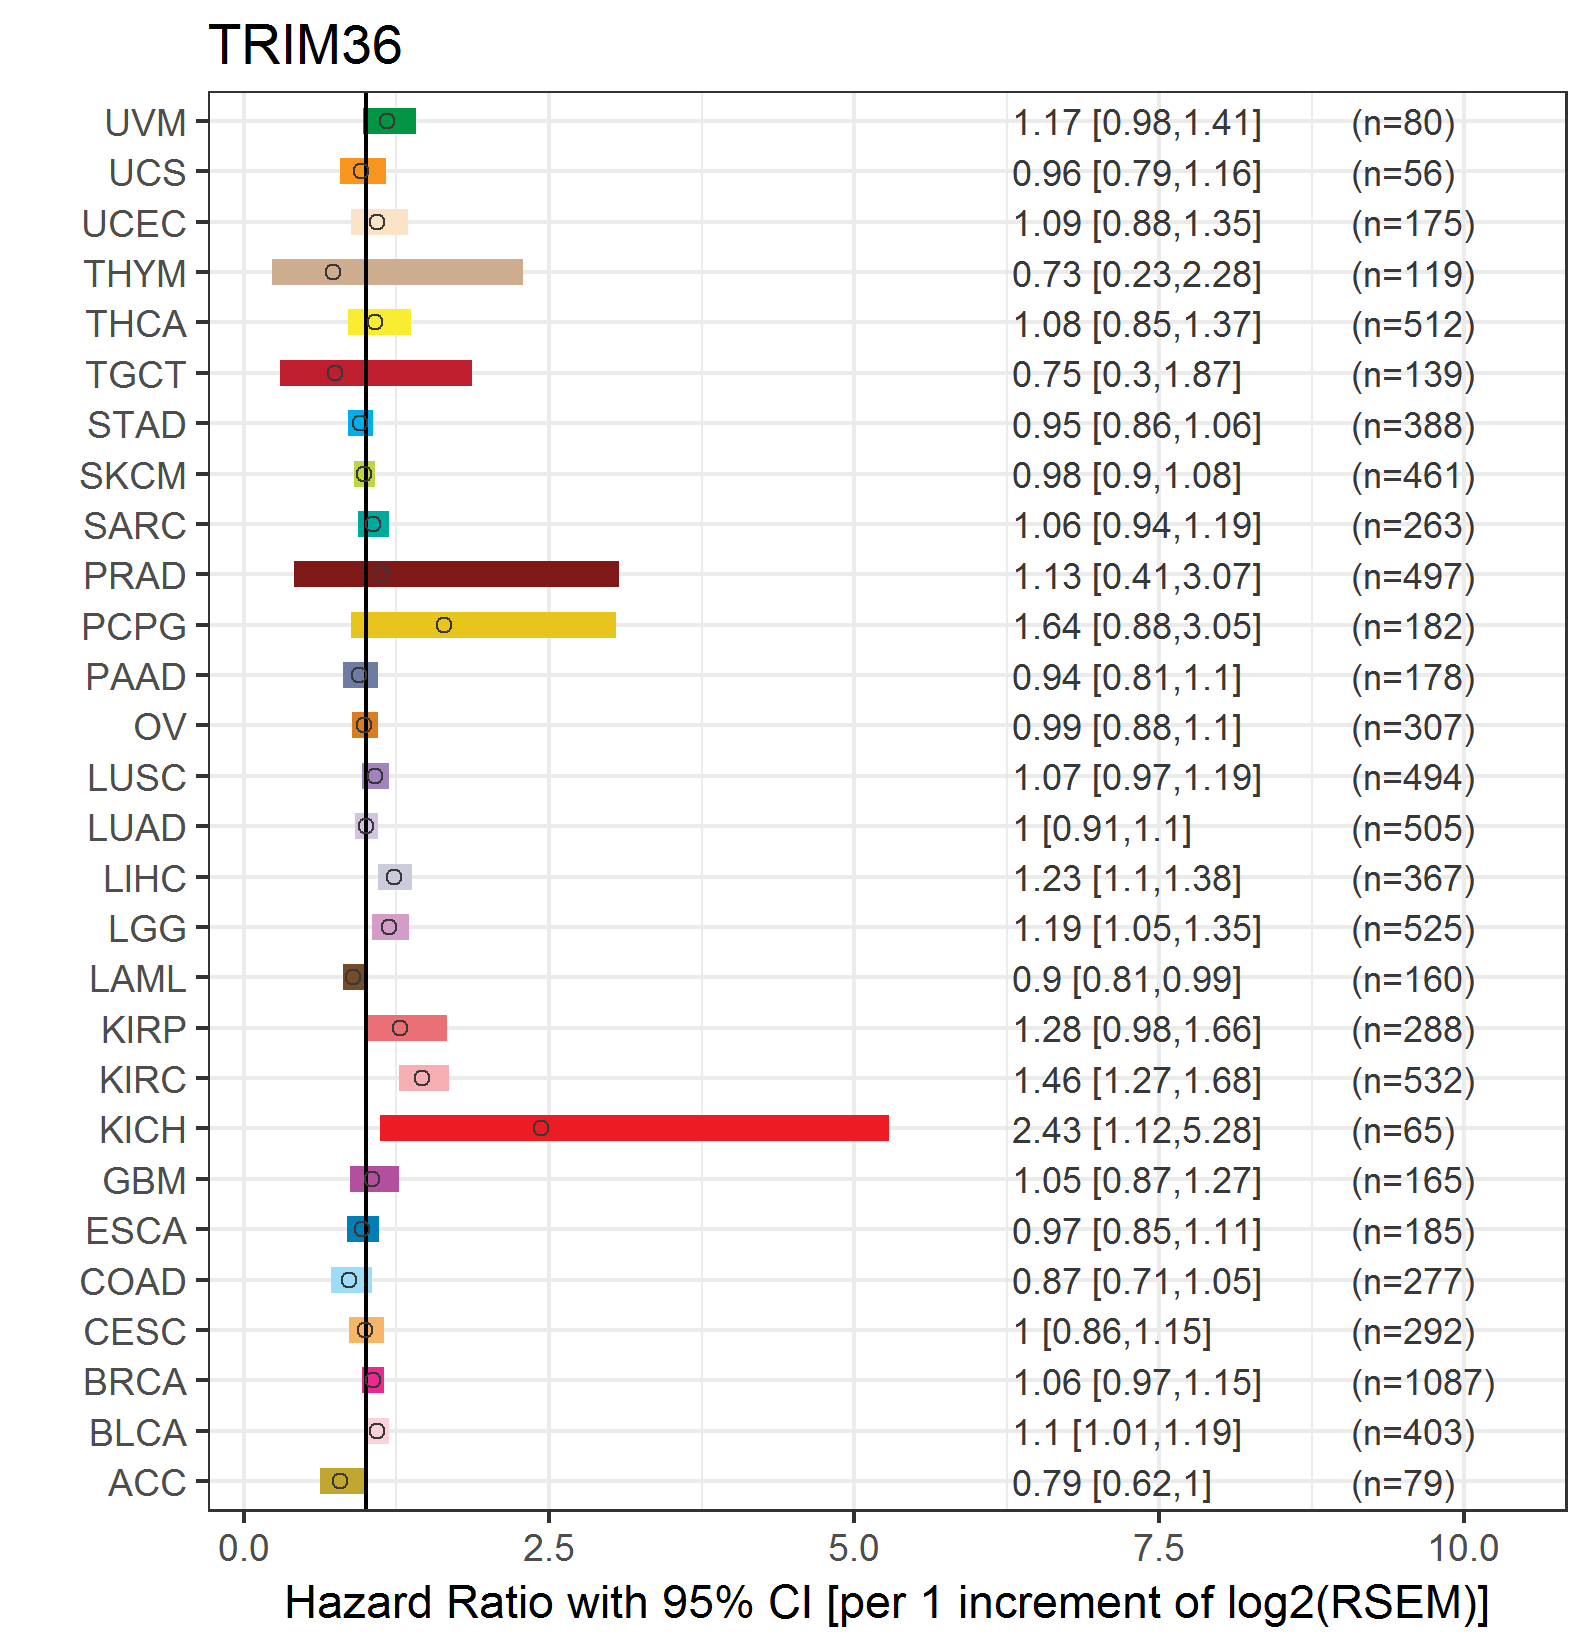 |
| Forest plot of Cox proportional hazard ratio (HR) and 95% CI of relapse free survival (RFS) using 28 cancer types (TCGA IlluminaHiSeq_RNASeqV2, pan-cancer normalized log2(norm_counts+1) data, version 2016-08-16) (TCGA clinicalMatrix, phenotype data, version 2016-04-27) * Click on the image enlarge it in a new window. |
 |
| Top |
| TissGeneClin for TRIM36 |
| TissGeneDrug for TRIM36 |
| Drug information targeting TissGene (DrugBank Version 5.0.6, 2017-04-01) |
| DrugBank ID | Drug name | Drug activity | Drug type | Drug status |
| Top |
| TissGeneDisease for TRIM36 |
| Disease information associated with TissGene (DisGeNet, 2016-06-01) |
| Disease ID | Disease name | # pubmeds | Source |
| umls:C0033578 | Prostatic Neoplasms | 1 | LHGDN |
| umls:C0040336 | Tobacco Use Disorder | 1 | GAD |
|
Copyright 2016-Present - The University of Texas Health Science Center at Houston (UTHealth) Web File Viewing | How to Report, Fraud, Waste and Abuse | State of Texas | Statewide Search | Texas Homeland Security | Site Policies |