 |
| |
| |
| |
| |
| |
| |
|

| TissGeneSummary for MIOX |
 Gene summary Gene summary |
| Basic gene information | Gene symbol | MIOX |
| Gene name | myo-inositol oxygenase | |
| Synonyms | ALDRL6 | |
| Cytomap | UCSC genome browser: 22q13.3 | |
| Type of gene | protein-coding | |
| RefGenes | NM_017584.5, | |
| Description | MI oxygenasealdehyde reductase (aldose reductase) like 6aldehyde reductase-like 6inositol oxygenasekidney-specific protein 32renal-specific oxidoreductase | |
| Modification date | 20141207 | |
| dbXrefs | MIM : 606774 | |
| HGNC : HGNC | ||
| HPRD : 12443 | ||
| Protein | UniProt: go to UniProt's Cross Reference DB Table | |
| Expression | CleanEX: HS_MIOX | |
| BioGPS: 55586 | ||
| Pathway | NCI Pathway Interaction Database: MIOX | |
| KEGG: MIOX | ||
| REACTOME: MIOX | ||
| Pathway Commons: MIOX | ||
| Context | iHOP: MIOX | |
| ligand binding site mutation search in PubMed: MIOX | ||
| UCL Cancer Institute: MIOX | ||
| Assigned class in TissGDB* | B | |
| Included tissue-specific gene expression resources | HPA,TiGER,GTEx | |
| Specific-tissues in normal samples (assigned by TissGDB using HPA, TiGER, and GTEx) | Kidney | |
| Cancer types related to the specific-tissues in cancer samples (assigned by TissGDB using TCGA) | KIRC,KIRP,KICH | |
| Reference showing the relevant tissue of MIOX | ||
| Description by TissGene annotations | TissgsKTS CNV lost TissGeneKTS | |
| * Class A consists of genes with literature evidence and is part of the cTissGenes. Class B consists of only cTissGenes without additional evidence. The remaining genes belong to Class C. |
| Gene ontology having evidence of Inferred from Direct Assay (IDA) from Entrez |
| GO ID | GO term | PubMed ID | GO:0019310 | inositol catabolic process | 18364358 | GO:0019310 | inositol catabolic process | 18364358 |
| Top |
| TissGeneExp for MIOX |
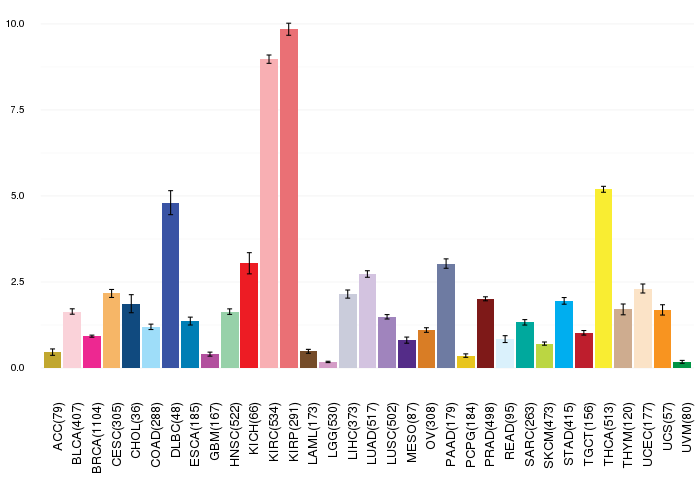
| Gene expressions across 28 cancer types (X-axis: cancer type and Y-axis: log2(norm_counts+1)) (TCGA IlluminaHiSeq_RNASeqV2, pan-cancer normalized log2(norm_counts+1) data, version 2016-08-16) |
 |
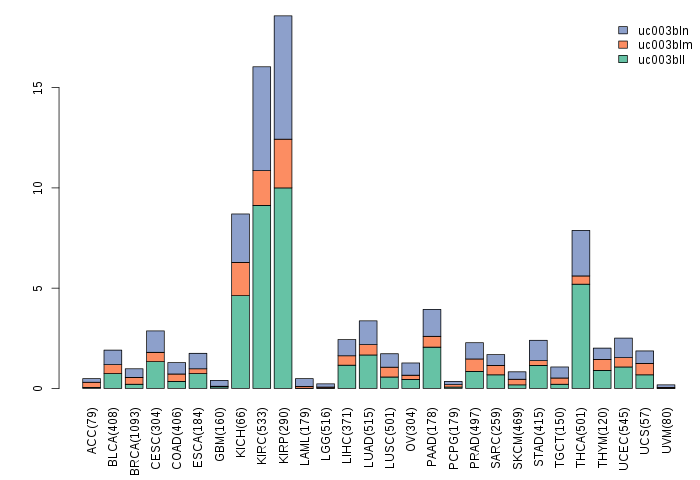
| Gene isoform expressions across 28 cancer types (X-axis: cancer type and Y-axis: log2(norm_counts+1)) (TCGA pan-cancer tcga_rsem_isoform_tpm, version 2016-09-01) |
 |
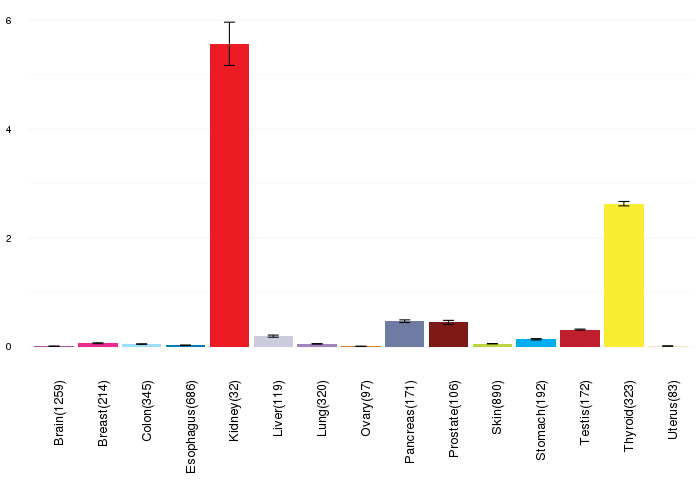
| Gene expressions across normal tissues of GTEx data (GTEx GTEx_Analysis_v6_RNA-seq_RNA-SeQCv1.1.8_gene_rpkm.gct) - Here, we shows the matched tissue types only among our 28 cancer types. |
 |
| Different expressions across 14 cancer types with more than 10 samples between matched tumors and normals (X-axis: cancer type and Y-axis: log2(norm_counts+1)) (TCGA IlluminaHiSeq_RNASeqV2, pan-cancer normalized log2(norm_counts+1) data, version 2016-08-16) |
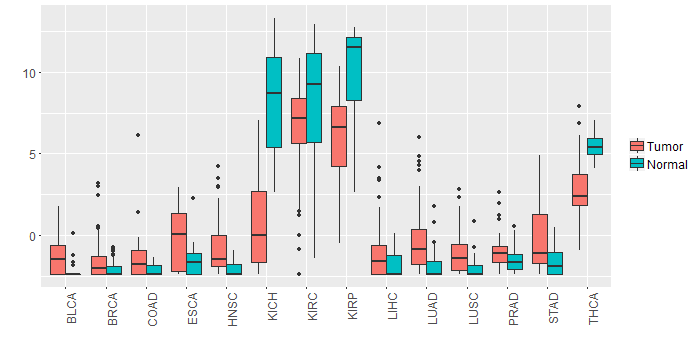 |
| - Significantly differentially expressed cancer types and information. (|Fold change|>1 and FDR<0.05) |
| Cancer type | Mean(exp) in tumor | Mean(exp) in matched normal | Log2FC | P-val. | FDR |
| LUAD | -0.233114946 | -1.955147705 | 1.722032759 | 1.15E-07 | 4.47E-07 |
| THCA | 2.883296714 | 5.442562815 | -2.559266102 | 2.51E-16 | 4.24E-15 |
| KICH | 0.665096985 | 8.388300985 | -7.723204 | 1.61E-12 | 1.83E-11 |
| KIRP | 5.97440736 | 10.07173861 | -4.09733125 | 2.30E-07 | 1.31E-06 |
| KIRC | 6.637431318 | 8.263645207 | -1.626213889 | 0.00232 | 0.004199612 |
| STAD | -0.063802015 | -1.69079889 | 1.626996875 | 0.000592 | 0.003449244 |
| HNSC | -0.793782829 | -2.093627015 | 1.299844186 | 2.21E-05 | 0.00011564 |
| Top |
| TissGene-miRNA for MIOX |
| Significantly anti-correlated miRNAs of TissGene across 28 cancer types (Gene-miRNA relations from TargetScanHuman Relsease 7.1, Conserved_Site_Context_Scores.txt.zip, 06.01.2016) (TCGA IlluminaHiSeq_miRNASeq, log2(RPM+1) data, version 2016-11-21) (TCGA IlluminaHiSeq_RNASeqV2, log2(normalized_count+1) data, version 2016-08-16) (Spearman’s Rank Correlation (p-value<0.05 and coefficient<-0.25)) |
| Cancer type | miRNA id | miRNA accession | P-val. | Coeff. | # samples |
| Top |
| TissGeneMut for MIOX |
| TissGeneSNV for MIOX |
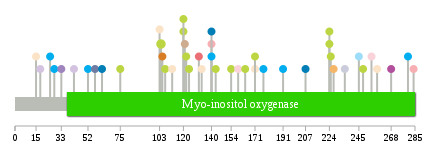
| nsSNV counts per each loci. Different colors of circles represent different cancer types. Circle size denotes number of samples. (TCGA somatic mutation (SNPs and small INDELs) data, version 2016-04-25) * Click on the image to enlarge it in a new window. |
 |
 |
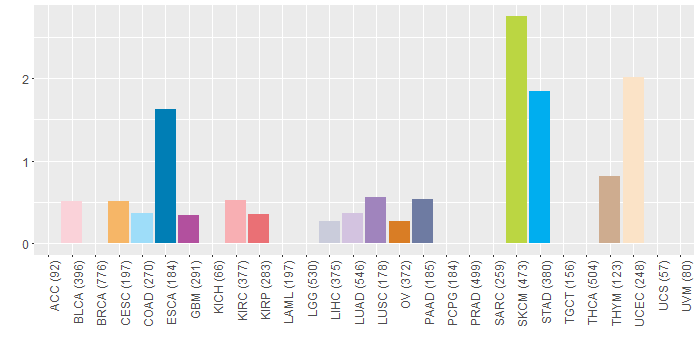
| Somatic nucleotide variants of TissGene across 28 cancer types (X-axis: cancer type and Y-axis: % of mutated samples) The numbers in parentheses are numbers of samples with mutation (nsSNVs). (TCGA somatic mutation (SNPs and small INDELs) data, version 2016-04-25) |
 |
| - nsSNVs sorted by frequency. |
| AAchange | Cancer type | # samples |
| p.E104K | SKCM | 2 |
| p.G258R | UCEC | 1 |
| p.R171* | SKCM | 1 |
| p.P122S | SKCM | 1 |
| p.G177R | STAD | 1 |
| p.P154L | SKCM | 1 |
| p.G105D | OV | 1 |
| p.Q180* | HNSC | 1 |
| p.D124N | SKCM | 1 |
| p.P280L | STAD | 1 |
| p.R107Q | HNSC | 1 |
| p.R57K | PAAD | 1 |
| p.S33_splice | LUSC | 1 |
| p.R248* | SKCM | 1 |
| p.A103V | UCEC | 1 |
| p.D112Y | UCEC | 1 |
| p.N164K | SKCM | 1 |
| p.E75K | SKCM | 1 |
| p.T143I | SKCM | 1 |
| p.P15S | UCEC | 1 |
| p.S191P | STAD | 1 |
| p.R107Q | SKCM | 1 |
| p.S284N | KIRC | 1 |
| p.G131V | KIRP | 1 |
| p.S121P | THYM | 1 |
| p.Q62H | ESCA | 1 |
| p.F28L | STAD | 1 |
| p.V140I | ESCA | 1 |
| p.T42S | LUAD | 1 |
| p.A159V | BLCA | 1 |
| p.W140* | KIRC | 1 |
| p.V140I | STAD | 1 |
| p.K25N | STAD | 1 |
| p.P224S | SKCM | 1 |
| p.R268Q | GBM | 1 |
| p.R171Q | UCEC | 1 |
| p.W245C | COAD | 1 |
| p.C235S | LIHC | 1 |
| p.G120R | SKCM | 1 |
| p.D18Y | LUAD | 1 |
| p.P254S | BLCA | 1 |
| p.P224L | SKCM | 1 |
| p.W225* | SKCM | 1 |
| p.G268E | HNSC | 1 |
| p.G120E | SKCM | 1 |
| p.F207L | ESCA | 1 |
| p.T52R | STAD | 1 |
| p.G133R | UCEC | 1 |
| p.T227M | CESC | 1 |
| Top |
| TissGeneCNV for MIOX |
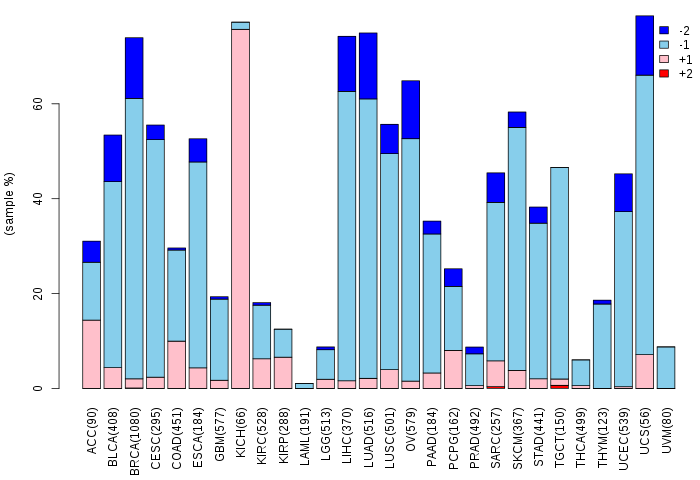
| Copy number variations of TissGene across 28 cancer types (X-axis: cancer type and Y-axis: % of CNV samples) (TCGA Gistic2_CopyNumber_Gistic2_all_data_by_genes, Gistic2 copy number data, version 2016-08-16) |
 |
| Top |
| TissGeneFusions for MIOX |
| Fusion genes including TissGene (ChimerDB 3.0, 2016-12-01 and TCGA fusion Portal 2015-12-01) |
| Database | Src | Cancer type | Sample | Fusion gene | ORF | 5'-gene BP | 3'-gene BP |
| Chimerdb3.0 | ChiTaRs | NA | AF230095 | NUMA1-MIOX | chr11:71778613 | chr22:50925300 |
| Top |
| TissGeneNet for MIOX |
| Co-expressed gene networks based on protein-protein interaction data (CePIN) (TCGA IlluminaHiSeq_RNASeqV2, pan-cancer normalized log2(norm_counts+1) data, version 2016-08-16) (PINA2 ppi data) |
| Top |
| TissGeneProg for MIOX |
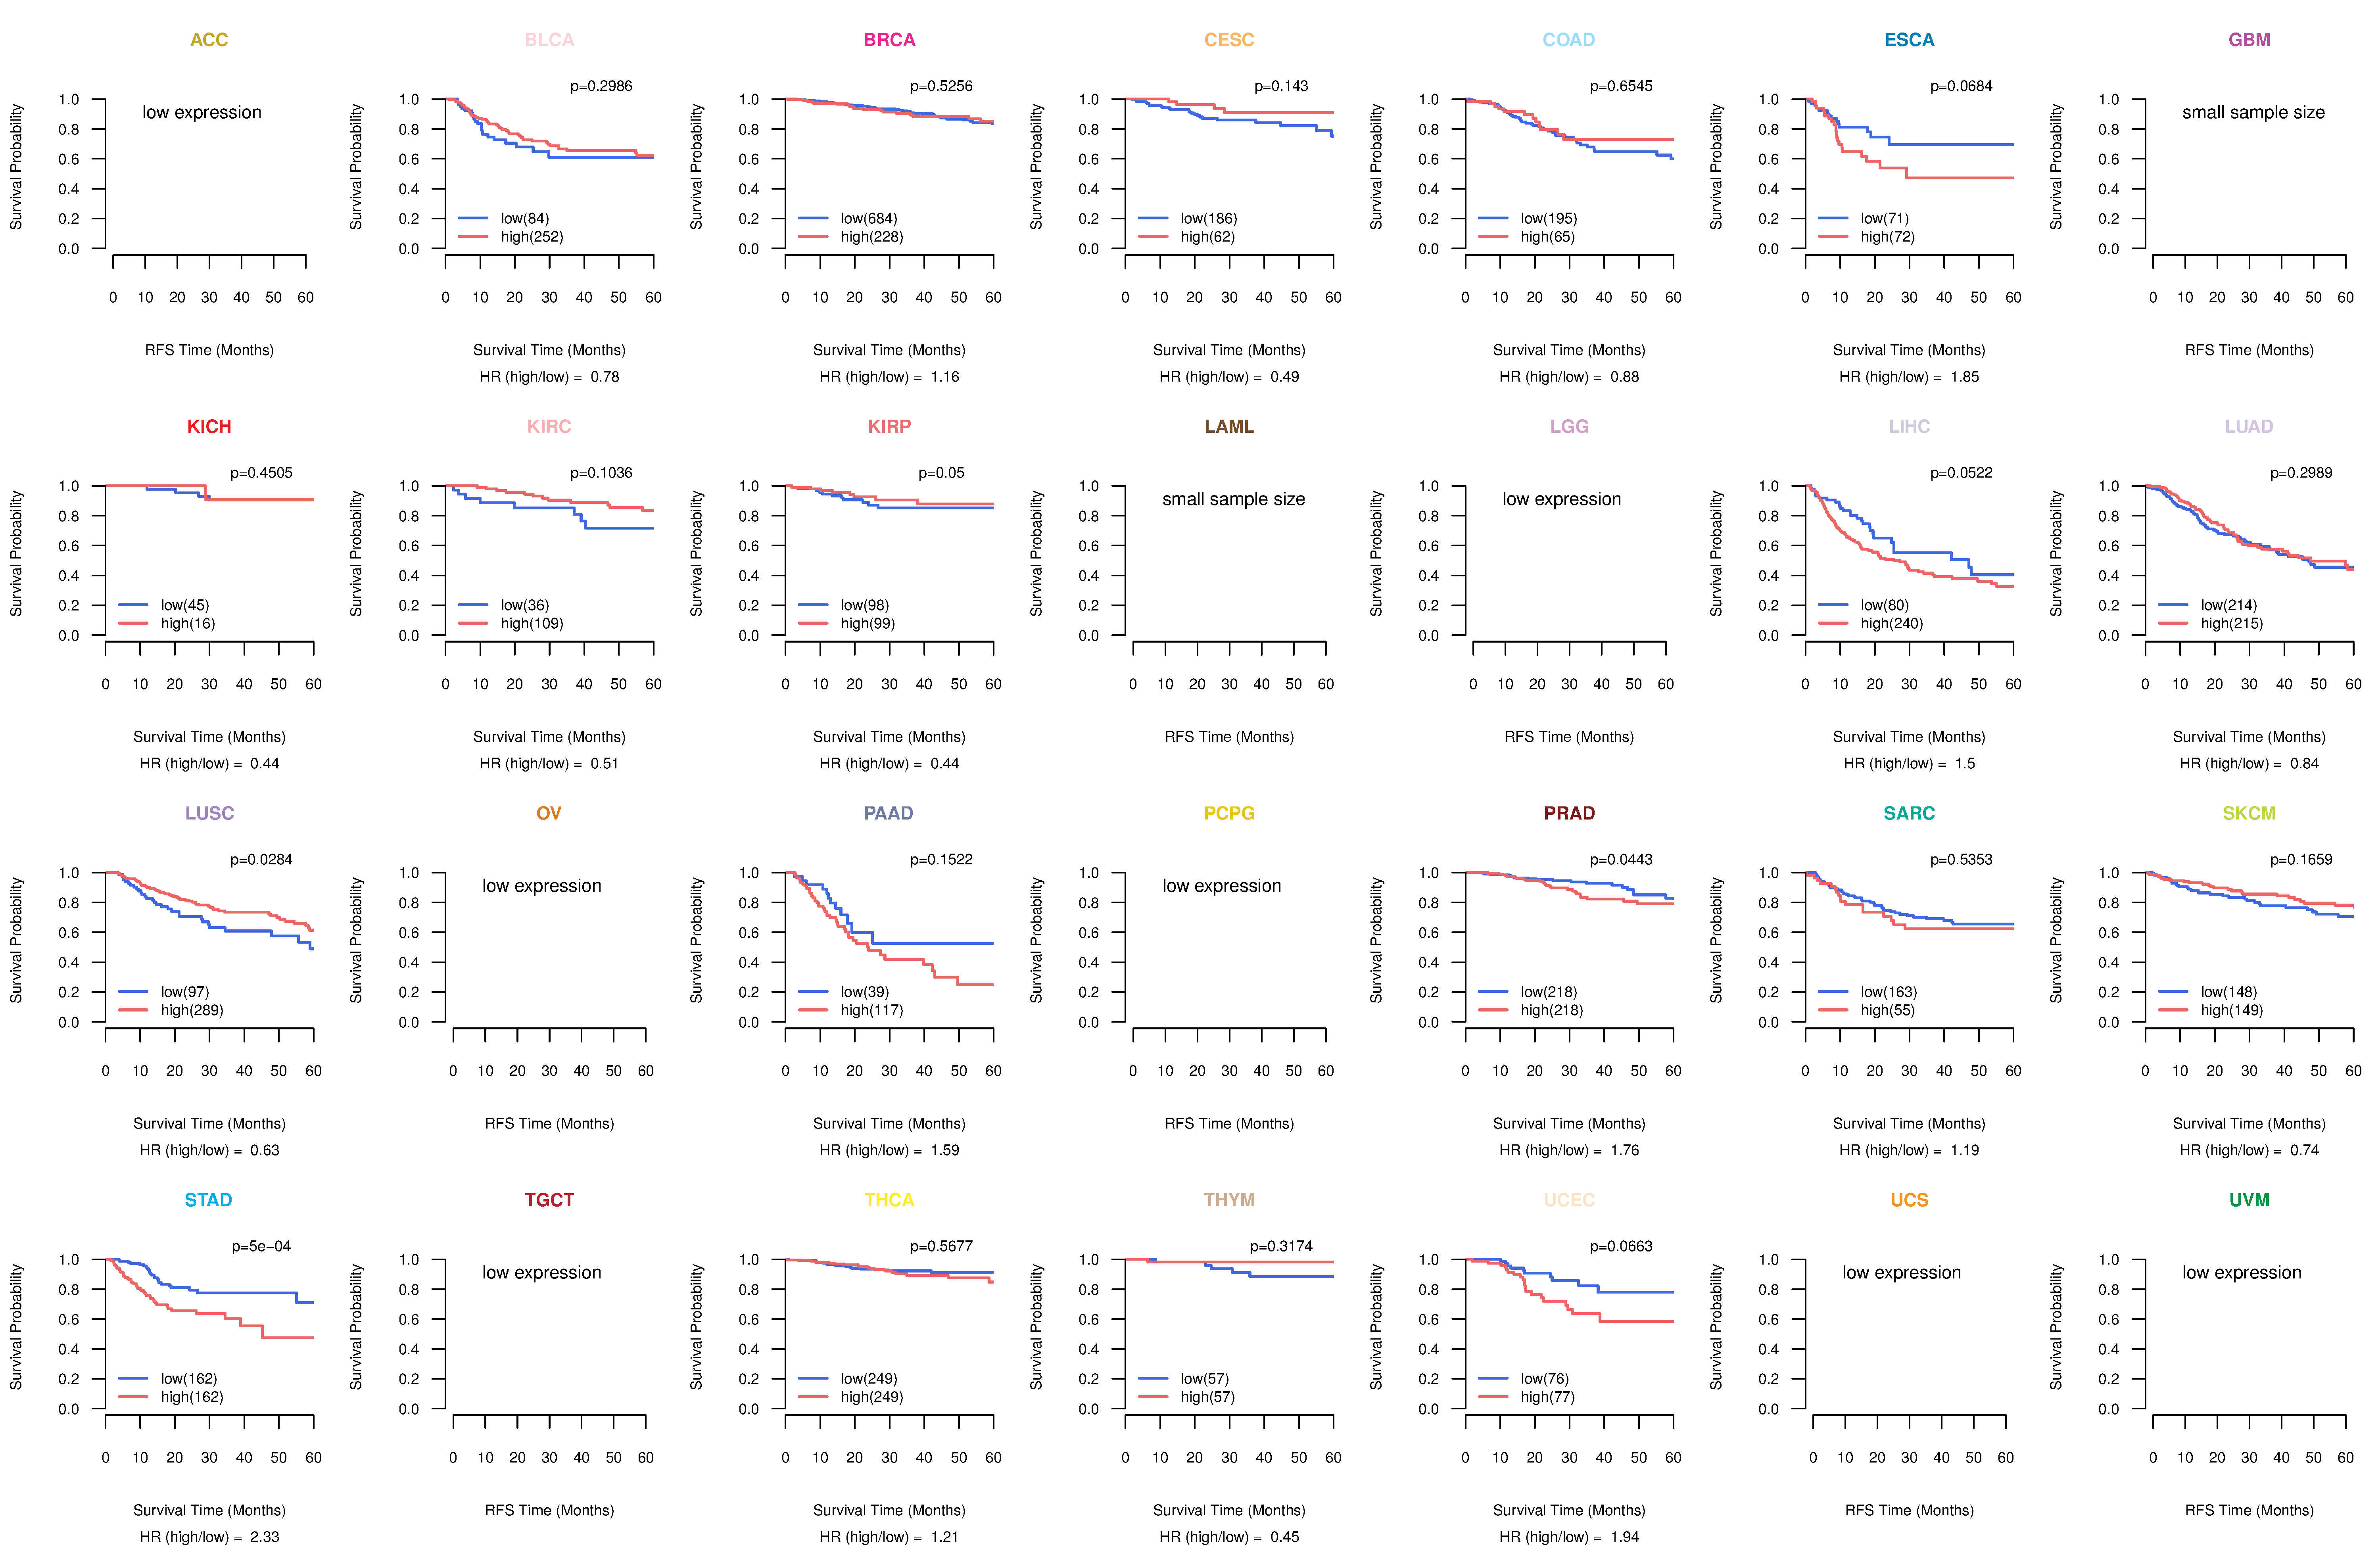
| Kaplan-Meier plots with logrank tests of overall survival (OS) using 28 cancer types (TCGA IlluminaHiSeq_RNASeqV2, pan-cancer normalized log2(norm_counts+1) data, version 2016-08-16) (TCGA clinicalMatrix, phenotype data, version 2016-04-27) * Click on the image to enlarge it in a new window. |
 |
| Kaplan-Meier plots with logrank test of relapse free survival (RFS) using 28 cancer types (TCGA IlluminaHiSeq_RNASeqV2, pan-cancer normalized log2(norm_counts+1) data, version 2016-08-16) (TCGA clinicalMatrix, phenotype data, version 2016-04-27) * Click on the image enlarge it in a new window. |
 |
| Forest plot of Cox proportional hazard ratio (HR) and 95% CI of overall survival (OS) using 28 cancer types (TCGA IlluminaHiSeq_RNASeqV2, pan-cancer normalized log2(norm_counts+1) data, version 2016-08-16) (TCGA clinicalMatrix, phenotype data, version 2016-04-27) * Click on the image enlarge it in a new window. |
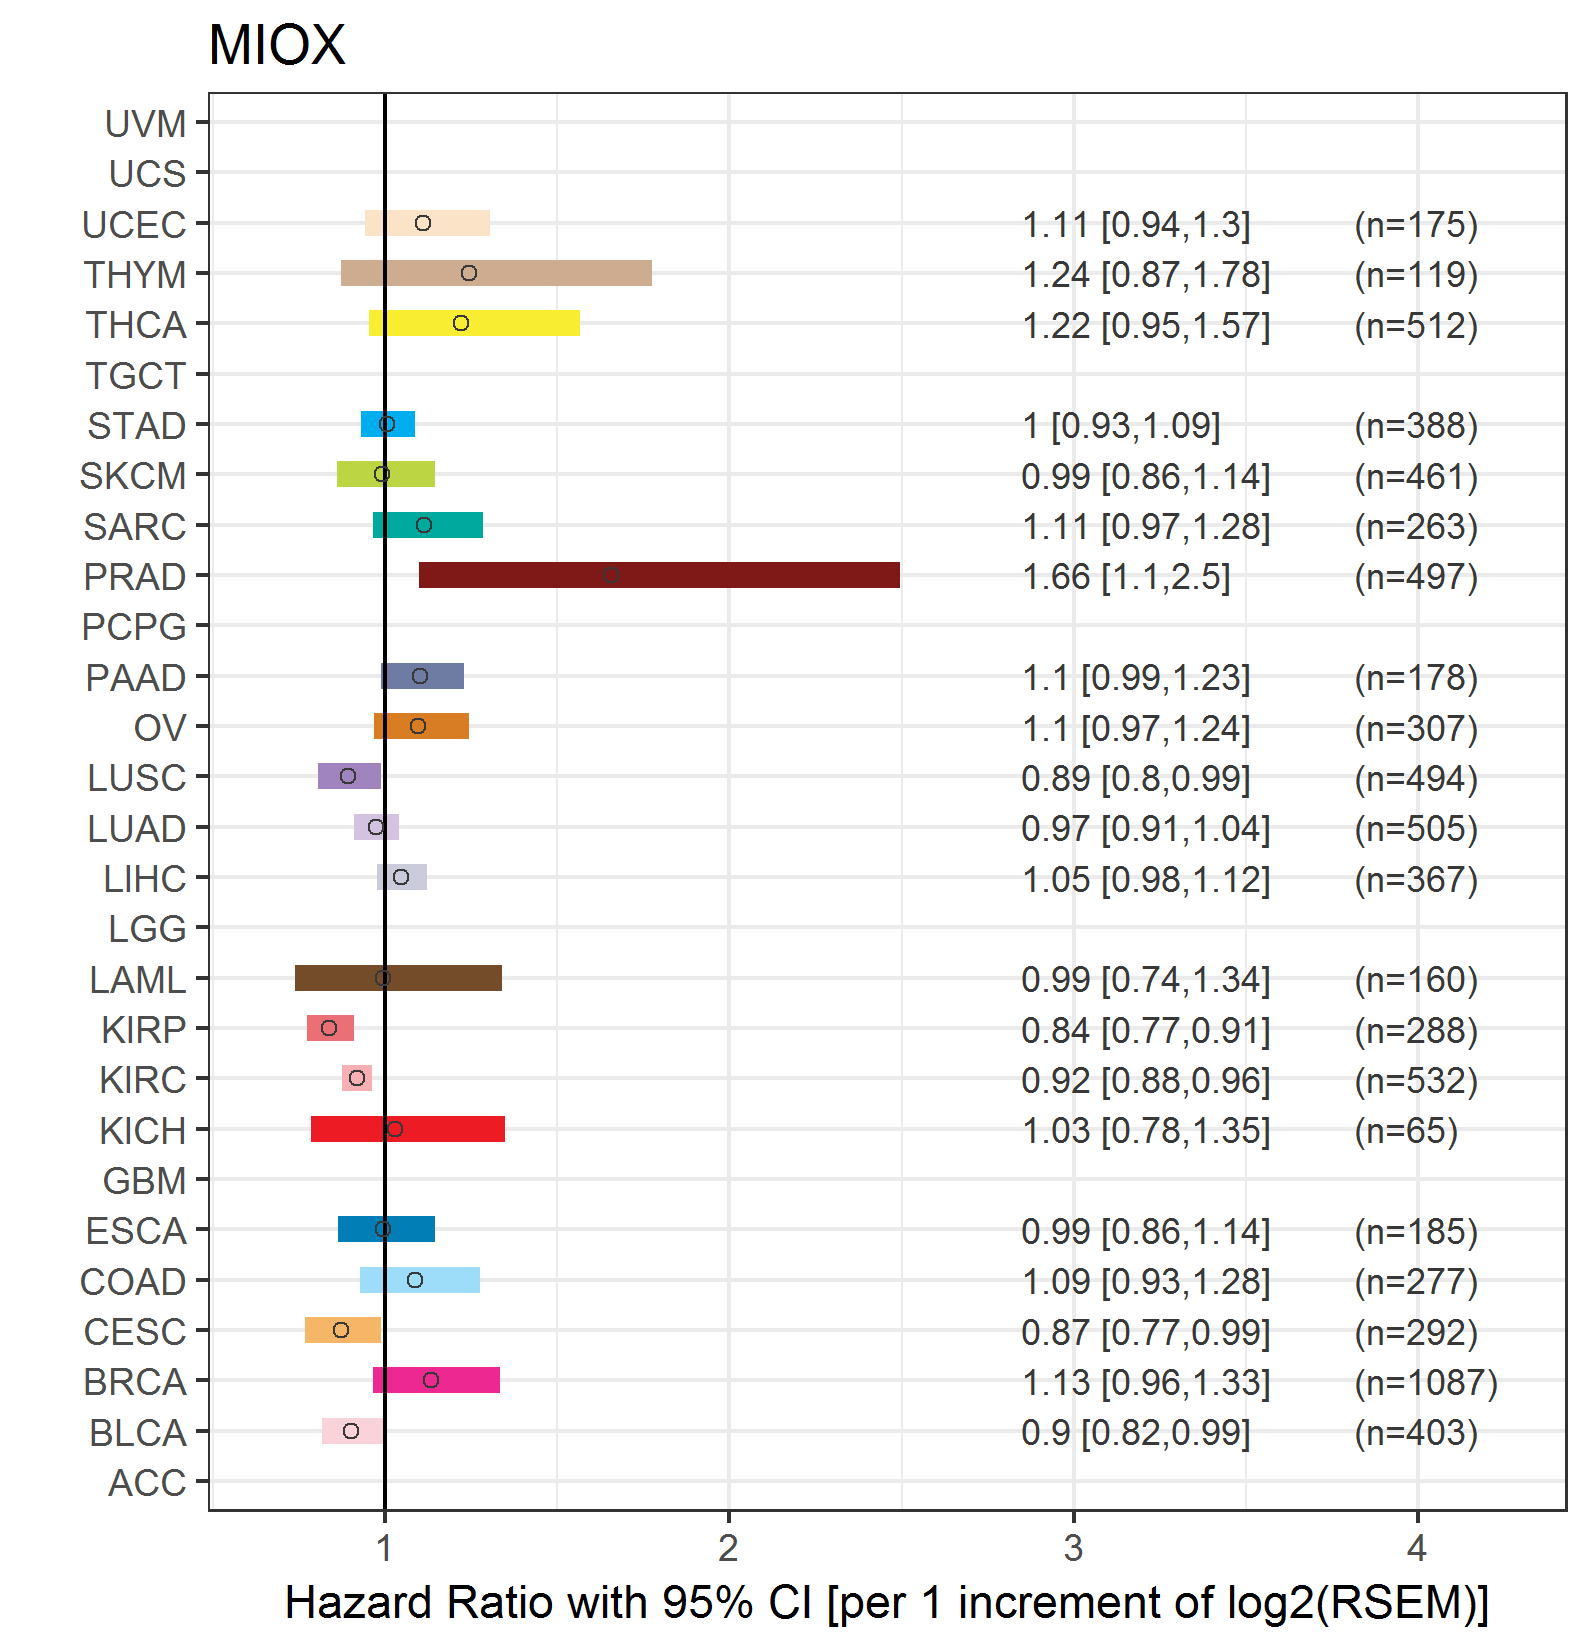 |
| Forest plot of Cox proportional hazard ratio (HR) and 95% CI of relapse free survival (RFS) using 28 cancer types (TCGA IlluminaHiSeq_RNASeqV2, pan-cancer normalized log2(norm_counts+1) data, version 2016-08-16) (TCGA clinicalMatrix, phenotype data, version 2016-04-27) * Click on the image enlarge it in a new window. |
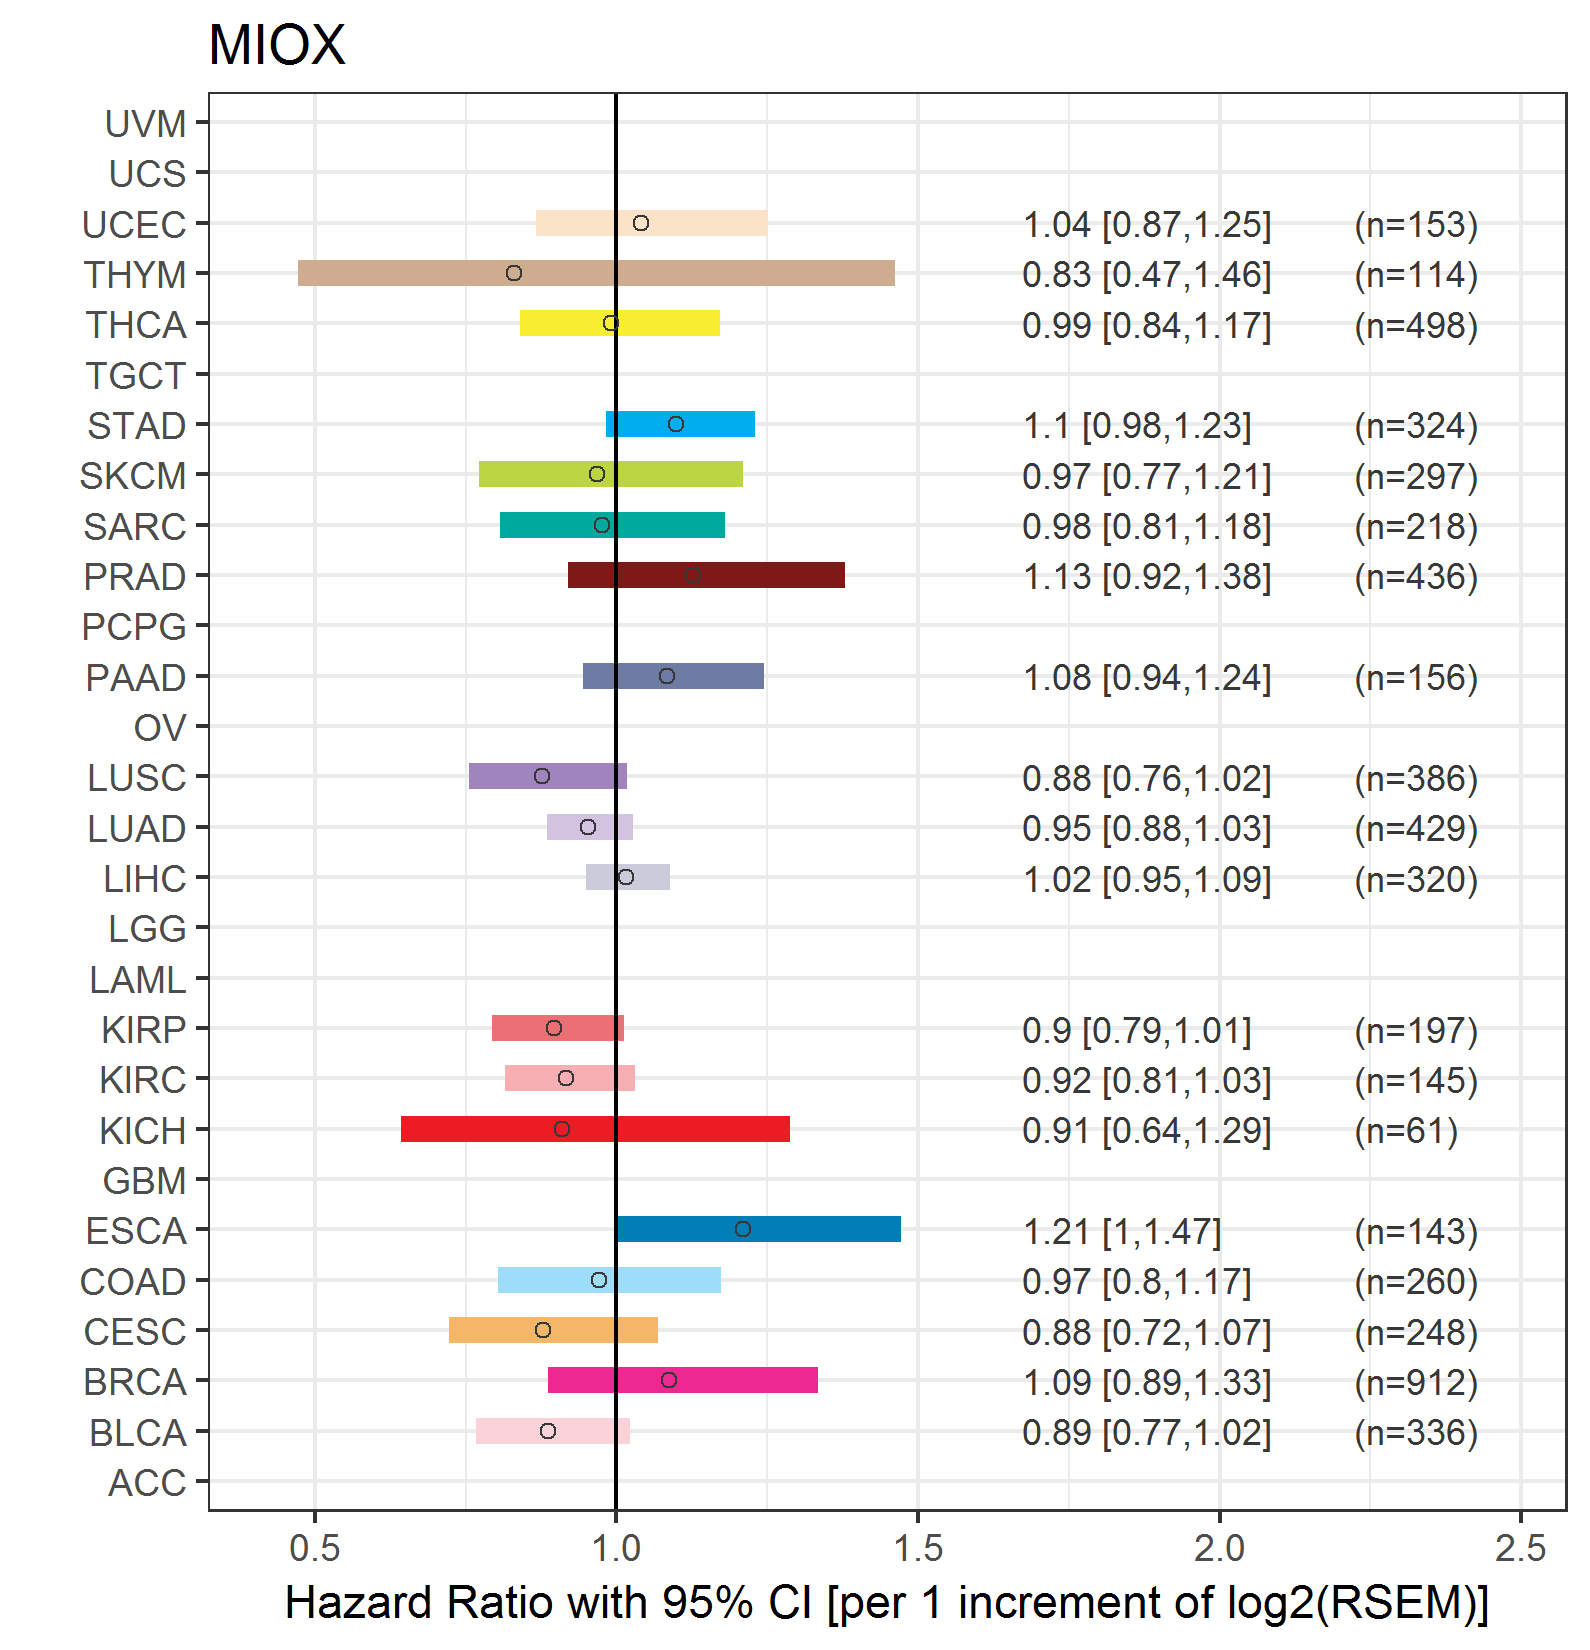 |
| Top |
| TissGeneClin for MIOX |
| TissGeneDrug for MIOX |
| Drug information targeting TissGene (DrugBank Version 5.0.6, 2017-04-01) |
| DrugBank ID | Drug name | Drug activity | Drug type | Drug status |
| Top |
| TissGeneDisease for MIOX |
| Disease information associated with TissGene (DisGeNet, 2016-06-01) |
| Disease ID | Disease name | # pubmeds | Source |
| umls:C0011849 | Diabetes Mellitus | 1 | BeFree |
| umls:C0011854 | Diabetes Mellitus, Insulin-Dependent | 1 | BeFree,GAD |
| umls:C0022660 | Kidney Failure, Acute | 1 | BeFree |
|
Copyright 2016-Present - The University of Texas Health Science Center at Houston (UTHealth) Web File Viewing | How to Report, Fraud, Waste and Abuse | State of Texas | Statewide Search | Texas Homeland Security | Site Policies |