 |
| |
| |
| |
| |
| |
| |
|

| TissGeneSummary for ALLC |
 Gene summary Gene summary |
| Basic gene information | Gene symbol | ALLC |
| Gene name | allantoicase | |
| Synonyms | ALC | |
| Cytomap | UCSC genome browser: 2q35 | |
| Type of gene | protein-coding | |
| RefGenes | NM_199232.1, NM_018436.3, | |
| Description | allantoate amidinohydrolaseprobable allantoicase | |
| Modification date | 20141207 | |
| dbXrefs | MIM : 612396 | |
| HGNC : HGNC | ||
| Ensembl : ENSG00000151360 | ||
| HPRD : 10642 | ||
| Vega : OTTHUMG00000151485 | ||
| Protein | UniProt: go to UniProt's Cross Reference DB Table | |
| Expression | CleanEX: HS_ALLC | |
| BioGPS: 55821 | ||
| Pathway | NCI Pathway Interaction Database: ALLC | |
| KEGG: ALLC | ||
| REACTOME: ALLC | ||
| Pathway Commons: ALLC | ||
| Context | iHOP: ALLC | |
| ligand binding site mutation search in PubMed: ALLC | ||
| UCL Cancer Institute: ALLC | ||
| Assigned class in TissGDB* | B | |
| Included tissue-specific gene expression resources | HPA,TiGER,GTEx | |
| Specific-tissues in normal samples (assigned by TissGDB using HPA, TiGER, and GTEx) | Testis | |
| Cancer types related to the specific-tissues in cancer samples (assigned by TissGDB using TCGA) | TGCT | |
| Reference showing the relevant tissue of ALLC | ||
| Description by TissGene annotations | Cancer gene | |
| * Class A consists of genes with literature evidence and is part of the cTissGenes. Class B consists of only cTissGenes without additional evidence. The remaining genes belong to Class C. |
| Gene ontology having evidence of Inferred from Direct Assay (IDA) from Entrez |
| GO ID | GO term | PubMed ID |
| Top |
| TissGeneExp for ALLC |
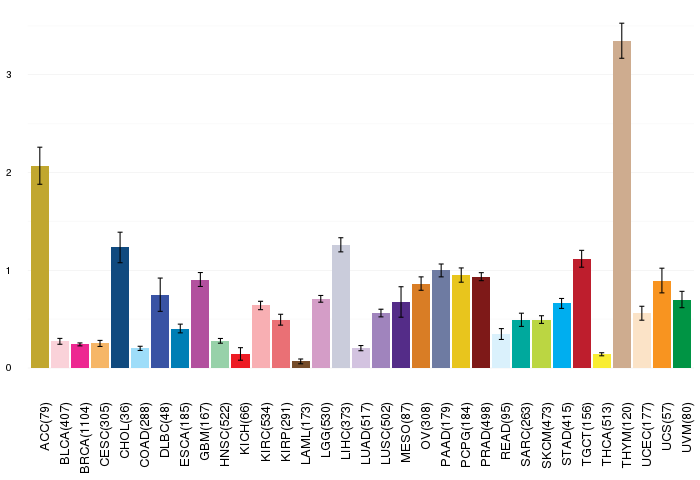
| Gene expressions across 28 cancer types (X-axis: cancer type and Y-axis: log2(norm_counts+1)) (TCGA IlluminaHiSeq_RNASeqV2, pan-cancer normalized log2(norm_counts+1) data, version 2016-08-16) |
 |
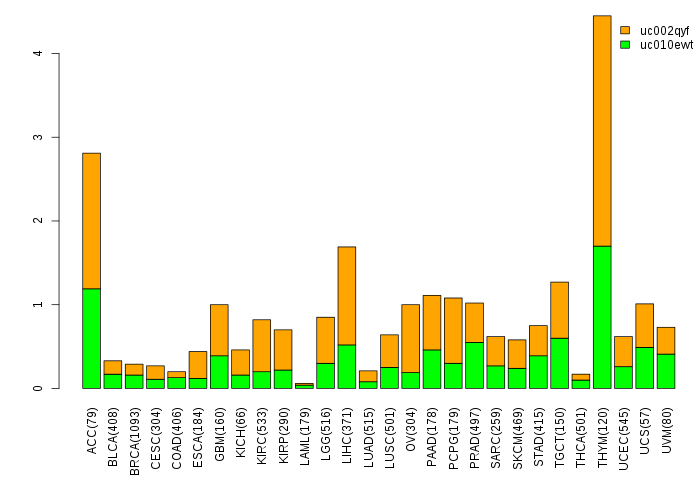
| Gene isoform expressions across 28 cancer types (X-axis: cancer type and Y-axis: log2(norm_counts+1)) (TCGA pan-cancer tcga_rsem_isoform_tpm, version 2016-09-01) |
 |
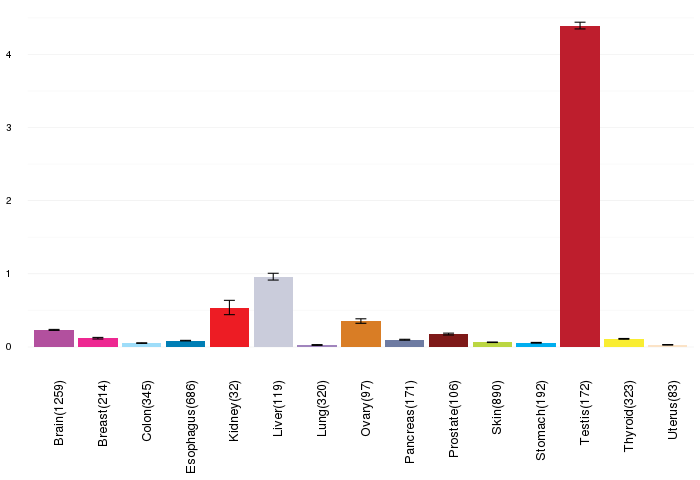
| Gene expressions across normal tissues of GTEx data (GTEx GTEx_Analysis_v6_RNA-seq_RNA-SeQCv1.1.8_gene_rpkm.gct) - Here, we shows the matched tissue types only among our 28 cancer types. |
 |
| Different expressions across 14 cancer types with more than 10 samples between matched tumors and normals (X-axis: cancer type and Y-axis: log2(norm_counts+1)) (TCGA IlluminaHiSeq_RNASeqV2, pan-cancer normalized log2(norm_counts+1) data, version 2016-08-16) |
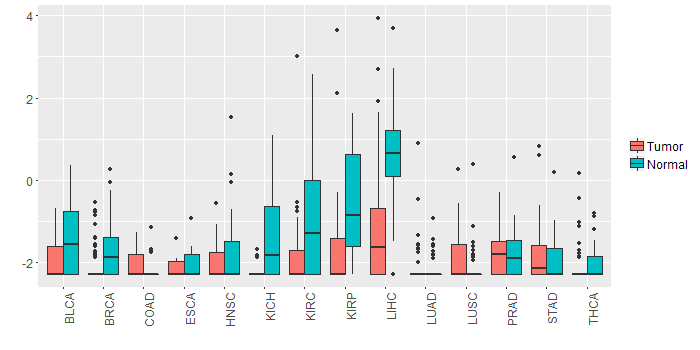 |
| - Significantly differentially expressed cancer types and information. (|Fold change|>1 and FDR<0.05) |
| Cancer type | Mean(exp) in tumor | Mean(exp) in matched normal | Log2FC | P-val. | FDR |
| LIHC | -1.178345758 | 0.717484242 | -1.89583 | 5.60E-11 | 7.53E-10 |
| Top |
| TissGene-miRNA for ALLC |
| Significantly anti-correlated miRNAs of TissGene across 28 cancer types (Gene-miRNA relations from TargetScanHuman Relsease 7.1, Conserved_Site_Context_Scores.txt.zip, 06.01.2016) (TCGA IlluminaHiSeq_miRNASeq, log2(RPM+1) data, version 2016-11-21) (TCGA IlluminaHiSeq_RNASeqV2, log2(normalized_count+1) data, version 2016-08-16) (Spearman’s Rank Correlation (p-value<0.05 and coefficient<-0.25)) |
| Cancer type | miRNA id | miRNA accession | P-val. | Coeff. | # samples |
| Top |
| TissGeneMut for ALLC |
| TissGeneSNV for ALLC |
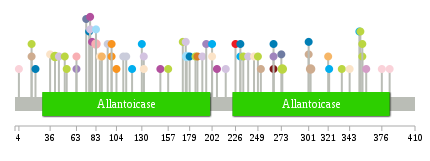
| nsSNV counts per each loci. Different colors of circles represent different cancer types. Circle size denotes number of samples. (TCGA somatic mutation (SNPs and small INDELs) data, version 2016-04-25) * Click on the image to enlarge it in a new window. |
 |
 |
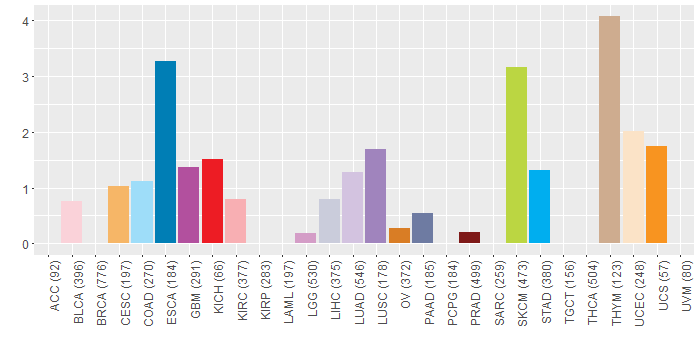
| Somatic nucleotide variants of TissGene across 28 cancer types (X-axis: cancer type and Y-axis: % of mutated samples) The numbers in parentheses are numbers of samples with mutation (nsSNVs). (TCGA somatic mutation (SNPs and small INDELs) data, version 2016-04-25) |
 |
| - nsSNVs sorted by frequency. |
| AAchange | Cancer type | # samples |
| p.R274Q | SKCM | 2 |
| p.R176Q | COAD | 2 |
| p.E41K | SKCM | 2 |
| p.E303D | THYM | 2 |
| p.T83M | KIRC | 2 |
| p.T83R | HNSC | 1 |
| p.I245L | UCEC | 1 |
| p.R265P | ESCA | 1 |
| p.V77M | LUAD | 1 |
| p.R53K | SKCM | 1 |
| p.C207F | GBM | 1 |
| p.G149D | GBM | 1 |
| p.P322S | STAD | 1 |
| p.R73Q | PAAD | 1 |
| p.R111G | LIHC | 1 |
| p.D76N | ESCA | 1 |
| p.D249N | SKCM | 1 |
| p.G252C | THYM | 1 |
| p.E99* | UCS | 1 |
| p.G216V | LUAD | 1 |
| p.V63A | KIRC | 1 |
| p.D335N | SKCM | 1 |
| p.G144E | HNSC | 1 |
| p.R89G | CESC | 1 |
| p.R265* | PRAD | 1 |
| p.G226E | KICH | 1 |
| p.E36* | UCEC | 1 |
| p.R265* | LUSC | 1 |
| p.W234G | SKCM | 1 |
| p.K185N | SKCM | 1 |
| p.A95V | LIHC | 1 |
| p.A21V | ESCA | 1 |
| p.E99X | UCS | 1 |
| p.P322S | HNSC | 1 |
| p.T83M | COAD | 1 |
| p.L321F | CESC | 1 |
| p.S384L | BLCA | 1 |
| p.V79I | GBM | 1 |
| p.S157F | SKCM | 1 |
| p.A196S | LUSC | 1 |
| p.G356R | SKCM | 1 |
| p.E120A | STAD | 1 |
| p.A4V | BLCA | 1 |
| p.T51I | SKCM | 1 |
| p.R376Q | BLCA | 1 |
| p.A231V | ESCA | 1 |
| p.A114V | LIHC | 1 |
| p.R360H | LGG | 1 |
| p.A231T | STAD | 1 |
| p.G172S | SKCM | 1 |
| p.P354S | SKCM | 1 |
| p.D17N | SKCM | 1 |
| p.A175T | LUAD | 1 |
| p.W187F | OV | 1 |
| p.T273P | PAAD | 1 |
| p.D355N | READ | 1 |
| p.A87T | UCEC | 1 |
| p.I277M | DLBC | 1 |
| p.D17Y | THYM | 1 |
| p.A202T | UCEC | 1 |
| p.D130H | STAD | 1 |
| p.R239M | LUAD | 1 |
| p.P192T | LUAD | 1 |
| p.W45* | LUAD | 1 |
| p.V353F | STAD | 1 |
| p.V179L | ESCA | 1 |
| p.V77M | GBM | 1 |
| p.V63F | LUSC | 1 |
| p.V353I | HNSC | 1 |
| p.A267S | CHOL | 1 |
| p.E301Q | THYM | 1 |
| p.D343Y | UCEC | 1 |
| p.G356E | SKCM | 1 |
| p.W132R | LUAD | 1 |
| p.E301Q | ESCA | 1 |
| p.W132R | UCEC | 1 |
| p.A202T | STAD | 1 |
| p.E104D | UCS | 1 |
| Top |
| TissGeneCNV for ALLC |
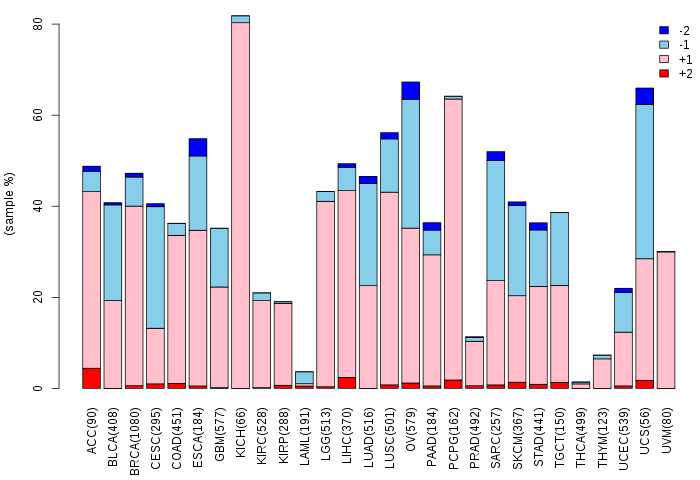
| Copy number variations of TissGene across 28 cancer types (X-axis: cancer type and Y-axis: % of CNV samples) (TCGA Gistic2_CopyNumber_Gistic2_all_data_by_genes, Gistic2 copy number data, version 2016-08-16) |
 |
| Top |
| TissGeneFusions for ALLC |
| Fusion genes including TissGene (ChimerDB 3.0, 2016-12-01 and TCGA fusion Portal 2015-12-01) |
| Database | Src | Cancer type | Sample | Fusion gene | ORF | 5'-gene BP | 3'-gene BP |
| Top |
| TissGeneNet for ALLC |
| Co-expressed gene networks based on protein-protein interaction data (CePIN) (TCGA IlluminaHiSeq_RNASeqV2, pan-cancer normalized log2(norm_counts+1) data, version 2016-08-16) (PINA2 ppi data) |
| Top |
| TissGeneProg for ALLC |
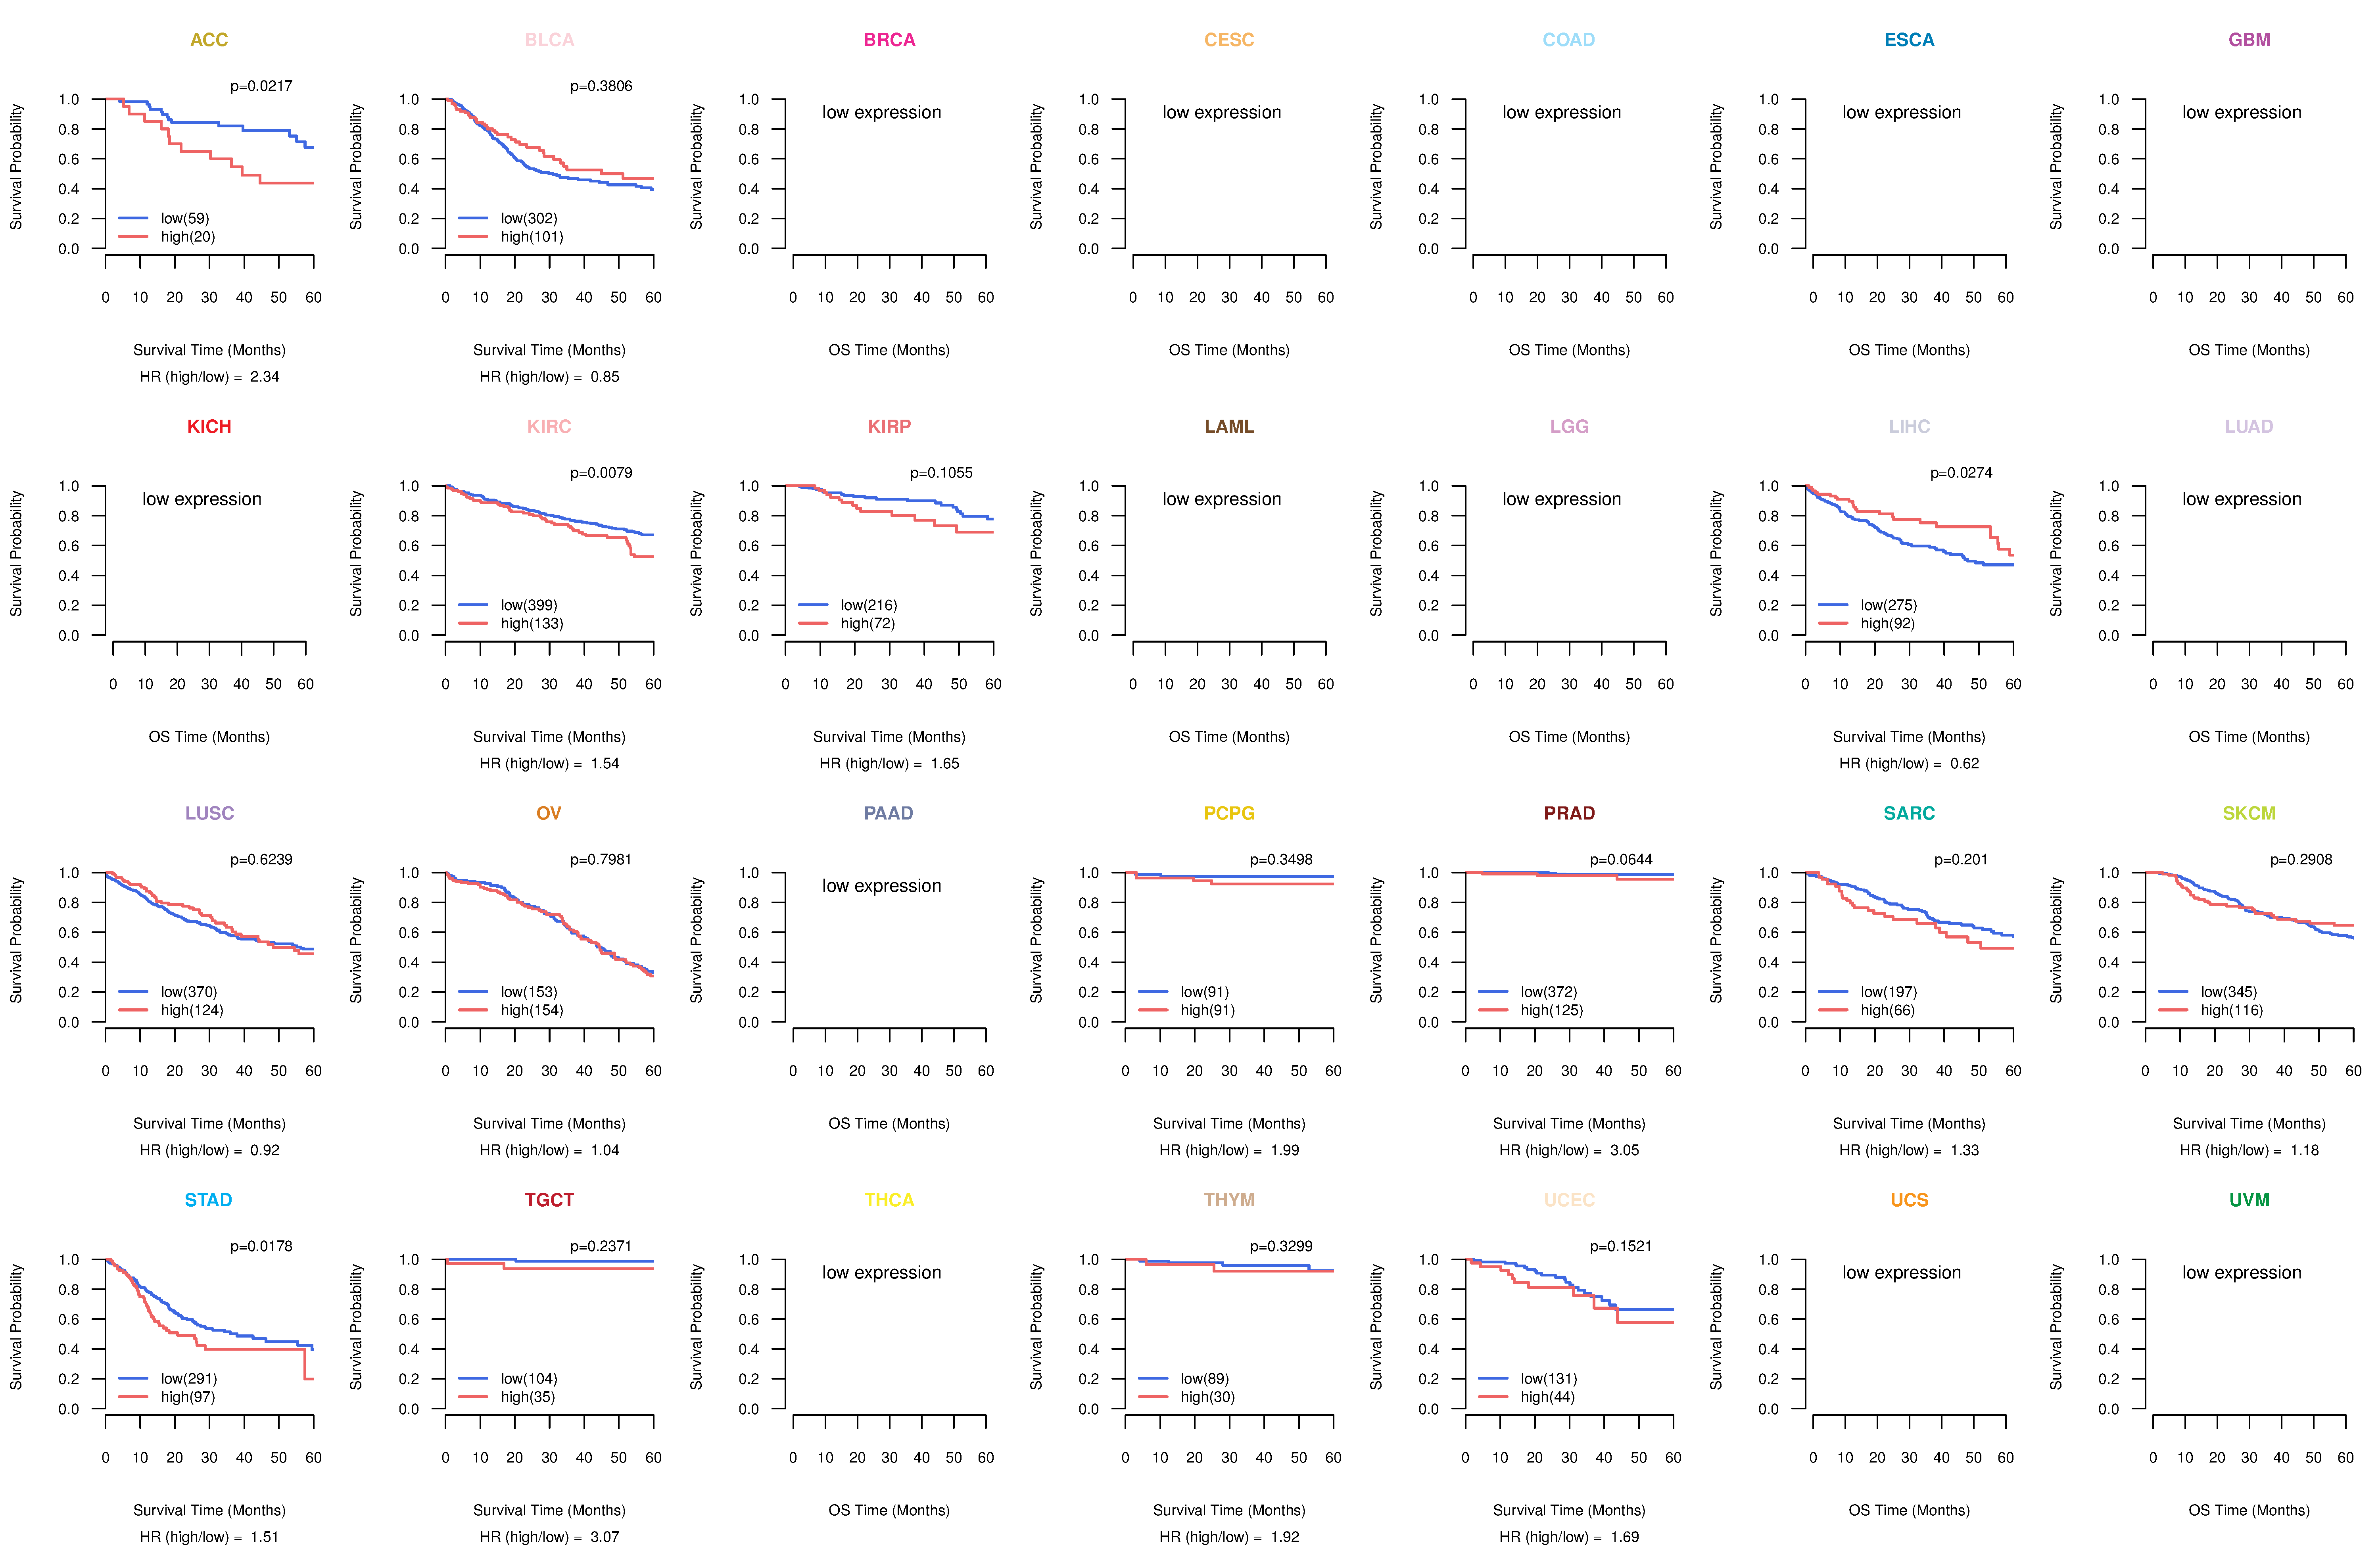
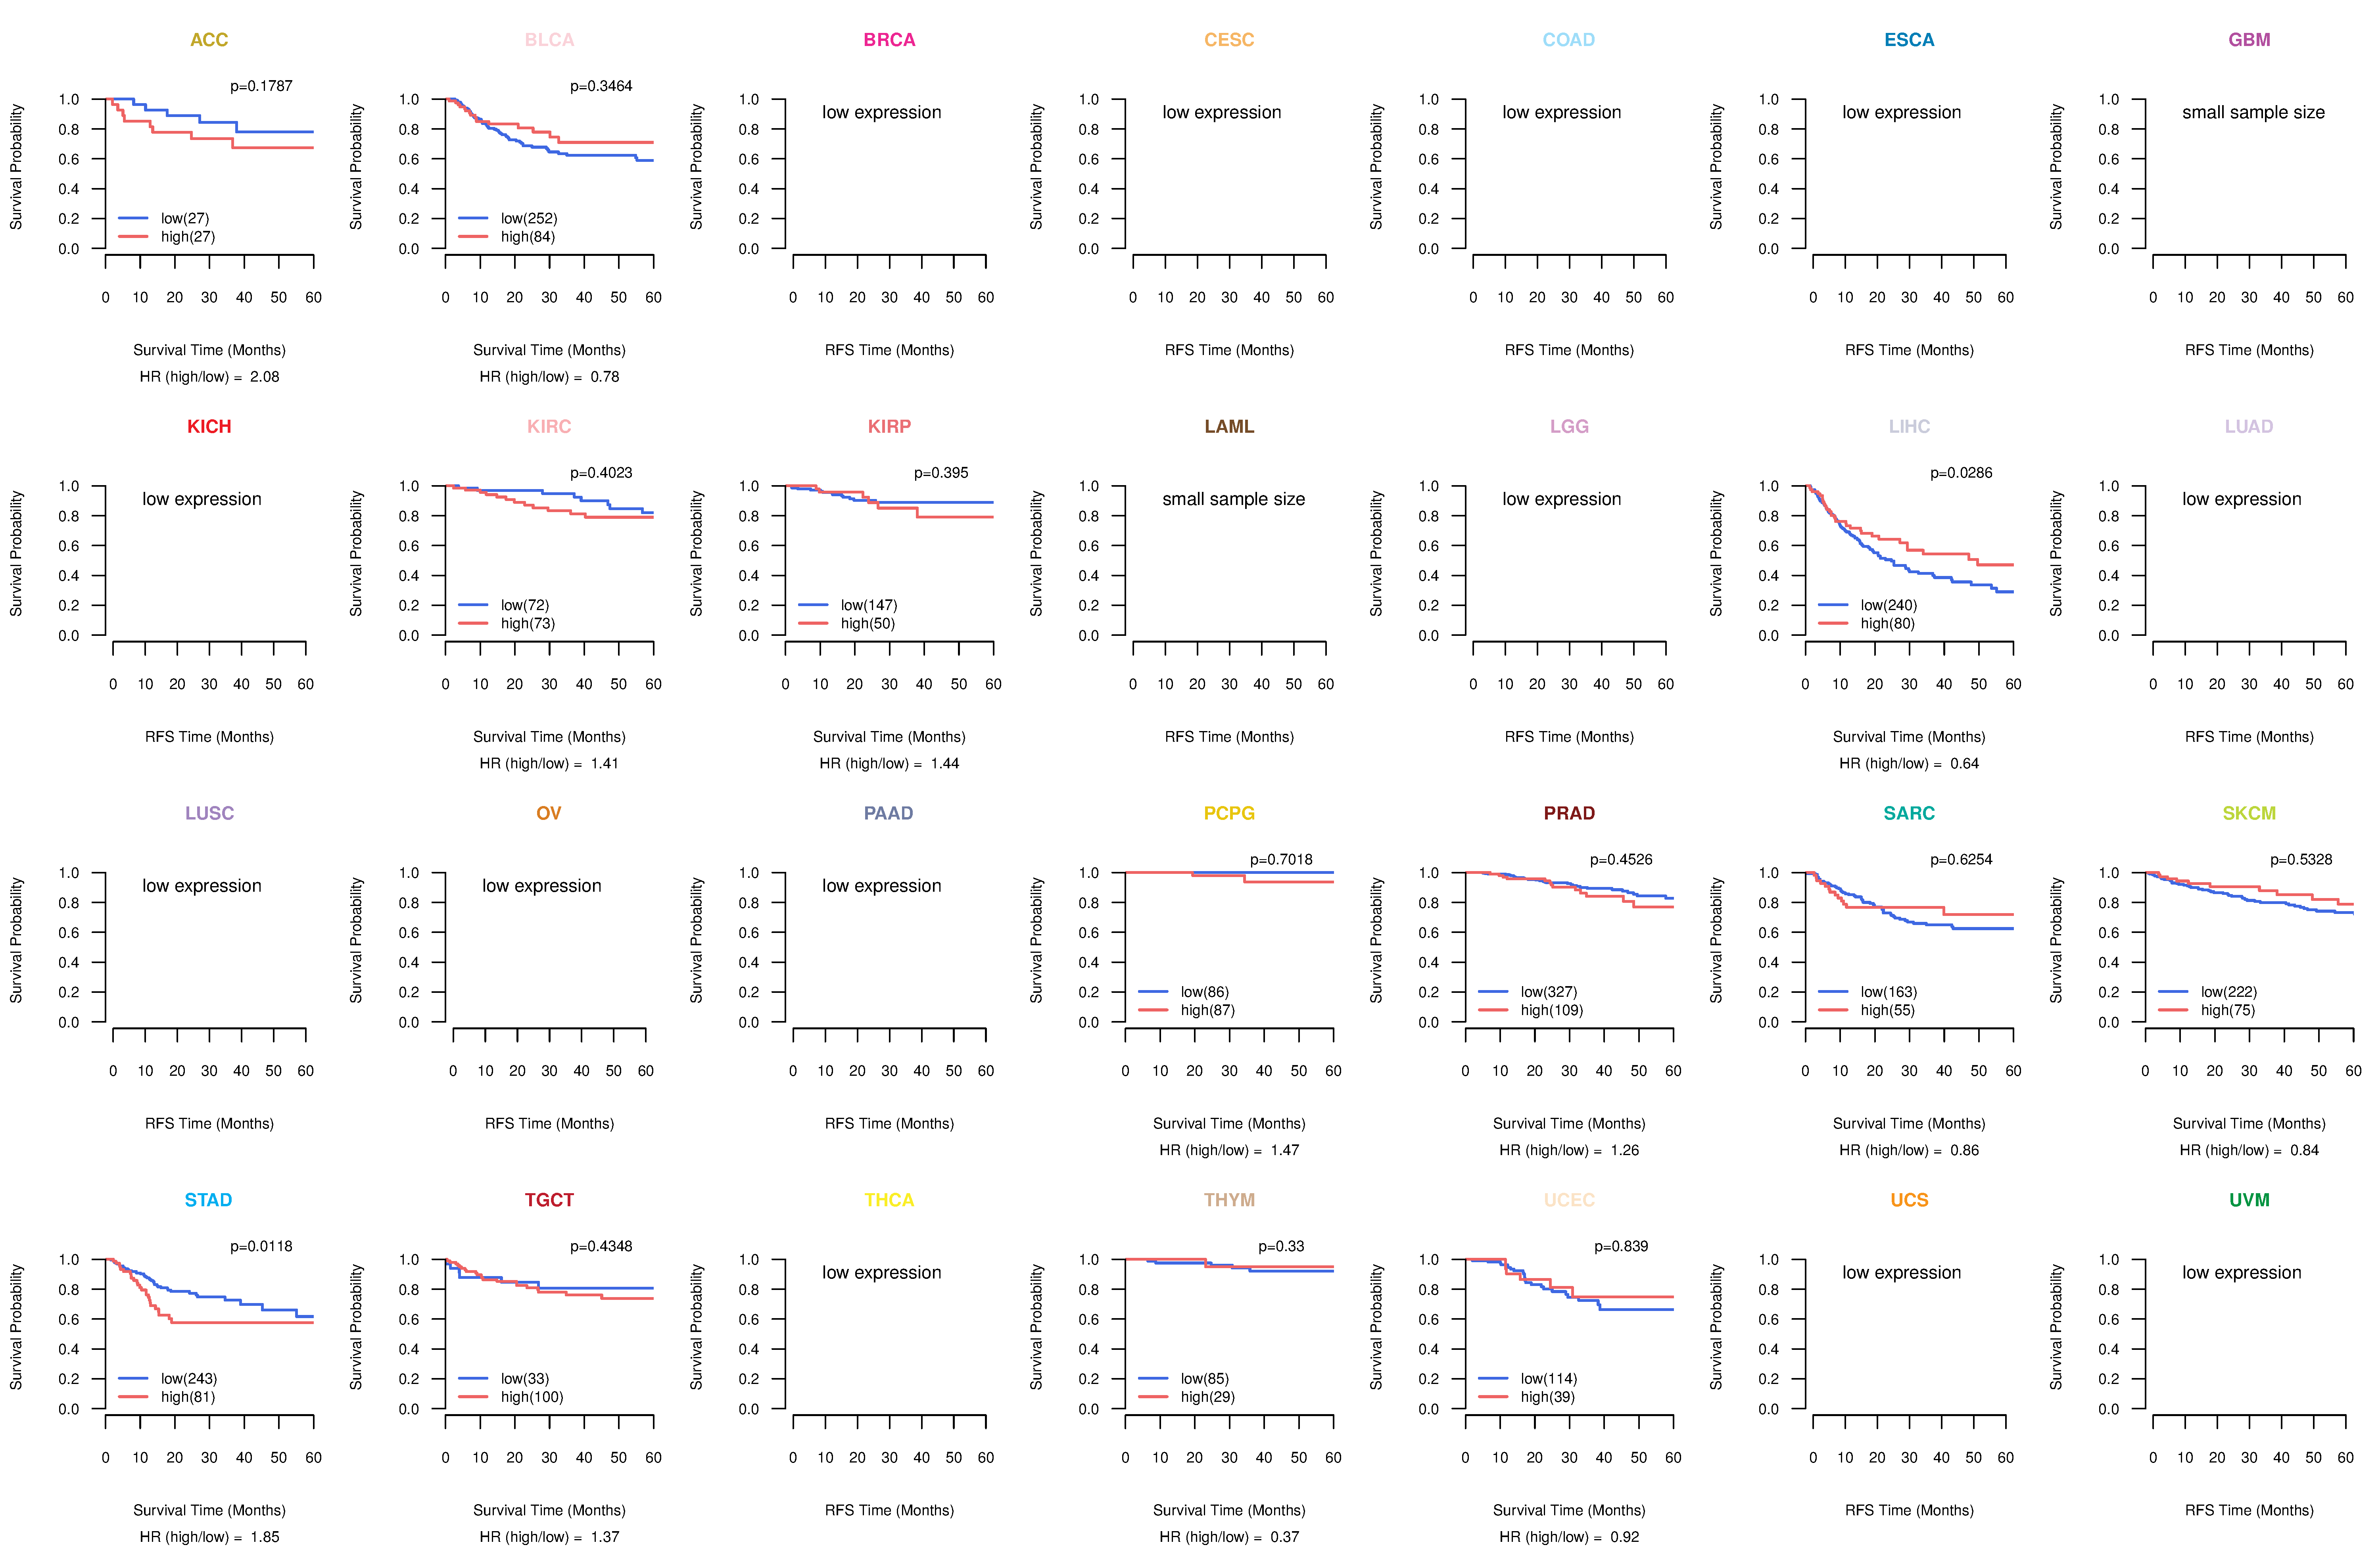
| Kaplan-Meier plots with logrank tests of overall survival (OS) using 28 cancer types (TCGA IlluminaHiSeq_RNASeqV2, pan-cancer normalized log2(norm_counts+1) data, version 2016-08-16) (TCGA clinicalMatrix, phenotype data, version 2016-04-27) * Click on the image to enlarge it in a new window. |
 |
| Kaplan-Meier plots with logrank test of relapse free survival (RFS) using 28 cancer types (TCGA IlluminaHiSeq_RNASeqV2, pan-cancer normalized log2(norm_counts+1) data, version 2016-08-16) (TCGA clinicalMatrix, phenotype data, version 2016-04-27) * Click on the image enlarge it in a new window. |
 |
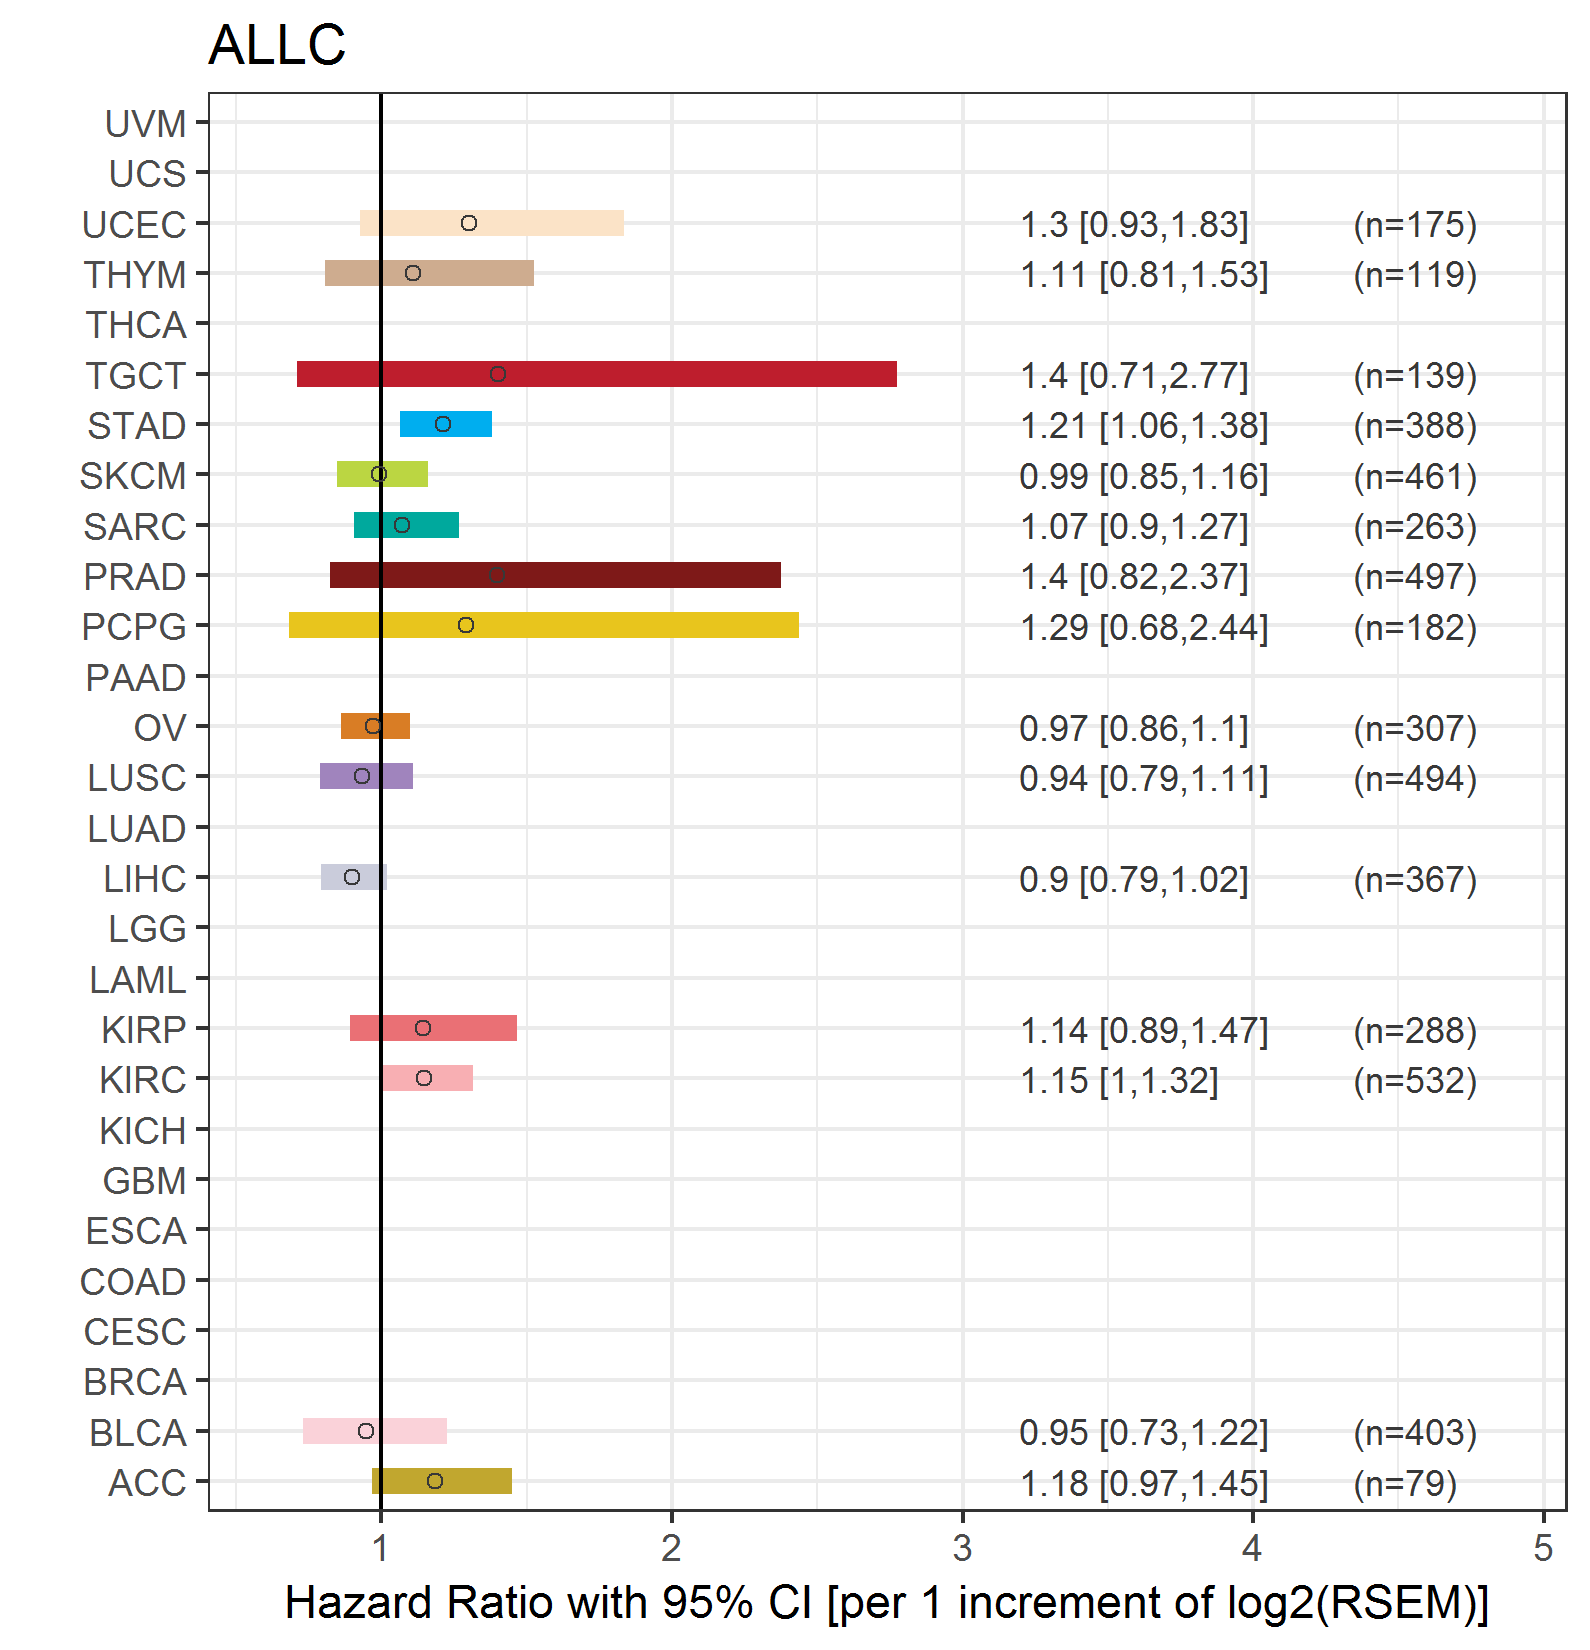
| Forest plot of Cox proportional hazard ratio (HR) and 95% CI of overall survival (OS) using 28 cancer types (TCGA IlluminaHiSeq_RNASeqV2, pan-cancer normalized log2(norm_counts+1) data, version 2016-08-16) (TCGA clinicalMatrix, phenotype data, version 2016-04-27) * Click on the image enlarge it in a new window. |
 |
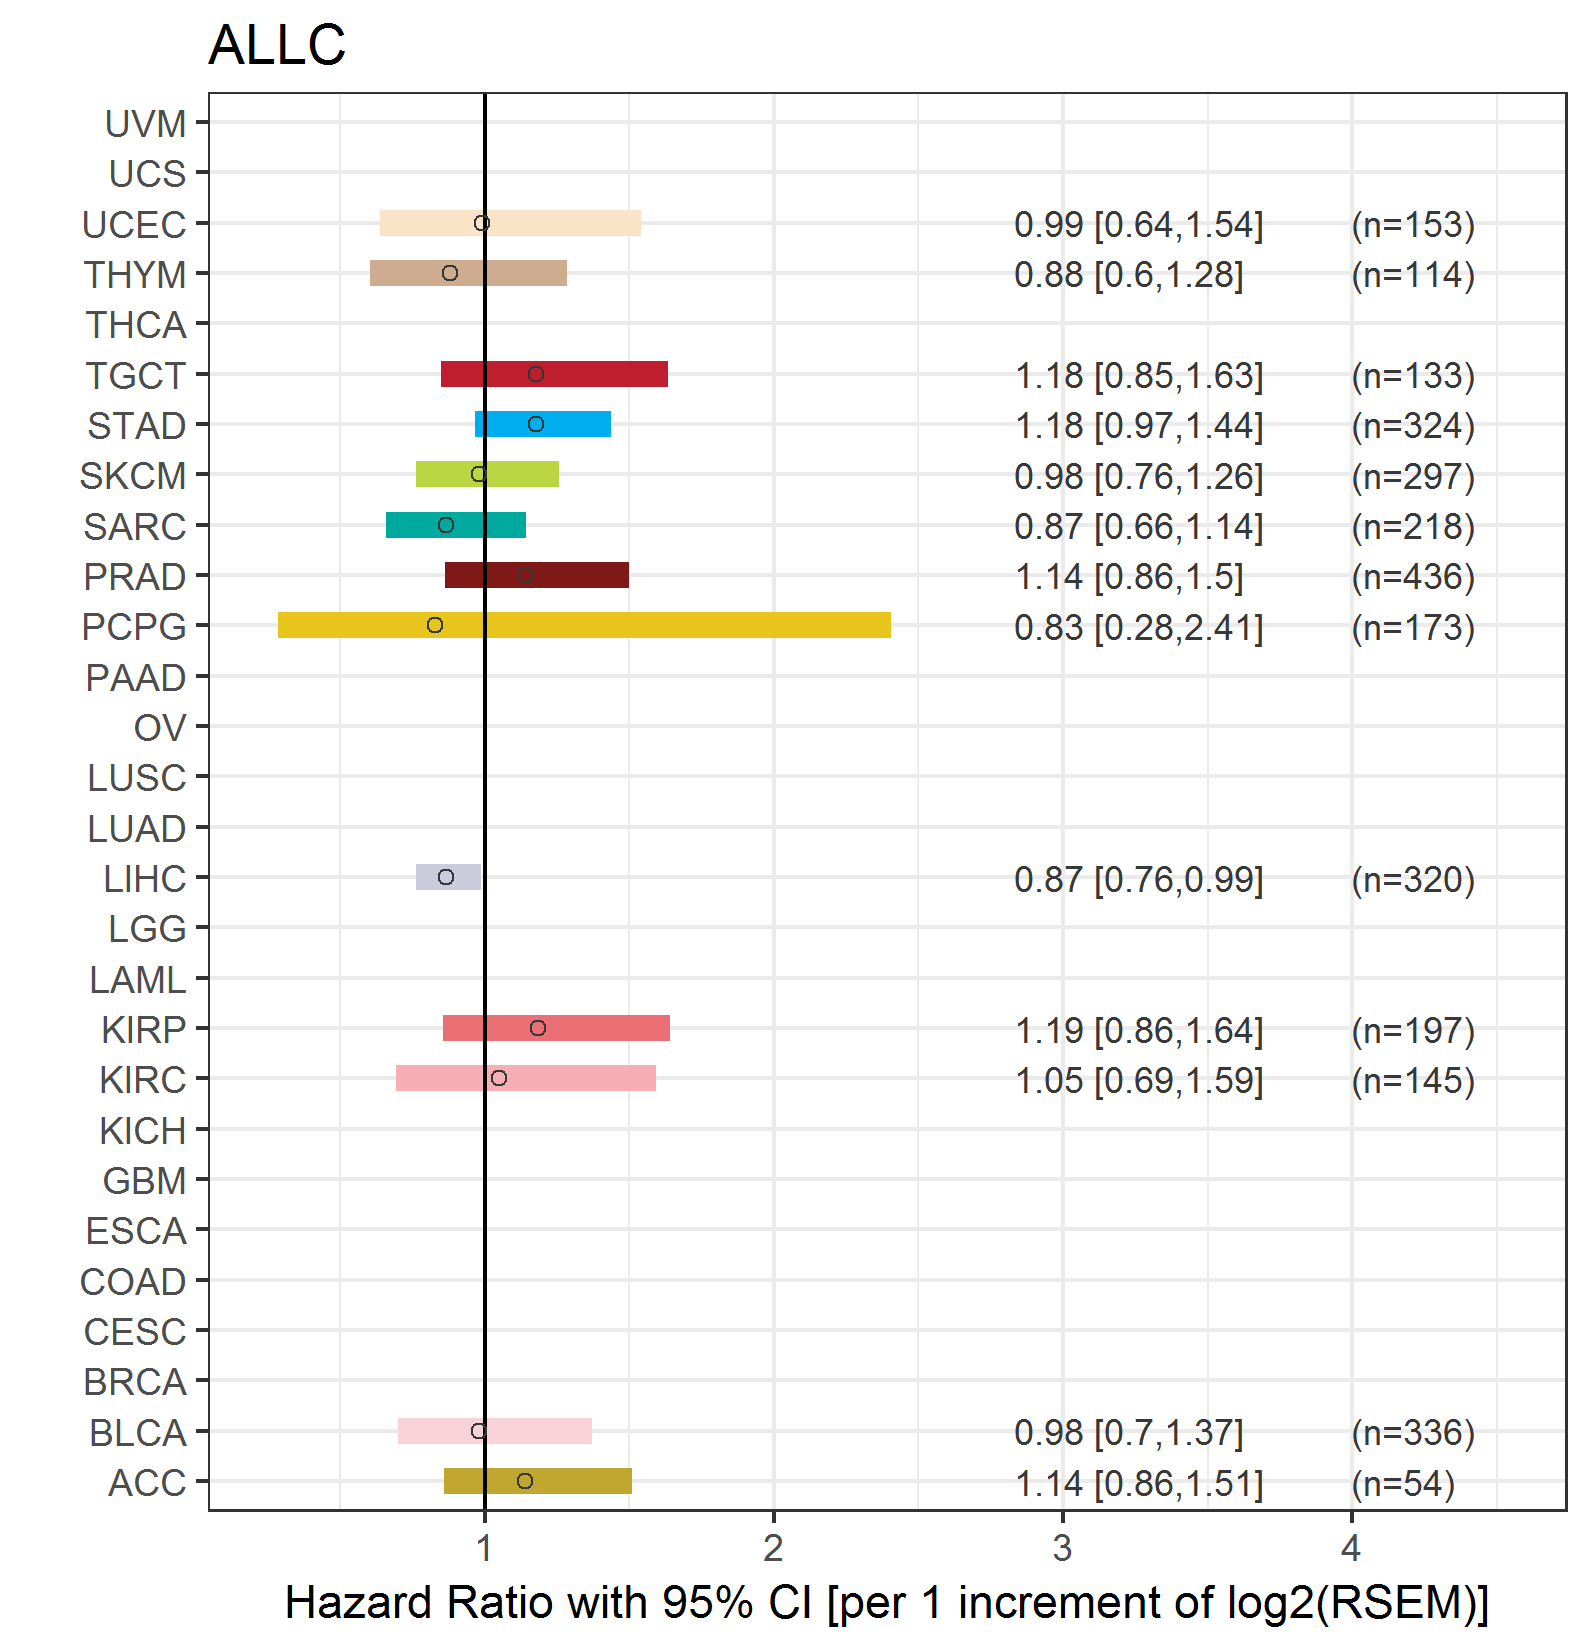
| Forest plot of Cox proportional hazard ratio (HR) and 95% CI of relapse free survival (RFS) using 28 cancer types (TCGA IlluminaHiSeq_RNASeqV2, pan-cancer normalized log2(norm_counts+1) data, version 2016-08-16) (TCGA clinicalMatrix, phenotype data, version 2016-04-27) * Click on the image enlarge it in a new window. |
 |
| Top |
| TissGeneClin for ALLC |
| TissGeneDrug for ALLC |
| Drug information targeting TissGene (DrugBank Version 5.0.6, 2017-04-01) |
| DrugBank ID | Drug name | Drug activity | Drug type | Drug status |
| Top |
| TissGeneDisease for ALLC |
| Disease information associated with TissGene (DisGeNet, 2016-06-01) |
| Disease ID | Disease name | # pubmeds | Source |
| umls:C0001973 | Alcoholic Intoxication, Chronic | 7 | BeFree |
| umls:C0233523 | Antisocial behavior | 4 | BeFree |
| umls:C0003431 | Antisocial Personality Disorder | 3 | BeFree |
| umls:C0024299 | Lymphoma | 3 | BeFree |
| umls:C0338908 | Mixed anxiety and depressive disorder | 2 | BeFree |
| umls:C0004096 | Asthma | 1 | BeFree |
| umls:C0011849 | Diabetes Mellitus | 1 | BeFree |
| umls:C0019693 | HIV Infections | 1 | BeFree |
| umls:C0020981 | Angioimmunoblastic Lymphadenopathy | 1 | BeFree |
| umls:C0023434 | Chronic Lymphocytic Leukemia | 1 | BeFree |
| umls:C0023890 | Liver Cirrhosis | 1 | BeFree |
| umls:C0025202 | melanoma | 1 | BeFree |
| umls:C0206180 | Ki-1+ Anaplastic Large Cell Lymphoma | 1 | BeFree |
| umls:C0400966 | Non-alcoholic Fatty Liver Disease | 1 | BeFree |
|
Copyright 2016-Present - The University of Texas Health Science Center at Houston (UTHealth) Web File Viewing | How to Report, Fraud, Waste and Abuse | State of Texas | Statewide Search | Texas Homeland Security | Site Policies |