 |
| |
| |
| |
| |
| |
| |
|

| TissGeneSummary for APOM |
 Gene summary Gene summary |
| Basic gene information | Gene symbol | APOM |
| Gene name | apolipoprotein M | |
| Synonyms | G3a|HSPC336|NG20|apo-M | |
| Cytomap | UCSC genome browser: 6p21.33 | |
| Type of gene | protein-coding | |
| RefGenes | NM_001256169.1, NM_019101.2,NR_045828.1, | |
| Description | NG20-like proteinalternative name: G3a, NG20protein G3a | |
| Modification date | 20141207 | |
| dbXrefs | MIM : 606907 | |
| HGNC : HGNC | ||
| Ensembl : ENSG00000204444 | ||
| HPRD : 06068 | ||
| Vega : OTTHUMG00000031250 | ||
| Protein | UniProt: go to UniProt's Cross Reference DB Table | |
| Expression | CleanEX: HS_APOM | |
| BioGPS: 55937 | ||
| Pathway | NCI Pathway Interaction Database: APOM | |
| KEGG: APOM | ||
| REACTOME: APOM | ||
| Pathway Commons: APOM | ||
| Context | iHOP: APOM | |
| ligand binding site mutation search in PubMed: APOM | ||
| UCL Cancer Institute: APOM | ||
| Assigned class in TissGDB* | C | |
| Included tissue-specific gene expression resources | TiGER,GTEx | |
| Specific-tissues in normal samples (assigned by TissGDB using HPA, TiGER, and GTEx) | Liver | |
| Cancer types related to the specific-tissues in cancer samples (assigned by TissGDB using TCGA) | LIHC | |
| Reference showing the relevant tissue of APOM | ||
| Description by TissGene annotations | ||
| * Class A consists of genes with literature evidence and is part of the cTissGenes. Class B consists of only cTissGenes without additional evidence. The remaining genes belong to Class C. |
| Gene ontology having evidence of Inferred from Direct Assay (IDA) from Entrez |
| GO ID | GO term | PubMed ID | GO:0033344 | cholesterol efflux | 16682745 | GO:0034445 | negative regulation of plasma lipoprotein particle oxidation | 16682745 | GO:0033344 | cholesterol efflux | 16682745 | GO:0034445 | negative regulation of plasma lipoprotein particle oxidation | 16682745 |
| Top |
| TissGeneExp for APOM |
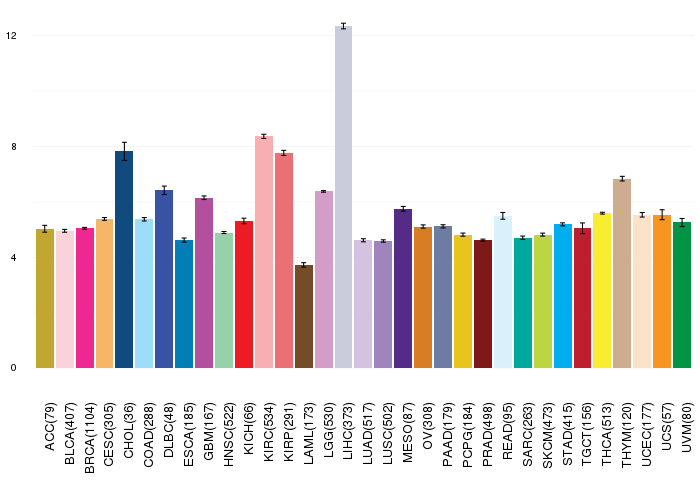
| Gene expressions across 28 cancer types (X-axis: cancer type and Y-axis: log2(norm_counts+1)) (TCGA IlluminaHiSeq_RNASeqV2, pan-cancer normalized log2(norm_counts+1) data, version 2016-08-16) |
 |
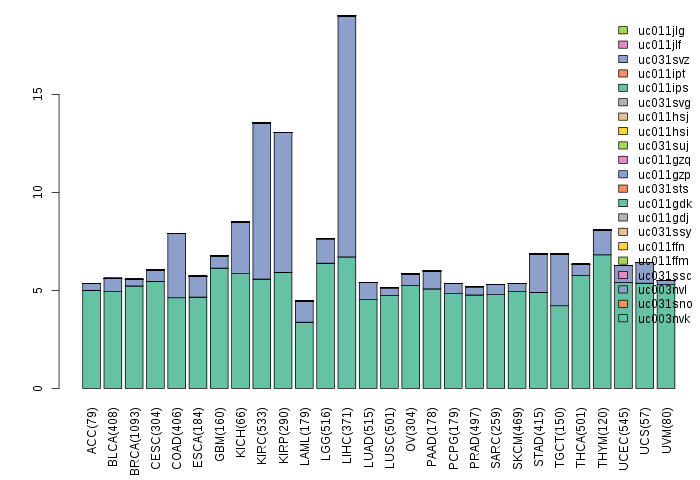
| Gene isoform expressions across 28 cancer types (X-axis: cancer type and Y-axis: log2(norm_counts+1)) (TCGA pan-cancer tcga_rsem_isoform_tpm, version 2016-09-01) |
 |
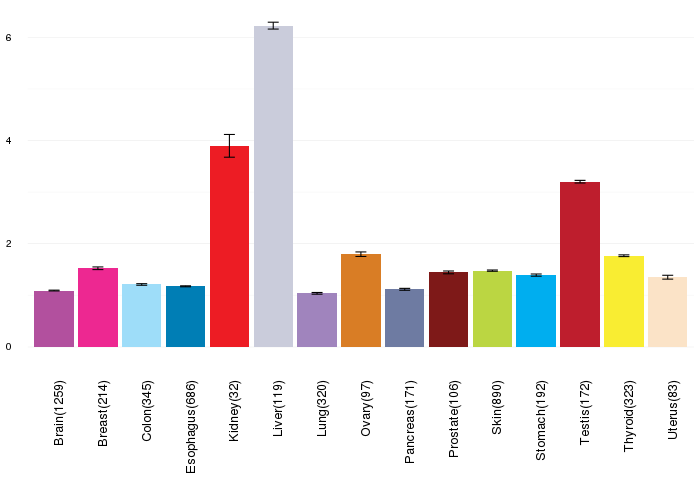
| Gene expressions across normal tissues of GTEx data (GTEx GTEx_Analysis_v6_RNA-seq_RNA-SeQCv1.1.8_gene_rpkm.gct) - Here, we shows the matched tissue types only among our 28 cancer types. |
 |
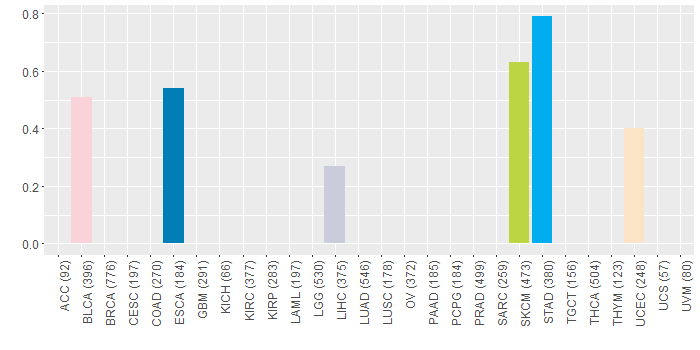
| Different expressions across 14 cancer types with more than 10 samples between matched tumors and normals (X-axis: cancer type and Y-axis: log2(norm_counts+1)) (TCGA IlluminaHiSeq_RNASeqV2, pan-cancer normalized log2(norm_counts+1) data, version 2016-08-16) |
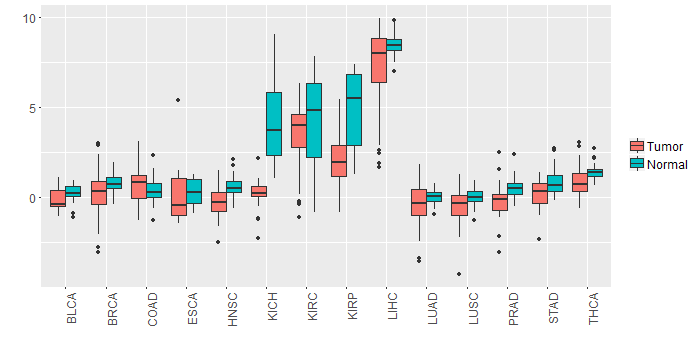 |
| - Significantly differentially expressed cancer types and information. (|Fold change|>1 and FDR<0.05) |
| Cancer type | Mean(exp) in tumor | Mean(exp) in matched normal | Log2FC | P-val. | FDR |
| KIRP | 2.169278999 | 4.967160249 | -2.79788125 | 7.99E-08 | 4.91E-07 |
| KICH | 0.195536874 | 3.993256874 | -3.79772 | 2.21E-09 | 1.29E-08 |
| LIHC | 7.184684874 | 8.495892874 | -1.311208 | 0.000149 | 0.000493924 |
| Top |
| TissGene-miRNA for APOM |
| Significantly anti-correlated miRNAs of TissGene across 28 cancer types (Gene-miRNA relations from TargetScanHuman Relsease 7.1, Conserved_Site_Context_Scores.txt.zip, 06.01.2016) (TCGA IlluminaHiSeq_miRNASeq, log2(RPM+1) data, version 2016-11-21) (TCGA IlluminaHiSeq_RNASeqV2, log2(normalized_count+1) data, version 2016-08-16) (Spearman’s Rank Correlation (p-value<0.05 and coefficient<-0.25)) |
| Cancer type | miRNA id | miRNA accession | P-val. | Coeff. | # samples |
| Top |
| TissGeneMut for APOM |
| TissGeneSNV for APOM |
| nsSNV counts per each loci. Different colors of circles represent different cancer types. Circle size denotes number of samples. (TCGA somatic mutation (SNPs and small INDELs) data, version 2016-04-25) * Click on the image to enlarge it in a new window. |
 |
 |
| Somatic nucleotide variants of TissGene across 28 cancer types (X-axis: cancer type and Y-axis: % of mutated samples) The numbers in parentheses are numbers of samples with mutation (nsSNVs). (TCGA somatic mutation (SNPs and small INDELs) data, version 2016-04-25) |
 |
| - nsSNVs sorted by frequency. |
| AAchange | Cancer type | # samples |
| p.G14S | SKCM | 1 |
| p.P65S | SKCM | 1 |
| p.E184D | ESCA | 1 |
| p.R85C | BLCA | 1 |
| p.V158M | STAD | 1 |
| p.R89L | UCEC | 1 |
| p.N116S | READ | 1 |
| p.Q28P | LIHC | 1 |
| p.M90I | SKCM | 1 |
| p.P65H | STAD | 1 |
| p.R143H | STAD | 1 |
| p.F144C | BLCA | 1 |
| Top |
| TissGeneCNV for APOM |
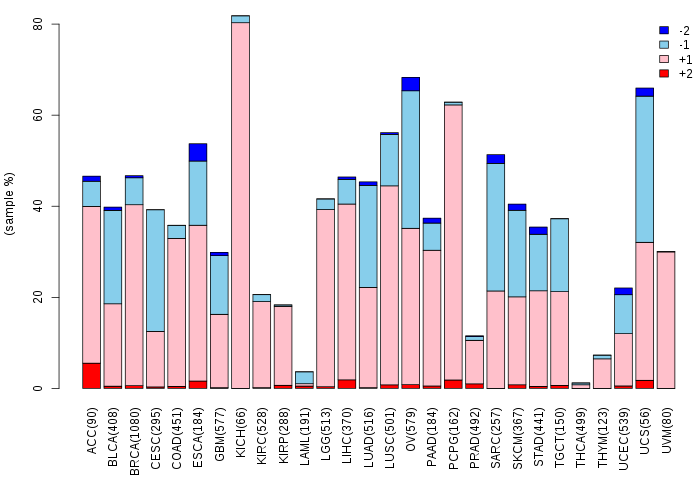
| Copy number variations of TissGene across 28 cancer types (X-axis: cancer type and Y-axis: % of CNV samples) (TCGA Gistic2_CopyNumber_Gistic2_all_data_by_genes, Gistic2 copy number data, version 2016-08-16) |
 |
| Top |
| TissGeneFusions for APOM |
| Fusion genes including TissGene (ChimerDB 3.0, 2016-12-01 and TCGA fusion Portal 2015-12-01) |
| Database | Src | Cancer type | Sample | Fusion gene | ORF | 5'-gene BP | 3'-gene BP |
| Chimerdb3.0 | FusionScan | BRCA | TCGA-BH-A18L-01A | MYSM1-APOM | CDS-3'UTR | chr1:59160800 | chr6:31624248 |
| TCGAfusionPortal | PRADA | BRCA | TCGA-BH-A18L-01A | MYSM1-APOM | In-frame | Chr1:59160801 | Chr6:31624249 |
| Top |
| TissGeneNet for APOM |
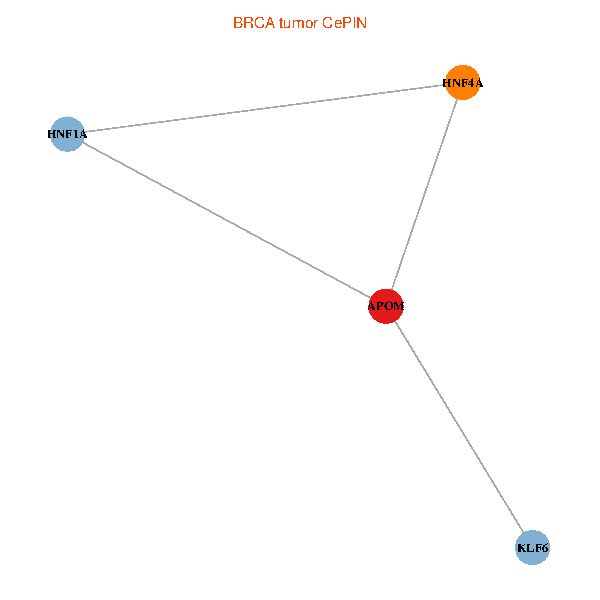
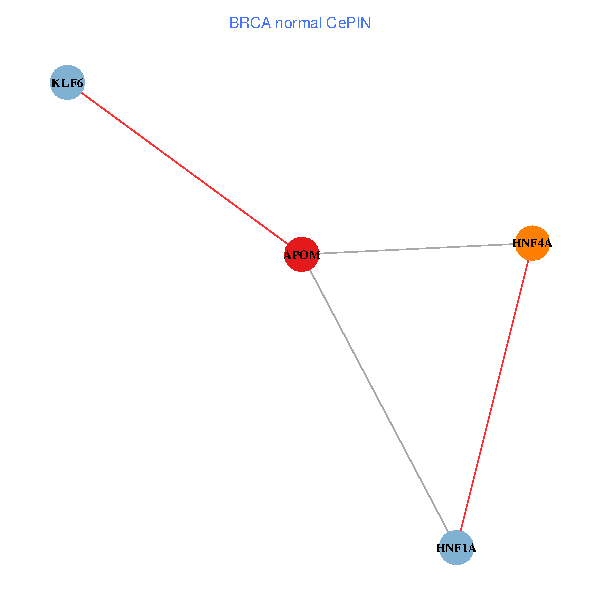
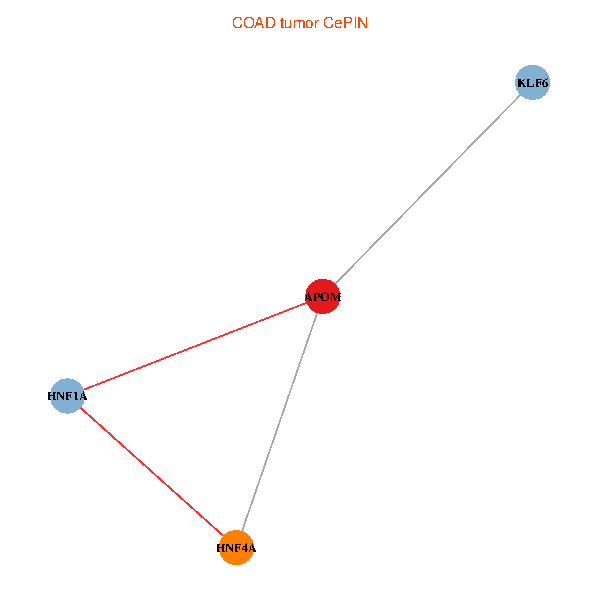
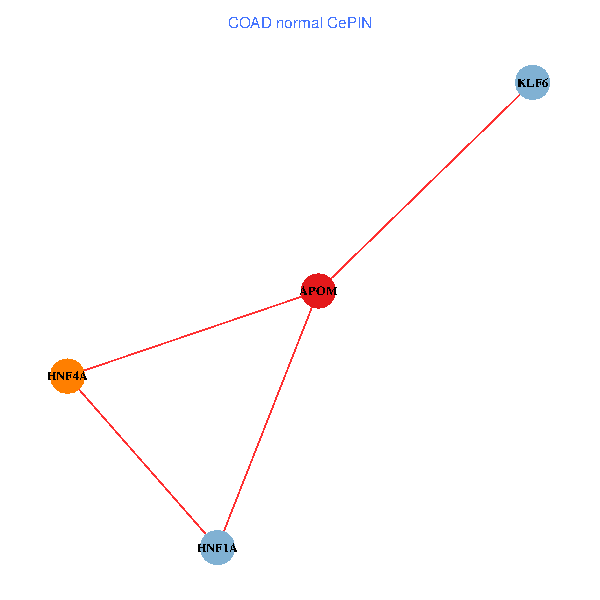
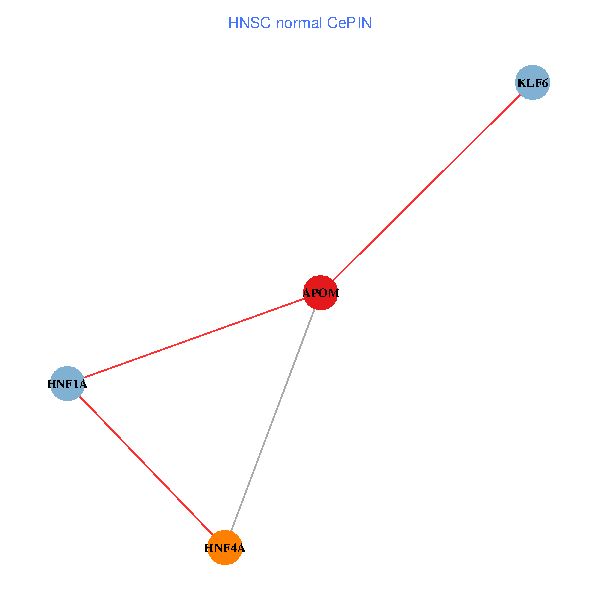
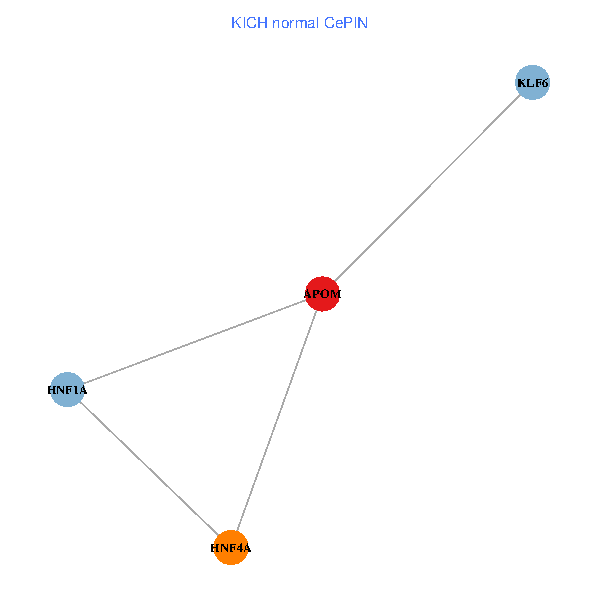
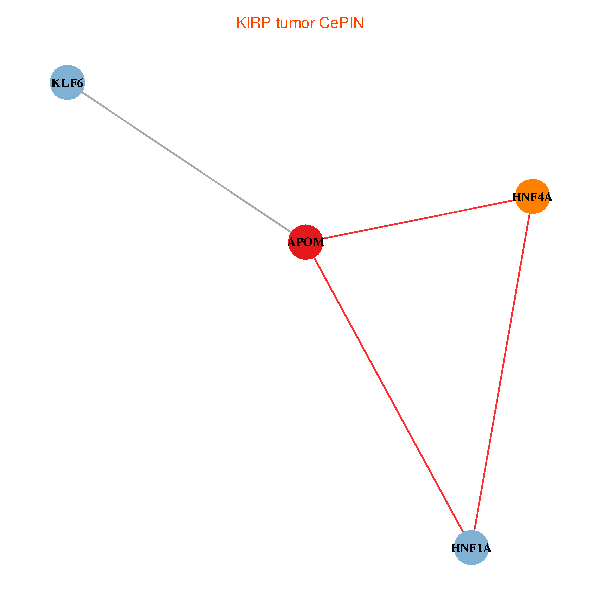
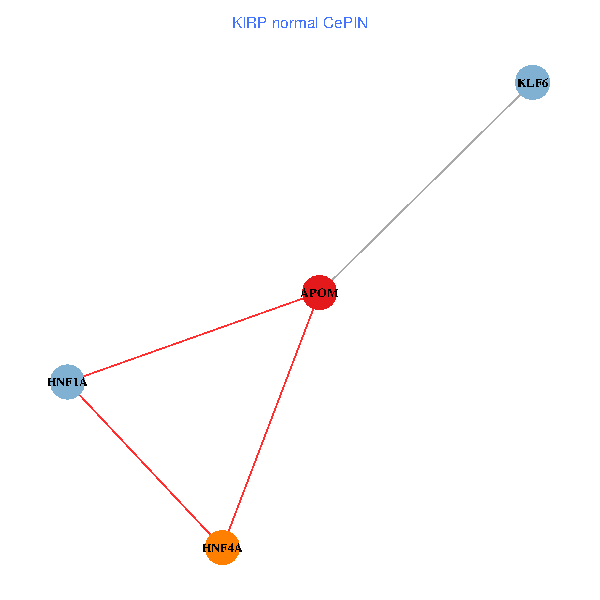
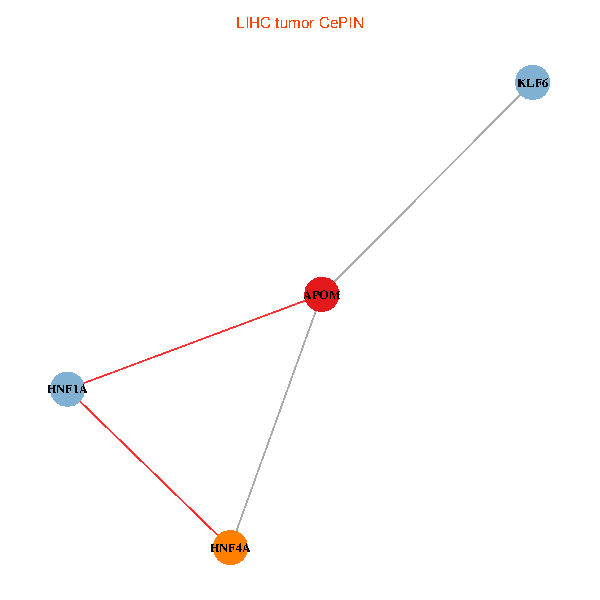
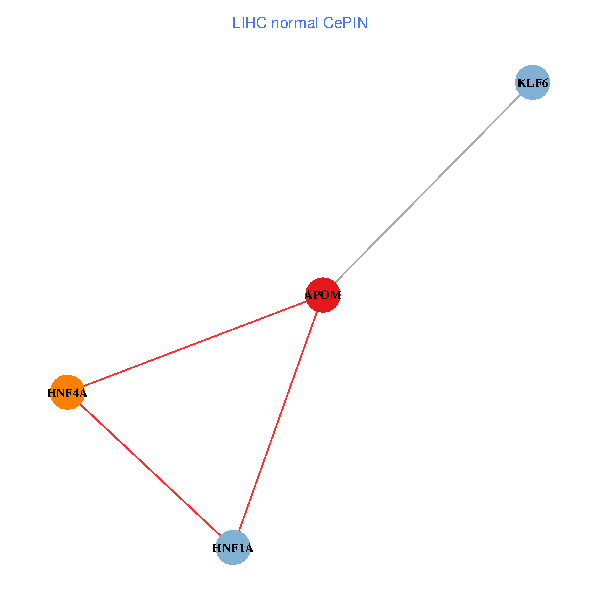
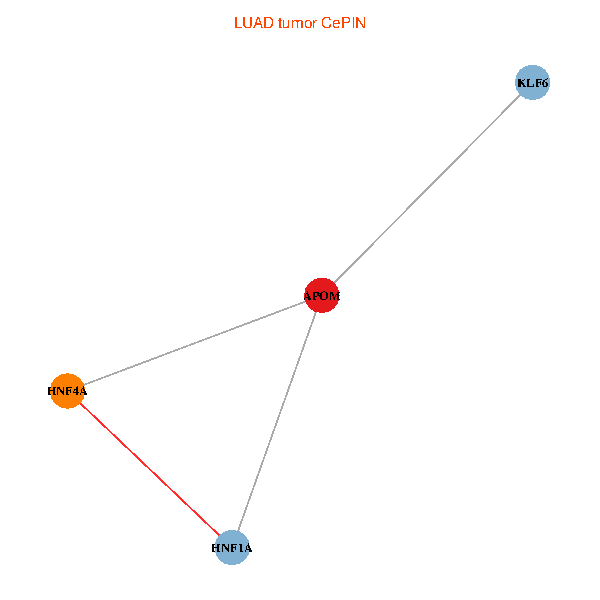
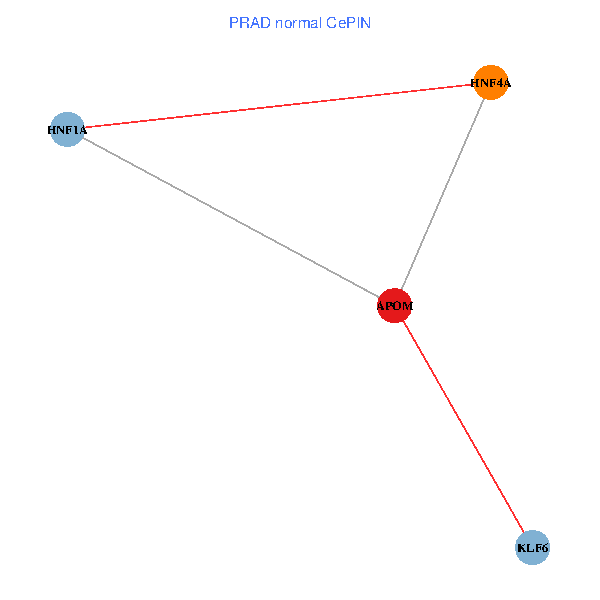
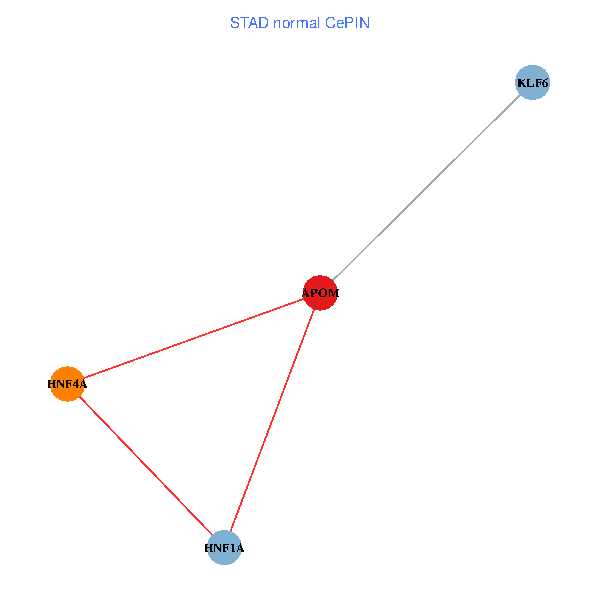
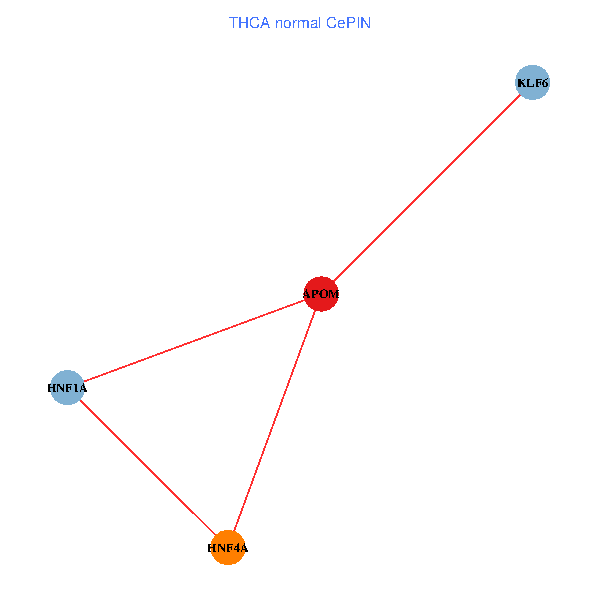
| Co-expressed gene networks based on protein-protein interaction data (CePIN) (TCGA IlluminaHiSeq_RNASeqV2, pan-cancer normalized log2(norm_counts+1) data, version 2016-08-16) (PINA2 ppi data) |
| BRCA (tumor) | BRCA (normal) |
| APOM, HNF4A, HNF1A, KLF6 (tumor) | APOM, HNF4A, HNF1A, KLF6 (normal) |
 |  |
| COAD (tumor) | COAD (normal) |
| APOM, HNF4A, HNF1A, KLF6 (tumor) | APOM, HNF4A, HNF1A, KLF6 (normal) |
 |  |
| HNSC (tumor) | HNSC (normal) |
| APOM, HNF4A, HNF1A, KLF6 (tumor) | APOM, HNF4A, HNF1A, KLF6 (normal) |
 |  |
| KICH (tumor) | KICH (normal) |
| APOM, HNF4A, HNF1A, KLF6 (tumor) | APOM, HNF4A, HNF1A, KLF6 (normal) |
 |  |
| KIRC (tumor) | KIRC (normal) |
| APOM, HNF4A, HNF1A, KLF6 (tumor) | APOM, HNF4A, HNF1A, KLF6 (normal) |
 |  |
| KIRP (tumor) | KIRP (normal) |
| APOM, HNF4A, HNF1A, KLF6 (tumor) | APOM, HNF4A, HNF1A, KLF6 (normal) |
 |  |
| LIHC (tumor) | LIHC (normal) |
| APOM, HNF4A, HNF1A, KLF6 (tumor) | APOM, HNF4A, HNF1A, KLF6 (normal) |
 |  |
| LUAD (tumor) | LUAD (normal) |
| APOM, HNF4A, HNF1A, KLF6 (tumor) | APOM, HNF4A, HNF1A, KLF6 (normal) |
 |  |
| LUSC (tumor) | LUSC (normal) |
| APOM, HNF4A, HNF1A, KLF6 (tumor) | APOM, HNF4A, HNF1A, KLF6 (normal) |
 |  |
| PRAD (tumor) | PRAD (normal) |
| APOM, HNF4A, HNF1A, KLF6 (tumor) | APOM, HNF4A, HNF1A, KLF6 (normal) |
 |  |
| STAD (tumor) | STAD (normal) |
| APOM, HNF4A, HNF1A, KLF6 (tumor) | APOM, HNF4A, HNF1A, KLF6 (normal) |
 |  |
| THCA (tumor) | THCA (normal) |
| APOM, HNF4A, HNF1A, KLF6 (tumor) | APOM, HNF4A, HNF1A, KLF6 (normal) |
 |  |
| Top |
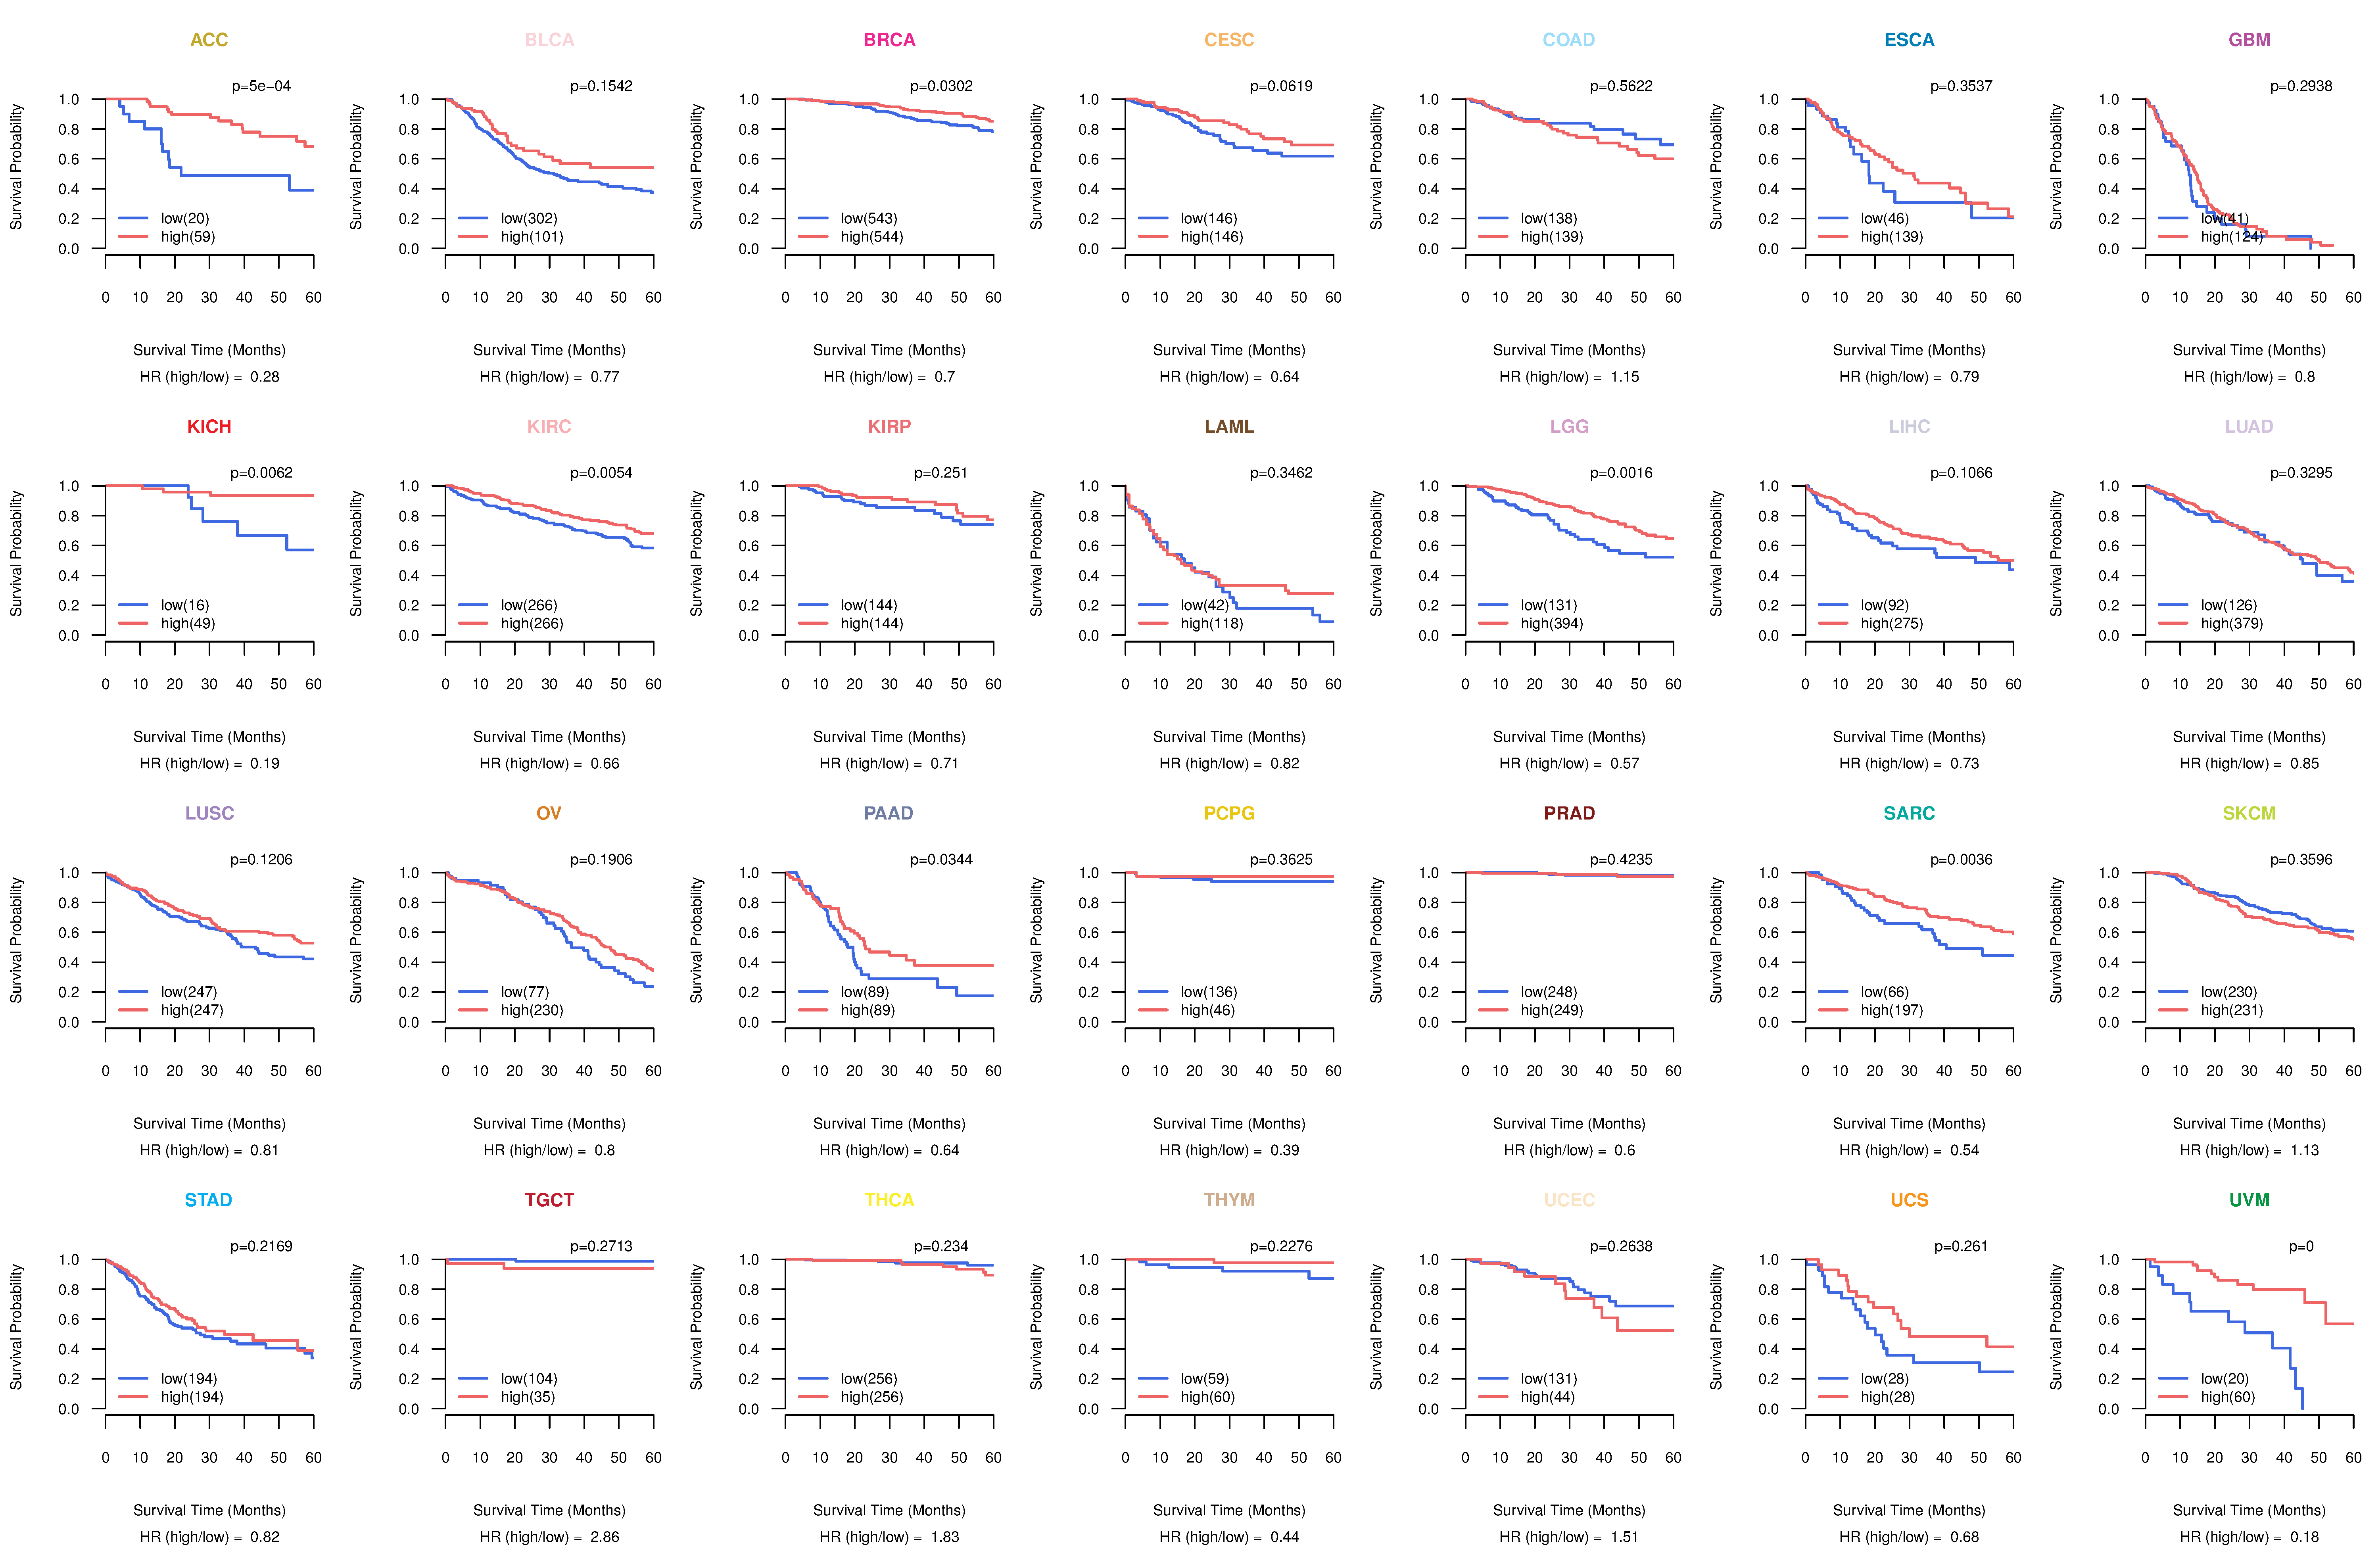
| TissGeneProg for APOM |
| Kaplan-Meier plots with logrank tests of overall survival (OS) using 28 cancer types (TCGA IlluminaHiSeq_RNASeqV2, pan-cancer normalized log2(norm_counts+1) data, version 2016-08-16) (TCGA clinicalMatrix, phenotype data, version 2016-04-27) * Click on the image to enlarge it in a new window. |
 |
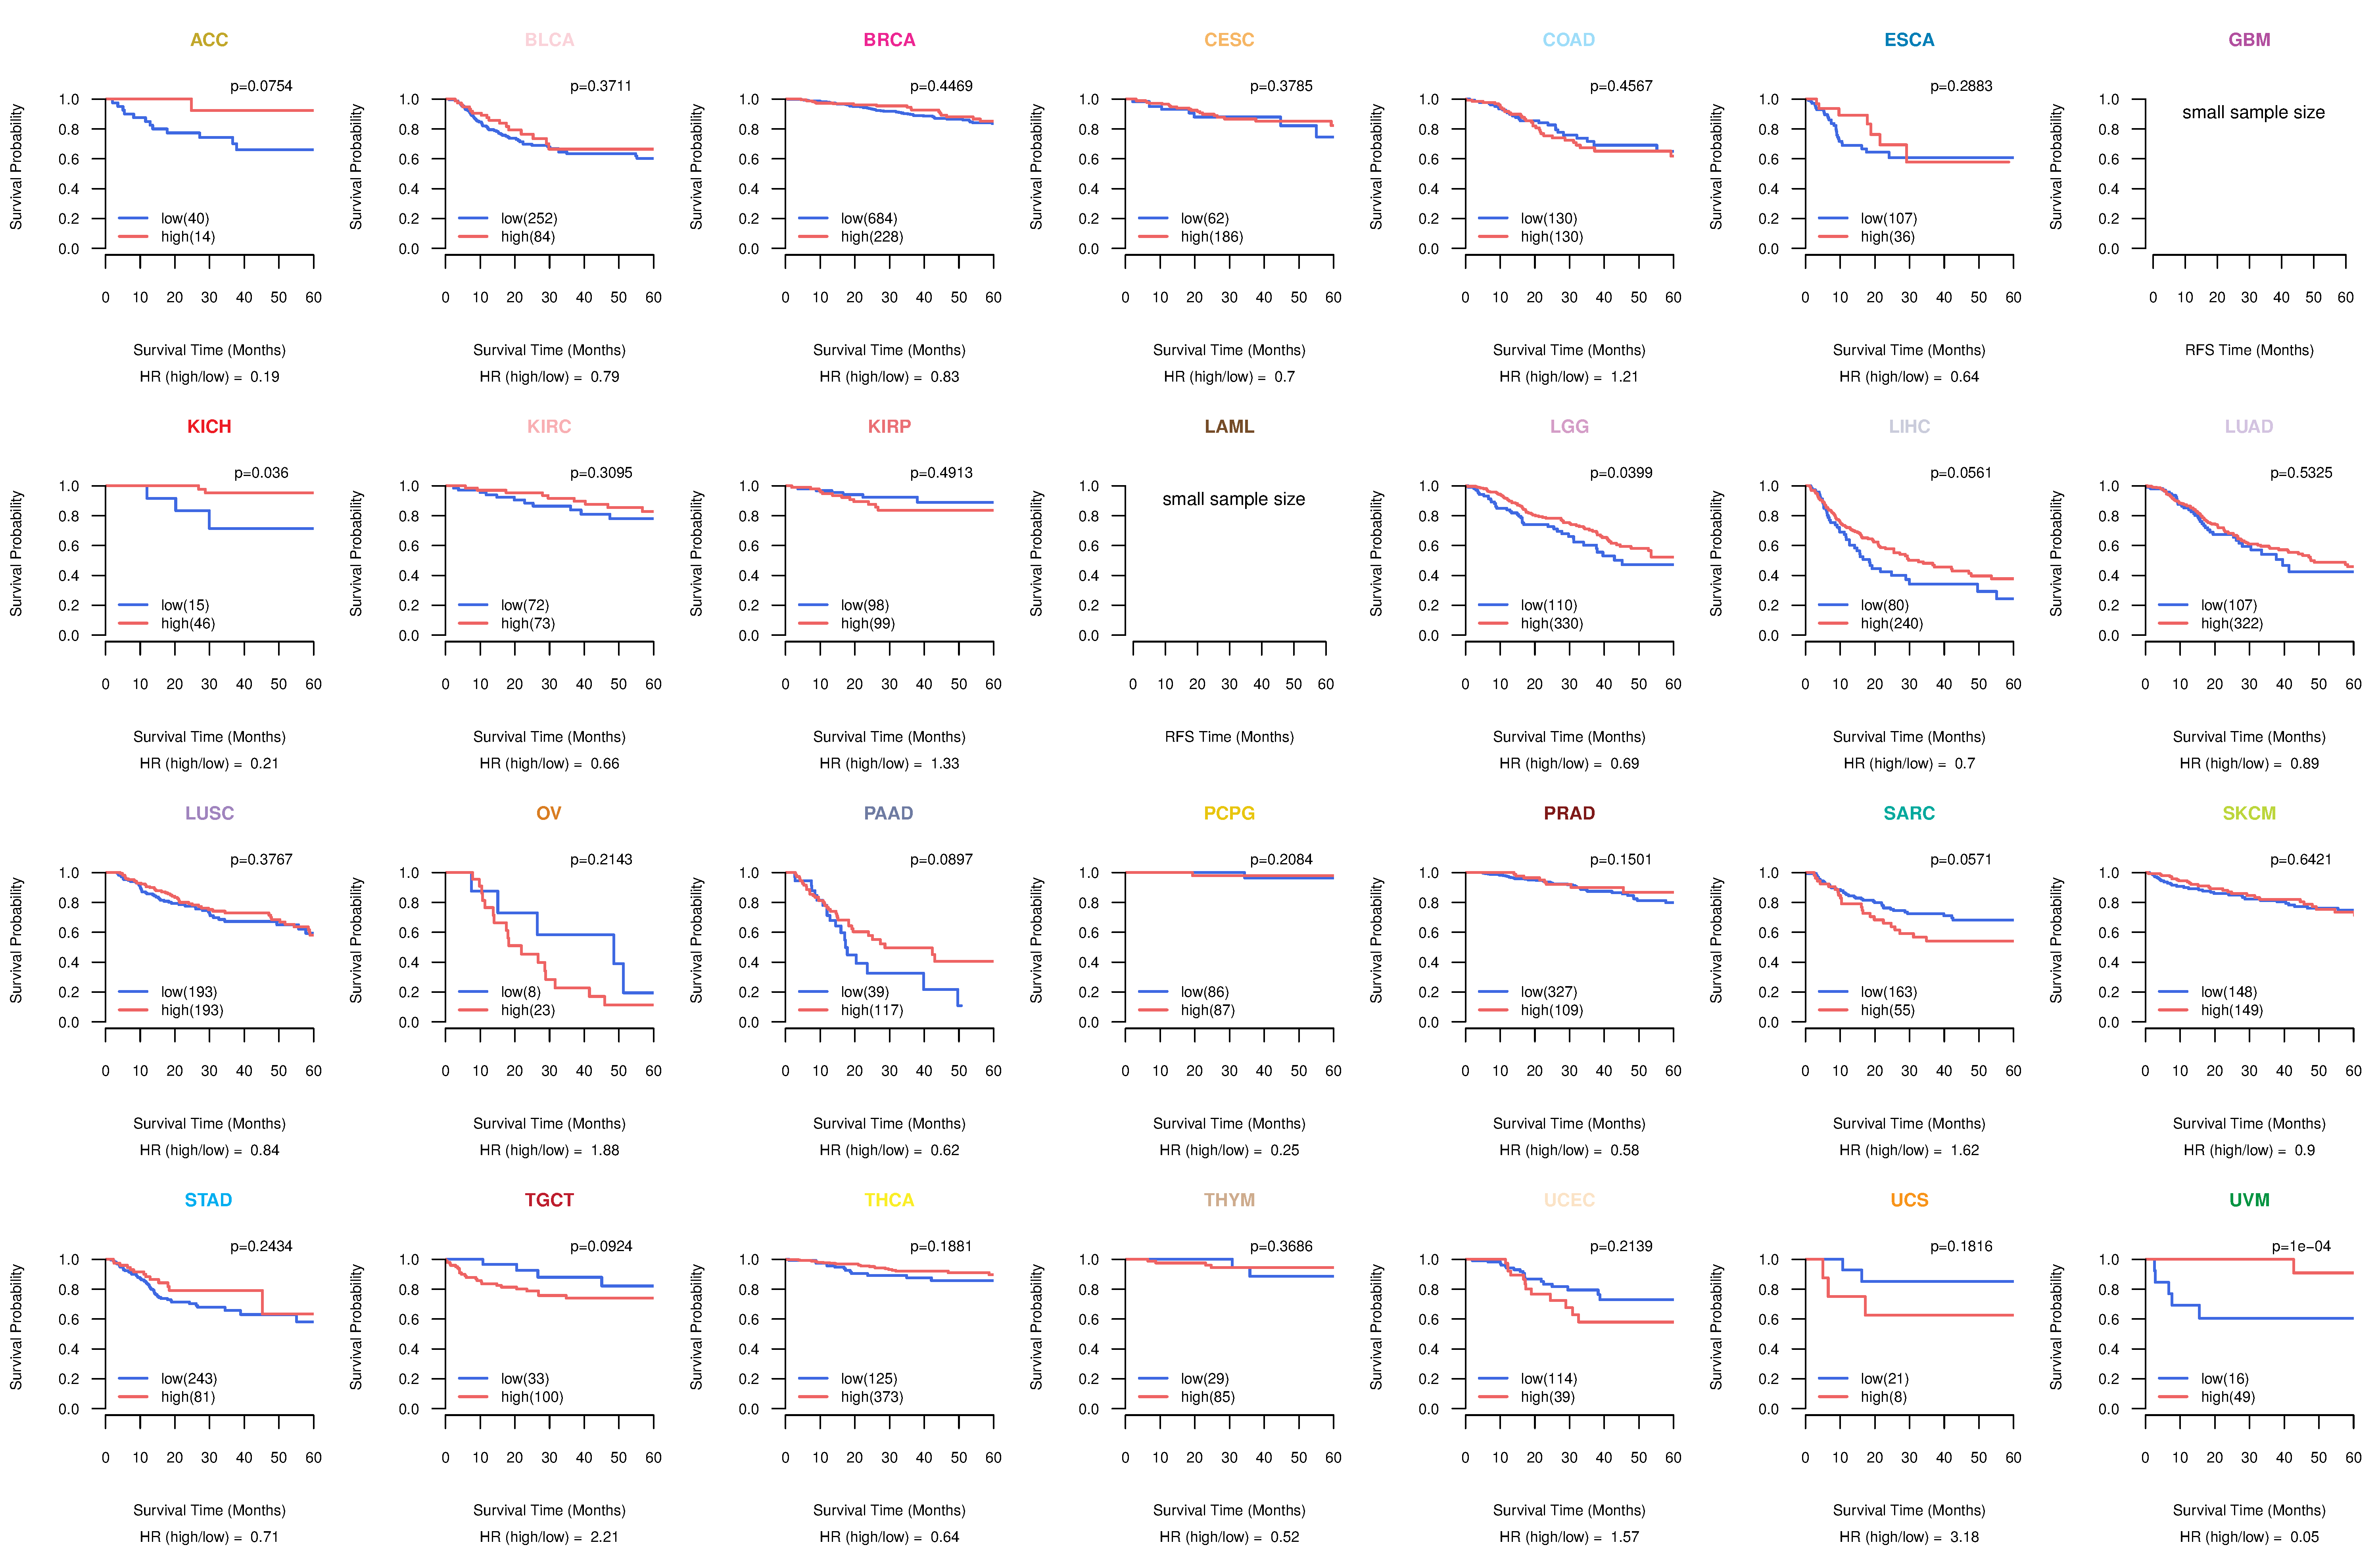
| Kaplan-Meier plots with logrank test of relapse free survival (RFS) using 28 cancer types (TCGA IlluminaHiSeq_RNASeqV2, pan-cancer normalized log2(norm_counts+1) data, version 2016-08-16) (TCGA clinicalMatrix, phenotype data, version 2016-04-27) * Click on the image enlarge it in a new window. |
 |
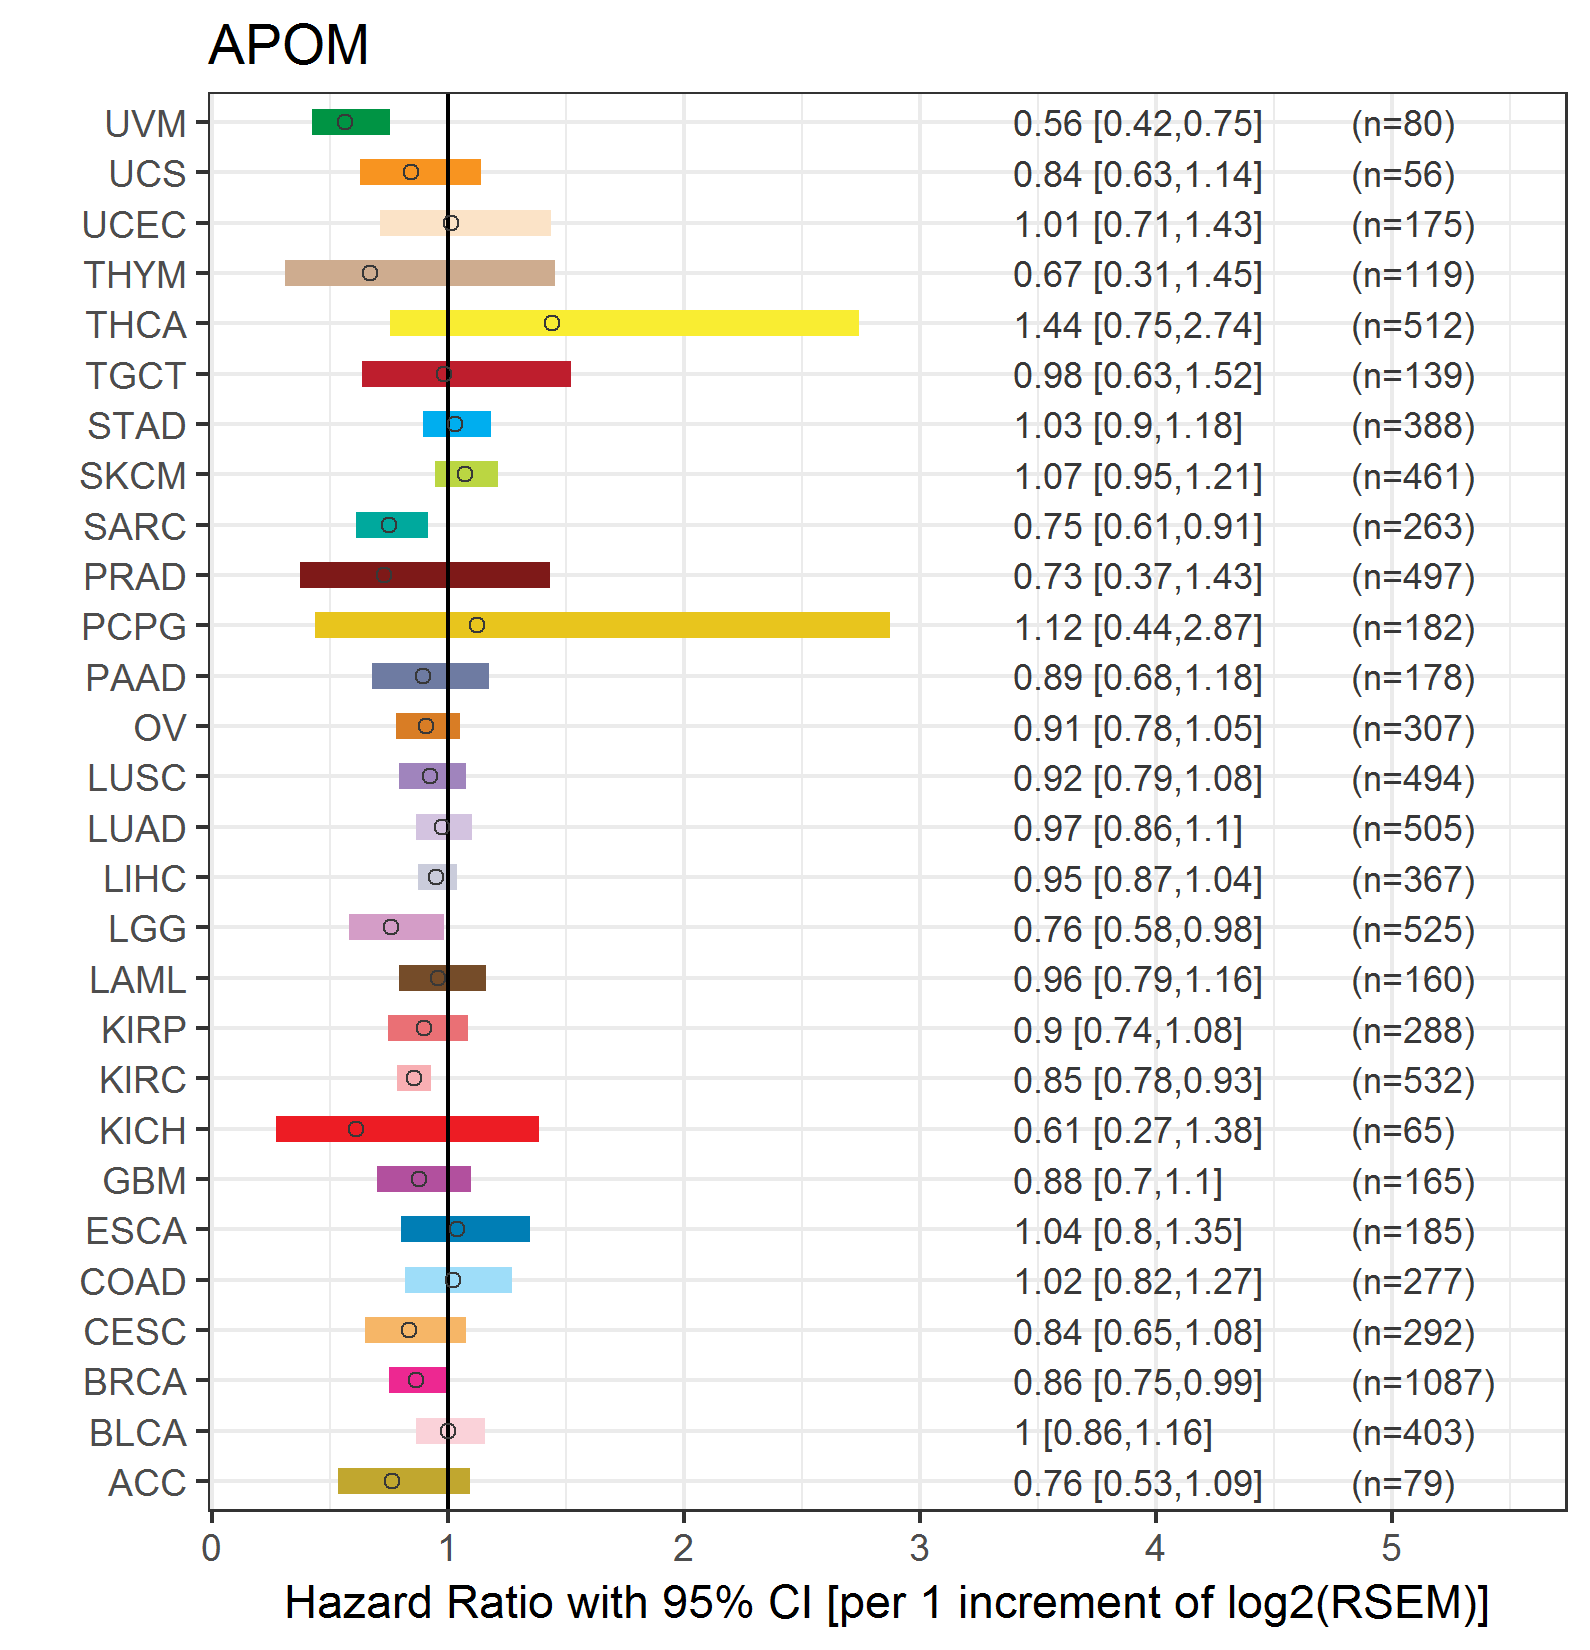
| Forest plot of Cox proportional hazard ratio (HR) and 95% CI of overall survival (OS) using 28 cancer types (TCGA IlluminaHiSeq_RNASeqV2, pan-cancer normalized log2(norm_counts+1) data, version 2016-08-16) (TCGA clinicalMatrix, phenotype data, version 2016-04-27) * Click on the image enlarge it in a new window. |
 |
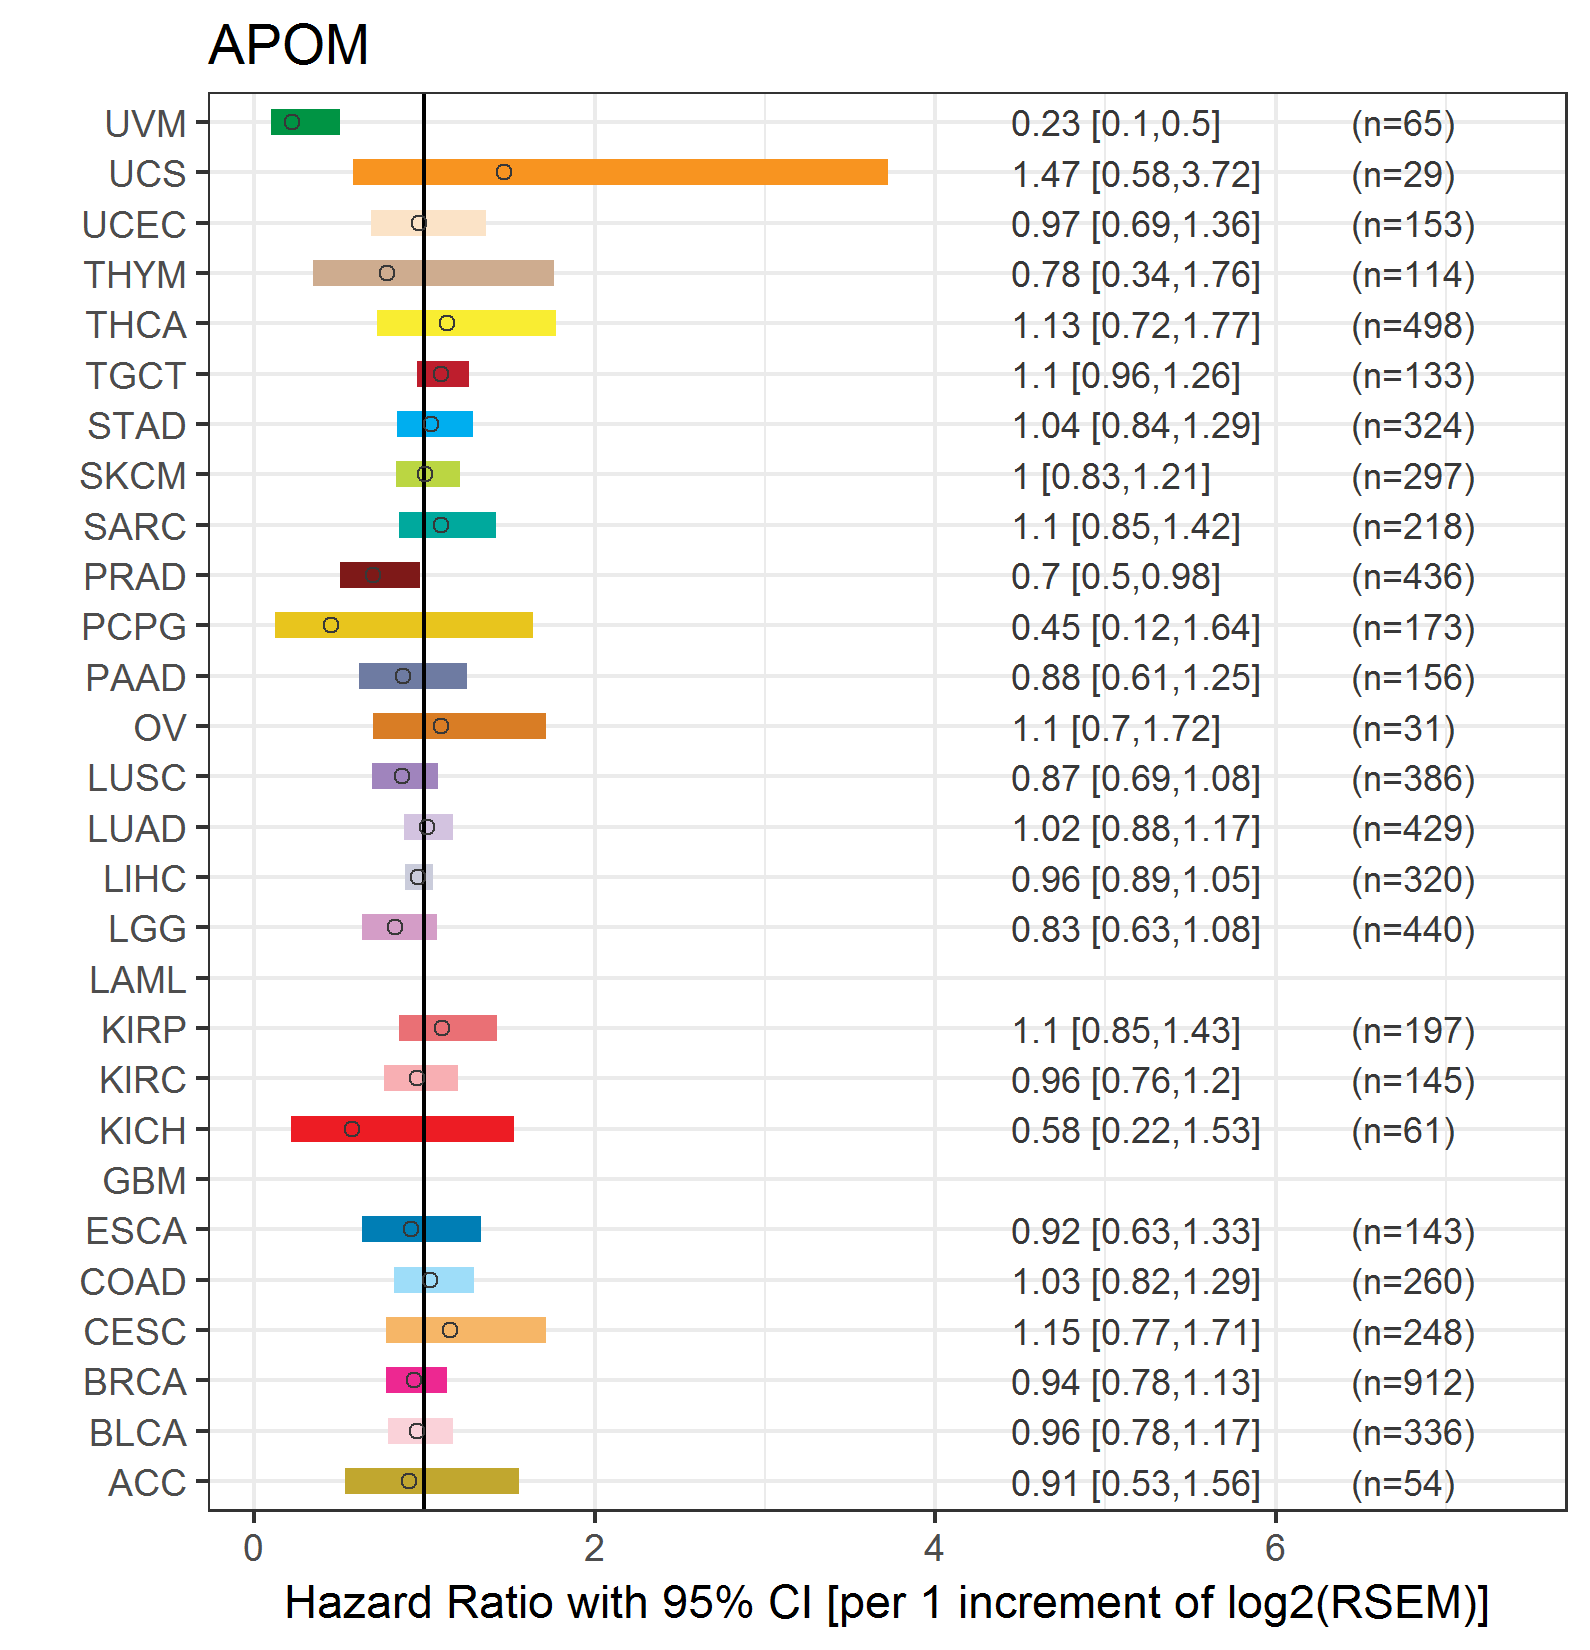
| Forest plot of Cox proportional hazard ratio (HR) and 95% CI of relapse free survival (RFS) using 28 cancer types (TCGA IlluminaHiSeq_RNASeqV2, pan-cancer normalized log2(norm_counts+1) data, version 2016-08-16) (TCGA clinicalMatrix, phenotype data, version 2016-04-27) * Click on the image enlarge it in a new window. |
 |
| Top |
| TissGeneClin for APOM |
| TissGeneDrug for APOM |
| Drug information targeting TissGene (DrugBank Version 5.0.6, 2017-04-01) |
| DrugBank ID | Drug name | Drug activity | Drug type | Drug status |
| Top |
| TissGeneDisease for APOM |
| Disease information associated with TissGene (DisGeNet, 2016-06-01) |
| Disease ID | Disease name | # pubmeds | Source |
| umls:C0003850 | Arteriosclerosis | 8 | BeFree |
| umls:C0004153 | Atherosclerosis | 8 | BeFree |
| umls:C0010054 | Coronary Arteriosclerosis | 6 | BeFree |
| umls:C1956346 | Coronary Artery Disease | 6 | BeFree,GAD,LHGDN |
| umls:C0010068 | Coronary heart disease | 5 | BeFree,GAD |
| umls:C0011860 | Diabetes Mellitus, Non-Insulin-Dependent | 5 | BeFree,GAD |
| umls:C0003873 | Rheumatoid Arthritis | 4 | BeFree,GAD,GWASCAT |
| umls:C0011847 | Diabetes | 3 | BeFree |
| umls:C0011849 | Diabetes Mellitus | 3 | BeFree |
| umls:C2239176 | Liver carcinoma | 3 | BeFree,LHGDN |
| umls:C0011854 | Diabetes Mellitus, Insulin-Dependent | 2 | BeFree,GAD |
| umls:C0242339 | Dyslipidemias | 2 | BeFree |
| umls:C0242379 | Malignant neoplasm of lung | 2 | GWASCAT |
| umls:C0342276 | Maturity onset diabetes mellitus in young | 2 | BeFree |
| umls:C0002395 | Alzheimer's Disease | 1 | LHGDN |
| umls:C0007222 | Cardiovascular Diseases | 1 | BeFree |
| umls:C0015938 | Fetal Macrosomia | 1 | BeFree |
| umls:C0016059 | Fibrosis | 1 | LHGDN |
| umls:C0019189 | Hepatitis, Chronic | 1 | LHGDN |
| umls:C0020456 | Hyperglycemia | 1 | BeFree |
| umls:C0021368 | Inflammation | 1 | LHGDN |
| umls:C0027051 | Myocardial Infarction | 1 | BeFree |
| umls:C0029408 | Degenerative polyarthritis | 1 | GAD |
| umls:C0035126 | Reperfusion Injury | 1 | LHGDN |
| umls:C0152013 | Adenocarcinoma of lung (disorder) | 1 | GAD,GWASCAT |
| umls:C0948008 | Ischemic stroke | 1 | BeFree |
| umls:C3272363 | Ischemic Cerebrovascular Accident | 1 | BeFree |
| umls:C3714514 | Infection | 1 | LHGDN |
|
Copyright 2016-Present - The University of Texas Health Science Center at Houston (UTHealth) Web File Viewing | How to Report, Fraud, Waste and Abuse | State of Texas | Statewide Search | Texas Homeland Security | Site Policies |